Download presentation
Presentation is loading. Please wait.

1
Introduction to Risk Assessment
EH202 April 26, 2009

2
Origin of risk assessment
Early days of EPA (1970s) Visible and demonstrable environmental hazards Federal standards and enforcement provisions seen as solution Little focus on impact of pollution on environment and public health and intrinsic assumption that pollutants have thresholds
 Visible and demonstrable environmental hazards. Federal standards and enforcement provisions seen as solution. Little focus on impact of pollution on environment and public health and intrinsic assumption that pollutants have thresholds.")
3
Cayuga River Fire, New York (1965)
")
4
Love Canal, New York 1942 Love Canal, New York 1978

5
Valley of the Drums Louisville, Kentucky (1979)
")
6
Superfund Site Nassau County, New York

7
Location of National Priority List (NPL) Hazardous Waste Sites
 Hazardous Waste Sites")
8
In ‘70s and ‘80s growing interest in toxic chemicals and their effect on cancer
Cancer rates associated with toxic exposures are unobservable in most circumstances Acceptable level of risk generally 1-in-a-million If any exposure to a substance causes some risk, how can standards be set? When cleaning up a hazardous waste site, at what point is the project completed?

9
What is risk assessment?
The process of identifying and evaluating adverse events that could occur in defined scenarios A quantitative framework for evaluating and combining evidence from toxicology, epidemiology, and disciplines, with a goal of providing a basis for decision making

10
“Risk assessment ... is a way of examining risks so that they may be better avoided, reduced, or otherwise managed ...” “Risk assessments, except in the simplest of circumstances, are not designed for making judgments, but to illuminate them ...” Source: Wilson and Crouch, Science, 1987.

11
Evaluate the risk, Then decide what to do…
Risk assessment is the use of the factual base to define the health effects of exposure of individuals or populations to hazardous materials and situations Risk management is the process of weighing policy alternatives and selecting the most appropriate regulatory action ... integrating the results of risk assessment with social, economic, and political concerns to reach a decision National Research Council (1983)
")
12
Four Steps of Risk Assessment
Hazard Identification – the process of determining a particular chemical is causally linked to particular health effects Dose-Response Assessment – process of characterizing the relationship between the dose of an agent and the incidence of an adverse health effect Exposure Assessment – involves determining the size and nature of the population that has been exposed to the toxicant under consideration Risk Characterization – integration of the above three steps which produces an estimate of the magnitude of the public-health problem

13
Hazard Identification
Examines the evidence that associates exposure to an agent with its toxicity or potential to cause harm Collection of data Various sources Toxicological and epidemiological studies Information should answer these questions Does exposure to the substance produce any adverse effects? If yes, what are the circumstances associated with the exposure? Produces a qualitative judgment about the strength of that evidence

14
Philippe Grandjean

15
The Dose-Response Obtain a mathematical relationship between the amount of a toxin an individual is exposed to and an adverse health response Frequently only have animal test data 0.1 0.2 0.3 0.4 0.5 0.6 0.7 0.8 0.9 1 LOAEL Proportion Responding NOAEL 2 4 6 8 10 Dose (mg/kg/day) Harvard Center for Risk Analysis
 Harvard Center for Risk Analysis.")
16
Applying toxicology The dose is an exposure averaged over a specific length of time Usually assume a lifetime of exposure (70 yrs) The response (risk) has no units It is a probability of an adverse effect Extrapolate from high to low dose Assumes response in animals is comparable to humans Response Experimental Region Dose Human Exposure Region
 has no units. It is a probability of an adverse effect. Extrapolate from high to low dose. Assumes response in animals is comparable to humans. Response. Experimental Region. Dose. Human Exposure Region.")
17
Exposure Assessment Process of measuring or estimating the intensity, frequency, and duration of human exposure to an agent present in the environment, or estimating the exposures that might occur from the release of new chemicals Quantifying Exposures: Direct personal exposure measurements Build exposure model using concentration measurements Fate and transport model to estimate/simulate exposures Biomonitoring to capture dose measures

18
Exposure Assessment – a few issues to consider
Exposure to whom? Sensitive subpopulations Exposure over what time period? Lifetime exposure, peak exposure, etc. Exposure through which pathway? Inhalation, food consumption, drinking water, dermal exposure Do important factors modify the concentration- exposure relationship? What about the exposure-dose relationship?

19
Risk Characterization Cancer vs Non-Cancer
Cancer is treated as a stochastic response Any dose carries a risk Increasing dose of chemical doesn't increase the severity of the response, only the likelihood that it will occur Potency – slope of the dose response curve Incremental lifetime cancer risk = CDI * potency factor Where, CDI = Average daily dose (mg/day) Body weight (kg)
 Body weight (kg)")
20
Example: Benzene emissions
Suppose an industrial facility that emits benzene is being proposed for a site near a residential neighborhood. Air quality models predict that 6-% of the time, prevailing winds will blow benzene away from the neighborhood but 40% of the time, the benzene concentrations will be 0.01 mg/m3. Should this plant be allowed to be built? What information do you need to calculate the chronic daily intake?

22
Ex. An occupational exposure
What is the incremental cancer risk for a 60- kilogram worker exposed to a carcinogen that has a potency factor of 0.02 mg/kg/day 5 days per week, 50 weeks per year, over 25 year period?

23
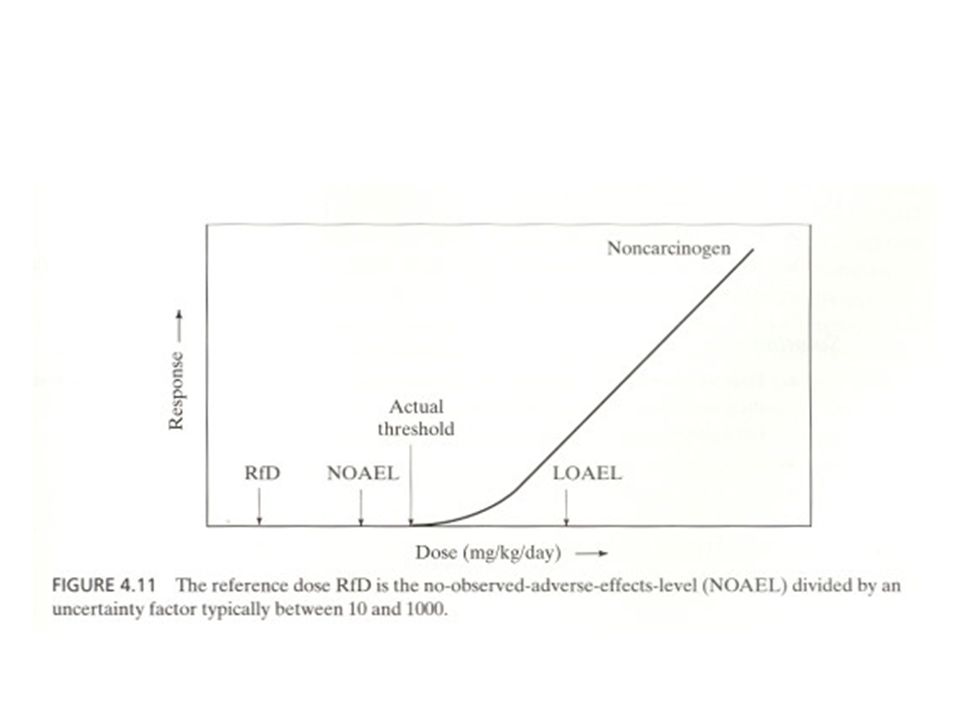
Non-Cancer Risk Assessment
Non-cancer responses are considered deterministic Thresholds exist Exposure below the threshold poses no risk Reference Dose– obtained by dividing the NOEL by uncertainty factors and is expressed in mg/kg/day Hazard Quotient = Average daily dose during exposure period (mg/kg/day) RfD U.S. EPA Guidelines for Development of RfD* Extrapolation Uncertainty Factor Animal to Human (H) 10 Average to Sensitive Human (S) 10 LOAEL to NOAEL (L) 10 Less than Chronic to Chronic (C) 10 Data Quality (MF) 1-10
 RfD. U.S. EPA Guidelines for Development of RfD* Extrapolation Uncertainty Factor. Animal to Human (H) 10. Average to Sensitive Human (S) 10. LOAEL to NOAEL (L) 10. Less than Chronic to Chronic (C) 10. Data Quality (MF)")
25
Ex. Drinking water contaminants
Suppose drinking water contains 1.0 mg/L of toluene and has a RfD of mg/kg-day based on changes to the liver and kidneys. A 70 kg adult drinks 2-L per day of this water for 10 years. Is this a safe exposure?

26
Ex. Tuna How could you estimate exposure? How could you estimate dose?
Measure the environment—the amt of mercury in the tuna. Do biological monitoring---blood or urine.

27
Back to tuna … What is the exposure? What is the dose?
Methylmercury Range Mercury TUNA, fresh 0.22 0-0.9 0.69 TUNA, canned 0.17 0-0.75 0.2 TUNA, white albacore canned 0.24 0-0.49 0.36 TUNA, albacore canned -- 0.35 TUNA, chunk light tongol 0.08 TUNA, canned chunk light 0.19 0-0.18 0.12 0-0.72 FDA maximum permissible level of 1 ppm in seafood acceptable daily intake (ADI) for methylmercury (as mercury) of 30 µg and assumes a maximum fish ingestion rate of 30 g/day--the equivalent of one 7-8 oz serving per week--by a 70-kg adult. Higher ingestion rates, lower body weights, higher mercury levels in the fish, or a combination of these factors would result .17 ug/gram *3.491 gram/day = 0.6 ug/day … need to divide by BW (0.009 ug/kg) Provisional tolerable weekly intake (PTWI) of 1.6 µg/kg bw – WHO (0.22 ug/kg bw) FDA maximum permissible level of 1 ppm Data from FDA
 for methylmercury (as mercury) of 30 µg and assumes a maximum fish ingestion rate of 30 g/day--the equivalent of one 7-8 oz serving per week--by a 70-kg adult. Higher ingestion rates, lower body weights, higher mercury levels in the fish, or a combination of these factors would result. .17 ug/gram *3.491 gram/day = 0.6 ug/day … need to divide by BW (0.009 ug/kg) Provisional tolerable weekly intake (PTWI) of 1.6 µg/kg bw – WHO 2004 (0.22 ug/kg bw) FDA maximum permissible level of 1 ppm. Data from FDA.")
28
NEJM 2002; 347:1735

29
US EPA Exposure Factors Handbook

30
What is average mercury dose?

31
Got Mercury ?

32
Perception of Risk Attributes that elevate perception of risk Attributes that lower perception of risk Involuntary Voluntary Exotic Familiar Uncontrollable Controllable Controlled by others Controlled by self Dread Accept Catastrophic Chronic Caused by humans Natural Inequitable Equitable Permanent effect Temporary effect No apparent benefit Visible benefits Unknown Known Uncertainty Certainty Source: Based on Slovic (1987) and Slovic et al (1980)
 and Slovic et al (1980)")
33
Activities that increase mortality risk by one in a million
Activity Types of risk Smoking 1.4 cigarettes Cancer, heart disease Drinking ½ liter of wine Cirrhosis of the liver Spending 1 hour in a coal mine Black lung disease Living 2 days in New York or Boston Air pollution Travelling 300 miles by car Accident Flying 1000 miles by jet Flying 6000 miles by jet Cancer by cosmic radiation Traveling 10 miles by bicycle Living 2 months with a cigarette smoker Eating 40 tablespoons of peanut butter Liver cancer caused by aflatoxin Living 50 years within 5 miles of nuclear reactor Accident releasing radiation Source: Wilson 1979

Similar presentations


 DUE TO ARSENIC AND BENZENE.>")


 The practice.>")


>")