Download presentation
Presentation is loading. Please wait.

1
Jessica Schmidt

2
Presentation Outline Snapshot Snapshot Past Positions Past Positions Profile Profile History History Current News Current News Financial Statements Financial Statements Industry Comparison Industry Comparison Stock Comparison Stock Comparison Trend Analysis Trend Analysis Common Size Analysis Common Size Analysis Stock Valuation Model Stock Valuation Model EVA & MVA Model EVA & MVA Model Free Cash Flow Free Cash Flow Summary of Valuations Summary of Valuations Analyst Recommendations Analyst Recommendations Risk Risk Effect on SMIP Portfolio Effect on SMIP Portfolio Recommendation Recommendation

3
Snapshot Market Cap: 179,544.50 MLN Market Cap: 179,544.50 MLN Industry: Money Center Banks Industry: Money Center Banks Sector: Financial Sector: Financial Recent Stock Price: $43.98 (9-24-04) Recent Stock Price: $43.98 (9-24-04) 52wk High and Low: $44.99 - $36.225 52wk High and Low: $44.99 - $36.225 Beta: 0.88 Beta: 0.88 Ticker Symbol: BAC Ticker Symbol: BAC
 Recent Stock Price: $43.98 ( ) 52wk High and Low: $ $ wk High and Low: $ $ Beta: 0.88 Beta: 0.88 Ticker Symbol: BAC Ticker Symbol: BAC")
4
Past Positions in the Financial Industry Chase Manhattan Chase Manhattan –Purchased 57 shares @ $86.01 = $4,902.81 Apr-99 –Sold 57 shares @ $82.54 = $4,705.09 Nov-99 –Loss Incurred = $197.72 –Current Worth = 85.5 shares JPM = $3,398.63 Fleet Boston Fleet Boston –Purchased 100 shares @ $41.30 = $4,129.50 Nov-99 –Sold 100 shares @ $37.39 = $3,739.12 Apr-00 –Loss Incurred = $390.38 –Current Worth = 111.06 shares of BAC = $4,884.42 Commerce Bank Commerce Bank –Purchased 130 shares @ $48.67 = $4,866.90 Apr-03 –Sold 130 shares @ $50.34 = $6,544.20 –Gain = $1,677.30 –Current Worth = 130 @ $55.73 = $7,244.90

5
Profile Nation’s First coast-to-coast bank Nation’s First coast-to-coast bank #1 in U.S. large corporate banking relationships #1 in U.S. large corporate banking relationships #4 in lead investment banking relationships #4 in lead investment banking relationships #1 in loan syndication #1 in loan syndication One of the largest banks for assets in the US. behind C, JPM, and WB. One of the largest banks for assets in the US. behind C, JPM, and WB. 5,700+ locations in 24+ states, reaching internationally most notably Latin America 5,700+ locations in 24+ states, reaching internationally most notably Latin America Largest segment is the Consumer and Commercial Banking, offering deposit products, credit cards, insurance, loans, treasury services, and financing for cars, boats, and RV dealerships. Largest segment is the Consumer and Commercial Banking, offering deposit products, credit cards, insurance, loans, treasury services, and financing for cars, boats, and RV dealerships. Global Corporate and Investment Banking, including Banc of America Securities. This segment offers services (brokerage advisory, and capital markets services) to corporate and institutional clients. Global Corporate and Investment Banking, including Banc of America Securities. This segment offers services (brokerage advisory, and capital markets services) to corporate and institutional clients. CA, FL, MD, & Washington State Market share leadership CA, FL, MD, & Washington State Market share leadership Domestically targeting Hispanic customers Domestically targeting Hispanic customers Domestically targeting Chinese, Korean, & Vietnamese in CA Domestically targeting Chinese, Korean, & Vietnamese in CA
 to corporate and institutional clients. Global Corporate and Investment Banking, including Banc of America Securities. This segment offers services (brokerage advisory, and capital markets services) to corporate and institutional clients. CA, FL, MD, & Washington State Market share leadership CA, FL, MD, & Washington State Market share leadership Domestically targeting Hispanic customers Domestically targeting Hispanic customers Domestically targeting Chinese, Korean, & Vietnamese in CA Domestically targeting Chinese, Korean, & Vietnamese in CA.")
6
History 1957 - Commercial National Bank of Charlotte, N.C. merged with American Trust Co., forming American National Bank 1957 - Commercial National Bank of Charlotte, N.C. merged with American Trust Co., forming American National Bank 1960 - merged with Security National, forming North Carolina National Bank 1960 - merged with Security National, forming North Carolina National Bank 1968 - formed NCNB (holding company) 1968 - formed NCNB (holding company) 1988 - profited from S&L crisis → doubling its assets 1988 - profited from S&L crisis → doubling its assets 1993 - Bought Chicago Research & Trading 1993 - Bought Chicago Research & Trading 1997 - Purchased Boatman’s Bancshares & Montgomery Securities, creating Banc of America Securities 1997 - Purchased Boatman’s Bancshares & Montgomery Securities, creating Banc of America Securities 1998 - bought Barnett Banks & merged with NationsBank 1998 - bought Barnett Banks & merged with NationsBank 1999 - sold its European and Asian private banking operations to UBS. It also bought Associates First Capital, 50% of Marsico Capital Management. 1999 - sold its European and Asian private banking operations to UBS. It also bought Associates First Capital, 50% of Marsico Capital Management. 2001 - Acquired BA Merchant Services & became Bank of America 2001 - Acquired BA Merchant Services & became Bank of America 2004 - merged with Fleet Boston 2004 - merged with Fleet Boston August 30 th 2004 → stock split 2:1 August 30 th 2004 → stock split 2:1
 formed NCNB (holding company) profited from S&L crisis → doubling its assets profited from S&L crisis → doubling its assets Bought Chicago Research & Trading Bought Chicago Research & Trading Purchased Boatman’s Bancshares & Montgomery Securities, creating Banc of America Securities Purchased Boatman’s Bancshares & Montgomery Securities, creating Banc of America Securities bought Barnett Banks & merged with NationsBank bought Barnett Banks & merged with NationsBank sold its European and Asian private banking operations to UBS. It also bought Associates First Capital, 50% of Marsico Capital Management sold its European and Asian private banking operations to UBS. It also bought Associates First Capital, 50% of Marsico Capital Management Acquired BA Merchant Services & became Bank of America Acquired BA Merchant Services & became Bank of America merged with Fleet Boston merged with Fleet Boston August 30 th 2004 → stock split 2:1 August 30 th 2004 → stock split 2:1.")
7
Current News 9-22-04 Fed Moves Rekindle Interest in Saving 9-22-04 Fed Moves Rekindle Interest in Saving 9-23-04 Bank of America to Move Wealth/Invest Mgmt Ops to Boston 9-23-04 Bank of America to Move Wealth/Invest Mgmt Ops to Boston 9-28-04 Cisco Gets Internet-Phone Pact from Bank of America for U.S. 9-28-04 Cisco Gets Internet-Phone Pact from Bank of America for U.S. 9-28-04 Banks Come Under Scrutiny for Role in Parmalat Scandal 9-28-04 Banks Come Under Scrutiny for Role in Parmalat Scandal 9-29-04 Banc of America Securities Hires Liu, Month, Schloendorff and Rogers in the Technology Investment Banking Group 9-29-04 Banc of America Securities Hires Liu, Month, Schloendorff and Rogers in the Technology Investment Banking Group

8
Financial Statements Refer to handout Refer to handout

9
Industry Comparison

10
BAC and Competitors

11
Stock Comparison: 1 year

12
Stock Comparison: 3 years

13
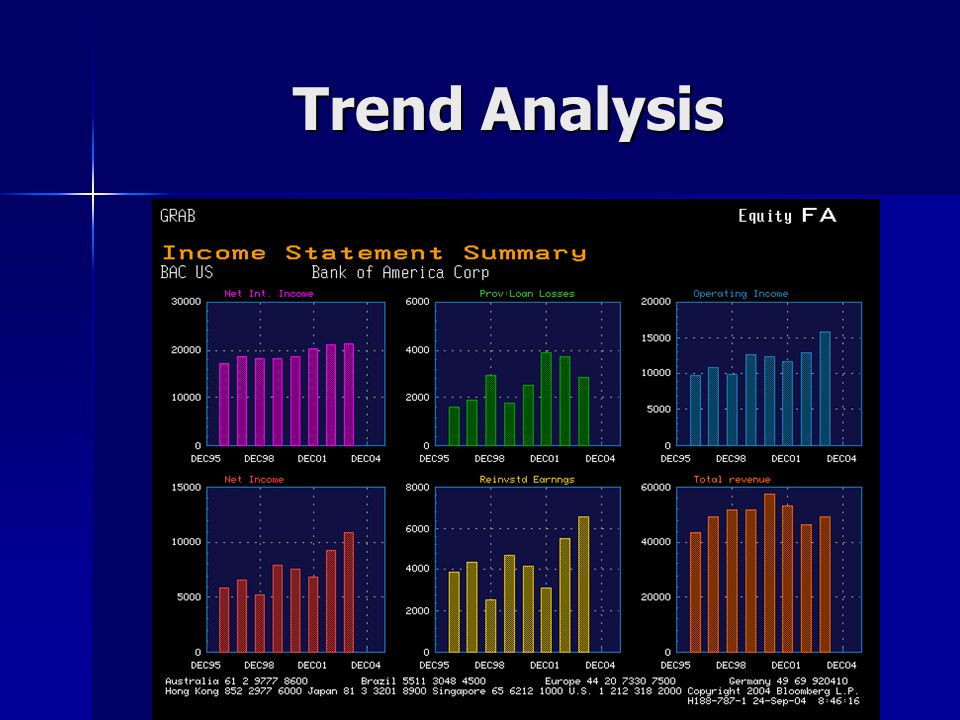
Trend Analysis

15
Product Segmentation

16
Geographical Segmentation

17
Common Size Analysis

18
Stock Valuation

19
EVA & MVA Model

20
Free Cash Flow

21
Intrinsic Value

22
Summary of Valuations Stock Evaluation Model: Stock Evaluation Model: Zero Growth Model = $69.52 Zero Growth Model = $69.52 Price/Earnings Model = $124.17 Price/Earnings Model = $124.17 EVA & MVA Model: EVA & MVA Model: EVA – Creating Shareholder Wealth EVA – Creating Shareholder Wealth MVA – Creating Shareholder Wealth MVA – Creating Shareholder Wealth Free Cash Flow Model: Free Cash Flow Model: NPV of FCF = $613,671 NPV of FCF = $613,671 Per Share Value = $172.03 Per Share Value = $172.03 Intrinsic Value Model: Intrinsic Value Model: Intrinsic Value = $48.06/share Intrinsic Value = $48.06/share

23
Analyst Recommendations 21 Analysts Rate —12 Month Consensus: 21 Analysts Rate —12 Month Consensus: –Buys = 61.90% (13 analysts) –Holds = 33.33% (7 analysts) –Sells = 4.76% (1 analyst) 12 Month Consensus Average: 12 Month Consensus Average: –BAC = 3.762 –U.S. avg. = 3.702 –S&P 500 Div Bank = 3.693 –S&P 500 Index = 3.562 –S&P 100 Index = 3.717

24
Risk Risk Grade = 68 Risk Grade = 68 6 Month Minimum = 60 6 Month Minimum = 60 6 Month Maximum = 79 6 Month Maximum = 79 6 Month Average = 68 6 Month Average = 68

25
Risk

26
Why SMIP will Benefit from BAC Assist in the diversification Assist in the diversification High Dividends High Dividends Settle Investigation of Mutual Fund Scandal with SEC Settle Investigation of Mutual Fund Scandal with SEC $7 billion of Share Buyback $7 billion of Share Buyback Parmalat Headline risk built into stock Parmalat Headline risk built into stock Low P/E Low P/E Benefit from Rate Hike Benefit from Rate Hike High growth potential High growth potential

27
Recommendation Buy 130 shares of BAC @ current market price Buy 130 shares of BAC @ current market price 6.50% of portfolio in Financial Sector 6.50% of portfolio in Financial Sector Money Center Banks Industry weight in S&P 500 = 3.861% Money Center Banks Industry weight in S&P 500 = 3.861%

Similar presentations


>")
 at a financial institution. Certificates of.>")


 Katelyn Howard.>")


