Download presentation
Presentation is loading. Please wait.

1
Counting poverty orderings and deprivation curves Casilda Lasso de la Vega University of the Basque Country 10th International Meeting of the Society for Social Choice and Welfare Moscow, Russia, July 21-24, 2010

2
Counting poverty orderings and deprivation curves Deprivation/Poverty are multidimensional phenomena. Most of the multidimensional indices proposed deal well only with quantitative data. Most of the data available to measure capabilities or dimensions of poverty are either ordinal or categorical. An alternative to the traditional indices is the counting approach (Atkinson, 2003): the number of (weighted) dimensions in which a person is deprived. (Chakravarty and D’Ambrosio, 2006, Bossert et al, 2007, Alkire and Foster, 2007 and Bossert et al, 2009) Motivation:
: the number of (weighted) dimensions in which a person is deprived. (Chakravarty and D’Ambrosio, 2006, Bossert et al, 2007, Alkire and Foster, 2007 and Bossert et al, 2009) Motivation:.")
3
Counting poverty orderings and deprivation curves The measurement of poverty involves: -method to identify the poor, -an aggregative procedure. Aim: Dominance criteria that provides unanimous rankings for - a range of identification cut-offs and - a wide class of counting multidimensional measures. (Shorrocks,1983, and Foster and Shorrocks, 1988) Motivation (cont):
 Motivation (cont):.")
4
Counting poverty orderings and deprivation curves Outline: The vector of deprivation counts and the identification method. Counting poverty measures. FD-curves: graphical representation for the headcount ratio and dominance criteria. SD-curves: graphical representation for the multidimensional headcount ratio and for the adjusted headcount ratio, and dominance criteria. Conclusions and further research.

5
1.The vector of deprivation counts and the identification method. n=10 individuals and d=4 dimensions A: achievement matrix Why is it important to focus on this vector of deprivation counts?

6
1.The vector of deprivation counts and the identification method. Who are the poor?

7
1.Focus (F). 2.Symmetry (S). 3.Replication Invariance (RI). 4.Dimesional Monotonicity (M). 5.Distribution sensitivity (DS). 2. Counting poverty measures. The number of dimensions is fixed. Let G be the set of all vectors of deprivation counts.
. 5.Distribution sensitivity (DS). 2. Counting poverty measures. The number of dimensions is fixed. Let G be the set of all vectors of deprivation counts..")
8
Examples. Headcount ratio, H( k ) for all values of k : 1,..,d. Adjusted headcount ratio, M( k ) for all values of k : 1,..,d. The class of poverty measures characterized by Bossert et al. (2009) a convex function. 2. Counting poverty measures.
 for all values of k : 1,..,d. The class of poverty measures characterized by Bossert et al. (2009) a convex function. 2. Counting poverty measures..")
9
3. FD-curves: the headcount ratio. FD-curve

10
Given two vectors of deprivation counts c and c’, we say that c’ FD dominates c if FD (c’ ; p) ≥ FD (c ; p) and the strict inequality holds at least once. 3. FD-dominance. FD-dominance:

11
Proposition 1. c’ FD dominates c if and only if P( c’ ) ≥ P( c ) for all P M 1 and for all identification cut-offs k 3. FD-dominance. Let G be the set of all vectors of deprivation counts.
 ≥ P( c ) for all P M 1 and for all identification cut-offs k 3. FD-dominance. Let G be the set of all vectors of deprivation counts..")
12
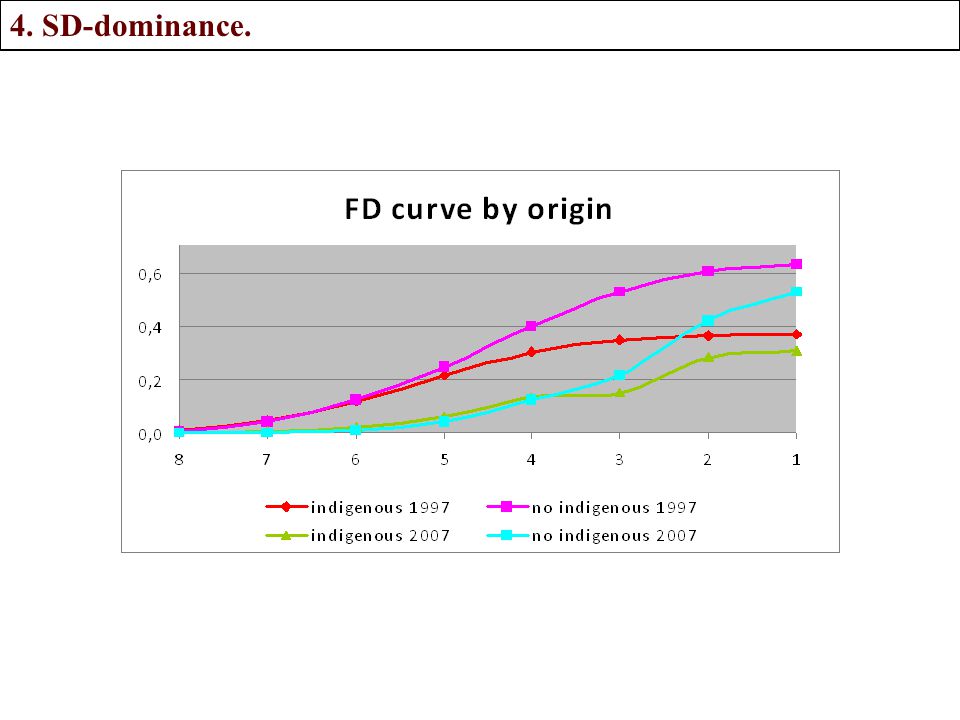
3. FD-dominance.

14
4. SD-curves: the headcount ratio and the adjusted headcount ratio. SD-curve

15
4. SD-curves: properties Start at (0,0). Non-decreasing concave function. Two polar cases: Nobody is deprived: horizontal axis. Everybody is deprived in all dimensions: the diagonal line. Some interesting characteristics:

16
The slope is to change d times: the headcount ratio and the adjusted headcount ratio are recovered in that points. The average deprivation share across the poor is also represented in the graph by the slope of the ray from (0,0) to A(k). 4. SD-curves: properties Some interesting characteristics:
 to A(k). 4. SD-curves: properties Some interesting characteristics:.")
17
Given two vectors of deprivation counts c and c’, we say that c’ SD dominates c if SD (c’ ; p) ≥ SD (c ; p) and the strict inequality holds at least once. 4. SD-dominance. SD-dominance:

18
Proposition 2. c’ SD dominates c if and only if P( c’ ) ≥ P( c ) for all P M 2 and for all identification cut-offs k. 4. SD-dominance. Let G be the set of all vectors of deprivation counts.
 ≥ P( c ) for all P M 2 and for all identification cut-offs k. 4. SD-dominance. Let G be the set of all vectors of deprivation counts..")
19
4. SD-dominance.

21
Conclusions and further research. The deprivation curves provide a graphical representation of the headcount ratio, the adjusted headcount ratio. They also provide a tool for checking unanimous orderings according to a wide class of poverty measures and to a range of identification cut-offs. Weighted dimensions may be incorporated in the analysis. Statistical inference tests may be implemented. Thank you for your attention

Similar presentations