Download presentation
Presentation is loading. Please wait.

1
NATS 101-06 Lecture 20 Anthropogenic Climate Change

2
What is Climate Change? Climate change - A significant shift in the mean state and event frequency of the atmosphere. Climate change has been a normal component of the Earth’s natural variability. Climate change occurs over a wide range of time and space scales. A plethora of evidence exists that indicates the climate of the Earth has changed over time. Humans are radically altering the concentrations of greenhouse gases in the atmosphere which is likely causing a new type of climate change

3
Our changing climate: Key Questions Climate modelers have predicted the Earth’s surface will warm because of manmade greenhouse gas (GHG) emissions So how much of the warming is manmade? How serious are the problems this is creating? What, if anything, can and should we do?

4
Climate Change: Changing Earth’s Energy Balance Changing the –Incoming solar energy –Outgoing energy (IR emitted to space) –Internal transport of energy within the Earth;s atmosphere and oceans will cause a shift in climate
 –Internal transport of energy within the Earth;s atmosphere and oceans will cause a shift in climate")
5
Global Energy Balance Ahrens, Fig. 2.14 IR Out In a stable climate, Solar Energy IN = IR Energy OUT Solar in

6
Global Energy Imbalance Ahrens, Fig. 2.14 Atmosphere IR Out is reduced Increasing GHG concentrations decrease the IR Energy out So Energy IN > Energy OUT and the Earth warms Solar in

7
Change in IR Emission to Space Notice that because of the greenhouse gases in Earth’s atmosphere, 91% (=64/70) of the IR emitted to space comes from the atmosphere and only 9% (=6/70) comes from Earth’s surface When additional GHG’s are added to the atmosphere, the altitude of IR emission to space rises and less IR from the surface makes it to space Since air temperature in the troposphere decreases with altitude, the temperature of the emission to space decreases Therefore Earth’s energy emission to space decreases because the IR energy flux emitted by an object decreases with decreasing temperature Therefore total Energy flux IN > Energy flux OUT Earth warms until Energy flux IN = Energy flux OUT
 of the IR emitted to space comes from the atmosphere and only 9% (=6/70) comes from Earth’s surface When additional GHG’s are added to the atmosphere, the altitude of IR emission to space rises and less IR from the surface makes it to space Since air temperature in the troposphere decreases with altitude, the temperature of the emission to space decreases Therefore Earth’s energy emission to space decreases because the IR energy flux emitted by an object decreases with decreasing temperature Therefore total Energy flux IN > Energy flux OUT Earth warms until Energy flux IN = Energy flux OUT")
8
Change in IR Emission to Space BEFORE GHG increase: IN=OUTAFTER GHG increase NH SH Ahrens, Fig. 2.21 Altitude Temperature 1. Altitude of IR emission to space rises Altitude of IR emission to space Temperature of IR emission to space 2. Temperature of IR emission to space decreases 3. IR emission to space decreases because of colder emission temperature IR emission to space

9
Change in IR Emission to Space ( cont’d) AFTER GHG increase IN>OUTEventual solution IN=OUT SH Ahrens, Fig. 2.21 Temperature 4. Atmosphere warms until… 5. Temperature of IR emission to space increases to original temperature 6. IR emission to space increases until it matches the original IR emission before GHG increases SH Ahrens, Fig. 2.21 Temperature 1. Altitude of IR emission to space rises 2. Temperature of IR emission to space decreases 3. IR emission to space decreases because of colder emission temperature

10
Change: Atmo IR Emission to Surface BEFORE GHG increase: AFTER GHG increase Energy DOWN=UP at surface more IR emission into surface NH SH Ahrens, Fig. 2.21 Altitude Temperature 1. Altitude of IR emission to surface decreases Altitude of IR emission to surface Temperature of IR emission to space 2. Temperature of IR emission to surface increases 3. Atmo IR emission to surface increases because of warmer emission temperature Atmospheric IR emission to surface

11
Out-of-Equilibrium Issues Land temperature increases faster than Ocean temperature Atmospheric lifetime of CO 2 is ~50 years System response is NOT instantaneous System takes a while to heat up in response to increase in CO 2 Initial temperature increase is smaller than final

12
Anthropogenic Climate Change The data indicate that global-mean land and sea-surface temperatures have warmed about ~0.6 o C during the last 35 years. Is this the early stages of a man-made global warming? Two main anthropogenic forcing mechanisms: Greenhouse gas concentrations => rising. Aerosol concentrations => also increasing. We will focus attention on CO 2 increases.

13
Greenhouse Gas Concentrations The two dominant greenhouse gases are H 2 O and CO 2. There are several other GHGs with smaller concentrations: O 3, CH 4, N 2 O H 2 O vapor is categorized separately because it is controlled indirectly by evaporation and condensation and changes in response to other changes in climate (temperature, circulation)
.")
14
Absorption 20% of incident Visible (0.4- 0.7 m) is absorbed O 2 an O 3 absorb UV (shorter than 0.3 m) Infrared (5-20 m) is selectively absorbed H 2 O & CO 2 are strong absorbers and emitters of IR Little absorption of IR around 10 m – atmospheric window Visible IR Ahrens, Fig. 2.9

15
Global Warming Potential (GWP) Different gases has different warming potentials which are defined relative to the warming effect of CO 2 Ahrens, Fig 2.10 GasGWP Carbon dioxide (CO2) 1 Methane (CH4) 21 Nitrous oxide (N2O) 310 Hydrofluorocarbons 560-12,100 Perfluorocarbons 6,000-9,200 Sulfur hexafluoride 23,900
 Different gases has different warming potentials which are defined relative to the warming effect of CO 2 Ahrens, Fig 2.10 GasGWP Carbon dioxide (CO2) 1 Methane (CH4) 21 Nitrous oxide (N2O) 310 Hydrofluorocarbons ,100 Perfluorocarbons 6,000-9,200 Sulfur hexafluoride 23,900")
16
CO 2 makes the biggest contribution to the climate forcing

17
Ice Core from Vostok, Antarctica During last ice age (>18,000 years ago) Temps 6 o C colder CO 2 levels 30% lower CH 4 levels 50% lower H 2 O levels were lower than current interglacial. 135,000 years ago it was a bit warmer than today 50% increase in CO2 was associated with 6-8 o C increase in temperature 6-8 o C decrease in temperature produced incredibly different climate: Ice Age

18
Changing CO 2 concentrations CO 2 concentrations have varied naturally by ~30-50% over the past few hundred thousand years (ice ages) Fossil fuel burning since the industrial revolution has created a recent sharp increase in CO 2 concentrations CO 2 concentrations are now higher than at any time in past few hundred thousand years And concentrations are increasing faster with time Last 4 Ice Age cycles: 400,000 years See http://epa.gov/climatechange/science/recentac.html Man made You are here
 Fossil fuel burning since the industrial revolution has created a recent sharp increase in CO 2 concentrations CO 2 concentrations are now higher than at any time in past few hundred thousand years And concentrations are increasing faster with time Last 4 Ice Age cycles: 400,000 years See Man made You are here")
19
Changing CO 2 concentrations CO 2 concentrations measured very precisely since 1958 Over past 45 years they’ve increased by ~21% Presently increasing at 0.6%/yr See http://www.cmdl.noaa.gov/ccgg/trends/co2_data_mlo.php http://www.cmdl.noaa.gov/ccgg/trends/co2_data_mlo.php You are here

20
US (5% of world population) now causes 24% of total pollution. See http://en.wikipedia.org/wiki/List_of_countries_by_carbon_dioxide_emissionshttp://en.wikipedia.org/wiki/List_of_countries_by_carbon_dioxide_emissions

21
Currently, 7 gigatons per year of CO2 are injected into the air by burning fossil fuels (80%) and forests (20%). Half accumulates in atmosphere, where it resides for 50+ years. If the burning fossil fuels and forests totally ceased, it would still take 50 years for CO 2 levels to return to 50% above pre- industrial levels.

22
Missing Carbon Sink CO 2 is accumulating in the atmosphere more slowly than expected (believe it or not) Based on our understanding of CO 2 emissions and ocean and atmosphere uptake, there is a missing sink/uptake of about 25% NASA OCO mission
 Based on our understanding of CO 2 emissions and ocean and atmosphere uptake, there is a missing sink/uptake of about 25% NASA OCO mission")
23
Natural Variations in Climate

24
Milankovitch Theory of Ice Ages Attempts to explain ice ages by variations in orbital parameters Three cycles: Eccentricity (100,000 yrs) Tilt (41,000 yrs) Precession (23,000 yrs) Changes the latitudinal and seasonal distributions of solar radiation.
 Tilt (41,000 yrs) Precession (23,000 yrs) Changes the latitudinal and seasonal distributions of solar radiation.")
25
Milankovitch Theory of Ice Ages Most recent Ice Ages have occurred for past 2 million years Ice Ages occur when there is less radiation in summer to melt snow. Partially agrees with observations, but many questions unanswered. What caused the onset of the first Ice Age?

26
Milankovitch Theory Change in daily solar radiation at top of atmosphere at June solstice Changes as large as ~15% occur

27
Global Temperatures and CO 2 There is a very strong relationship between CO 2 levels and past global temperatures. CO 2 levels are now higher than during any period of the past 450,000 years. Will global temperatures responding accordingly?

28
Long-Term Climate Change 250 million years ago, the world’s landmasses were joined together and formed a super continent termed Pangea. As today’s continents drifted apart, they moved into different latitude bands. This altered prevailing winds and ocean currents. NA E-A Af SA India NA India Af SA E-A Ant Aus Ant Aus 180 M BPToday Ahrens, Fig 13.6

29
Long-Term Climate Change Circumpolar ocean current formed around Antarctica 40- 55 MY ago once Antarctica and Australia separated. This prevented warm air from warmer latitudes to penetrate into Antarctica. Absence of warm air accelerated growth of the Antarctic ice sheet. http://www.ace.mmu.ac.uk/eae/Climate_Change/Older/Continental_Drift.html

30
Long-Term Climate Change Circumpolar seaway leads to large latitudinal temperature gradient. Circum-equatorial seaway leads to small latitudinal temperature gradient http://www.ace.mmu.ac.uk/eae/Climate_Change/Older/Continental_Drift.html

31
Climate System Feedbacks

32
CO 2 and the Greenhouse Effect If the atmosphere were dry, we could predict with high confidence that a doubling of CO2 (likely before 2100) would increase the global mean surface temperature by ~2C. The presence of oceans, ice, water vapor and clouds complicates the analysis significantly. Ahrens, Fig 2.10

33
Complexity of Climate System The climate system involves numerous, interrelated components.

34
Closer Look at Climate System

35
Climate Feedback Mechanisms

36
Climate System Feedbacks Feedbacks are what makes the climate problem so difficult Positive: Increase the impact of the original change Negative: Reduce the impact of the original change EXAMPLE: Ice albedo (Positive Feedback): –Temperatures increase because of increased CO 2 1.Ice melts 2.Reduces Earth’s reflectivity (albedo) 3.Earth absorbs more sunlight 4.Earth warms 5.More ice melts….
: –Temperatures increase because of increased CO 2 1.Ice melts 2.Reduces Earth’s reflectivity (albedo) 3.Earth absorbs more sunlight 4.Earth warms 5.More ice melts….")
37
Positive and Negative Feedbacks Assume that the Earth is warming. - Warming leads to more evaporation from oceans, which increases water vapor in atmosphere. -More water vapor increases absorption of IR, which strengthens the greenhouse effect. -This raises temperatures further, which leads to more evaporation, more water vapor, warming… “Runaway Greenhouse Effect” Positive Feedback Mechanism NET EFFECT: Water vapor feedback increases the warming of the Earth, roughly doubling the effect of CO 2 increase alone

38
Water Vapor Feedback Feedback generally thought to be POSITIVE: It increases the impact of the original change Feedback summary: –Air temperatures increase because of CO 2 increase –Saturation vapor pressure of air increases –Increases evaporative fluxes from the surface –Increases amount of water vapor in the air –Water vapor is a greenhouse gas so increasing water vapor reduces IR to space and increases IR flux into surface NET EFFECT: Water vapor feedback increases the warming of the Earth, roughly doubling the effect of CO 2 increase alone

39
Positive and Negative Feedbacks Again assume that the Earth is warming. - Suppose as the atmosphere warms and moistens, more low clouds form. - More low clouds reflect more solar radiation, which decreases solar heating at the surface. - This slows the warming, which would counteract a runaway greenhouse effect on Earth. Negative Feedback Mechanism

40
Cloud Feedback Clouds affect both solar & IR radiation –Clouds increase solar reflection (albedo) cooling the Earth –Clouds absorb and emit IR radiation like a GHG Currently their net effect is to cool the Earth –Solar effect > IR effect Not clear what they will do in the future –If the amount of low clouds increases, the albedo effect wins and they cool the Earth (Negative feedback) –If the amount of high clouds increases, the IR effect wins and the Earth warms (Positive feedback) There are other subtler cloud feedbacks as well involving aerosols in particular
 cooling the Earth –Clouds absorb and emit IR radiation like a GHG Currently their net effect is to cool the Earth –Solar effect > IR effect Not clear what they will do in the future –If the amount of low clouds increases, the albedo effect wins and they cool the Earth (Negative feedback) –If the amount of high clouds increases, the IR effect wins and the Earth warms (Positive feedback) There are other subtler cloud feedbacks as well involving aerosols in particular")
41
Positive and Negative Feedbacks Atmosphere has a numerous checks and balances that counteract climate changes. All feedback mechanisms operate simultaneously. All feedback mechanisms work in both directions. The dominant effect is difficult to predict. Cause and effect is very difficult to prove at the “beyond a shadow of a doubt” level.

42
Climate Model Predictions

43
Projections of Global Warming Atmosphere and coupled Atmo-Ocean models are run for hundreds of years to simulate future climates They assume continued increases in the levels of greenhouse gasses in the atmosphere. The models have sophisticated physics… But they have coarse spatial grid separations! Atmosphere: 250 km horizontal, 30 levels vertical Ocean: 125-250 km horizontal, 200-400 m vertical

44
How Well Do Models Capture Current Observed Climate? Performance Varies by Weather Element In general… Excellent for Surface Temperature Skillful for Sea-Level Pressure (SFC Winds) Marginal Skill for Precipitation Fig. 8.4 IPCC Report
 Marginal Skill for Precipitation Fig. 8.4 IPCC Report.")
45
Global Temperature Outlook Assume CO2 levels rise at rate of 1% per year until 2070. Good agreement for past climate and CO2 levels leads to high confidence. Rather close agreement among models. Consensus of several model runs indicates an average warming of 2 o C Fig. 9.3 IPCC Report

46
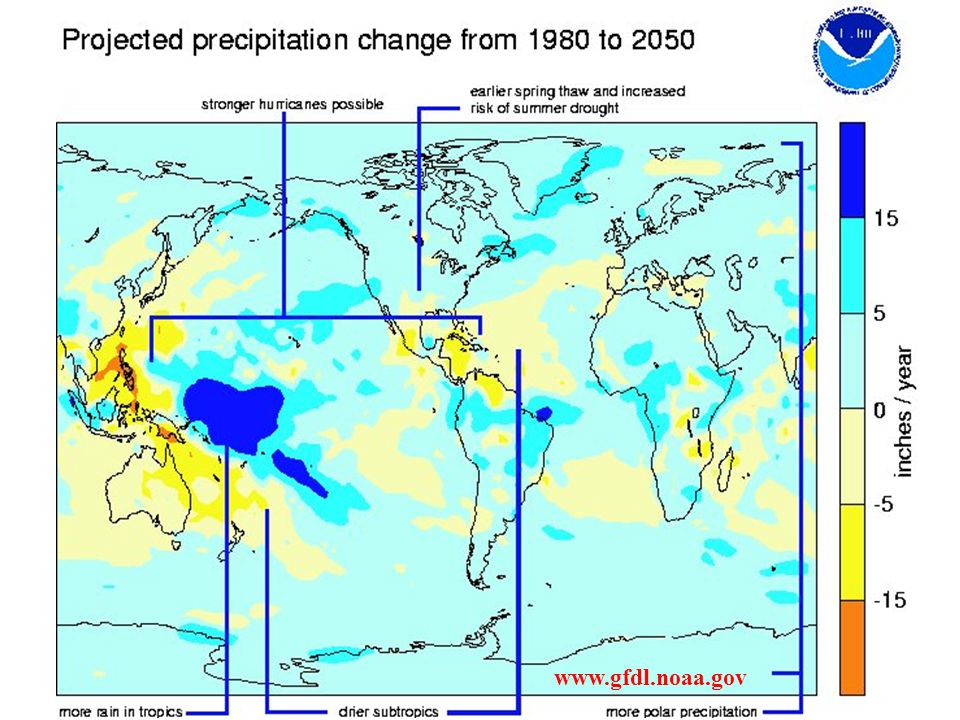
Global Precipitation Outlook Fig. 9.3 IPCC Report Marginal performance for past climate and CO2 levels means low confidence in outlook. Large differences exist among models. Consensus of several model runs indicates an average increase of 2% in global precipitation

47
Regional Consistency: Warming Fig. 10.1.1 IPCC Report A + or - symbol denotes 7 out of 9 models agree. A2: no sulphate aerosols; B2: has sulphate aerosols

48
Regional Consistency: Rainfall Fig. 10.1.2 IPCC Report A + or - symbol denotes 7 out of 9 models agree. A2: no sulphate aerosols; B2: has sulphate aerosols

49
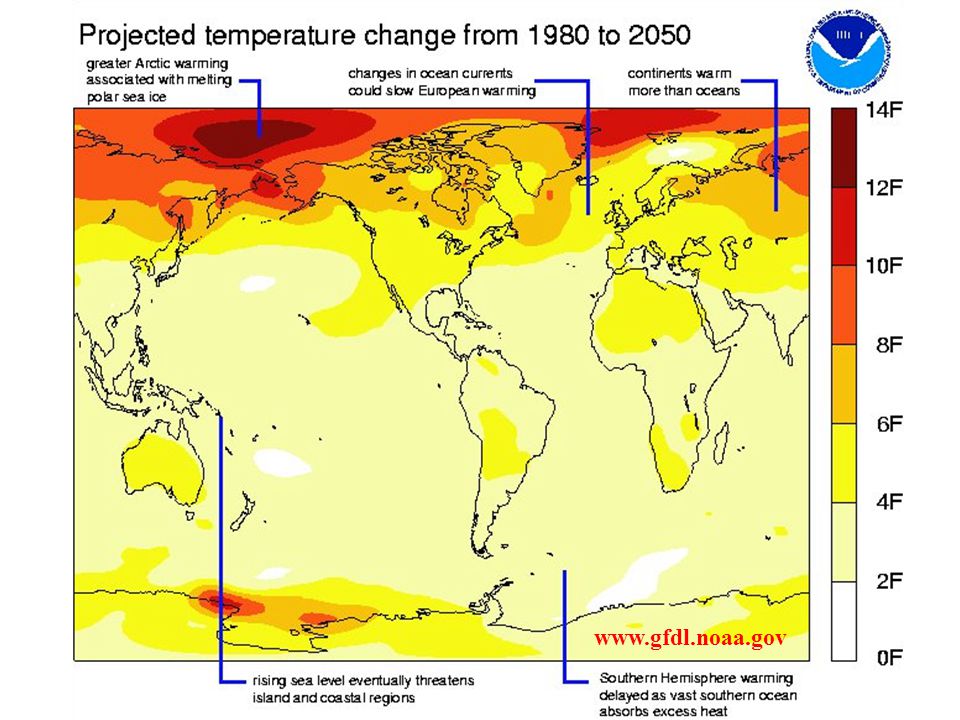
2x CO 2 Model Runs Details differ; but many areas of general agreement Warming over the entire globe Warming is larger (~10 o C) near poles, especially Arctic Melting of Greenland ice, rise in mean sea level
 near poles, especially Arctic Melting of Greenland ice, rise in mean sea level")
50
2x CO 2 Model Runs Less agreement for rain than for temperature More overall rain, but some regions are drier A consistent signal: Wetter high latitudes, suggesting a poleward shift in the primary agriculture zones

51
GDFL Model Lets look at some details from a 500-year simulation by a specific climate model. Examine Two Scenarios: 1% CO2 increase per year for 70 years 2X Total Increase in CO2 1% CO2 increase per year for 140 years 4X Total Increase in CO2

52
Good agreement for CO 2 levels of the past 150 yrs www.gfdl.noaa.gov Mandatory before use as global warming model

53
Average Global Surface Temperatures… Warm 2 o C for 2X CO2 Warm 4 o C for 4X CO2 Sea Level Rises… Equilibrium Not Reached until after 500 years North Atlantic Ocean… Circulation Weakens CO 2 Increases 1% per Year www.gfdl.noaa.gov

54
CO 2 Increases 1% per Year Surface Temperatures for GFDL Model 2X CO2 Temperature Animation Remote 2X CO2 Temperature Animation Local Disk BIG File (8.2 MB)!!!
!!!")
55
Climate response is out of equilibrium for a while Continental temperatures rise faster than ocean temperatures –Water has much larger heat capacity than land –Evaporation cools the ocean surface Ocean temperatures take long time to reach a new equilibrium 1.Warming we have seen thus far is NOT the total warming even if GHG concentrations stop increasing Water saturation vapor pressure over land increases faster than that over the oceans Most of the atmospheric water vapor ultimately comes from the ocean Therefore expect the relative humidity over land to decrease in general, at least until ocean temperatures catch up with the land temperatures. 2. Continental interiors will get drier in general

56
www.gfdl.noaa.gov
58
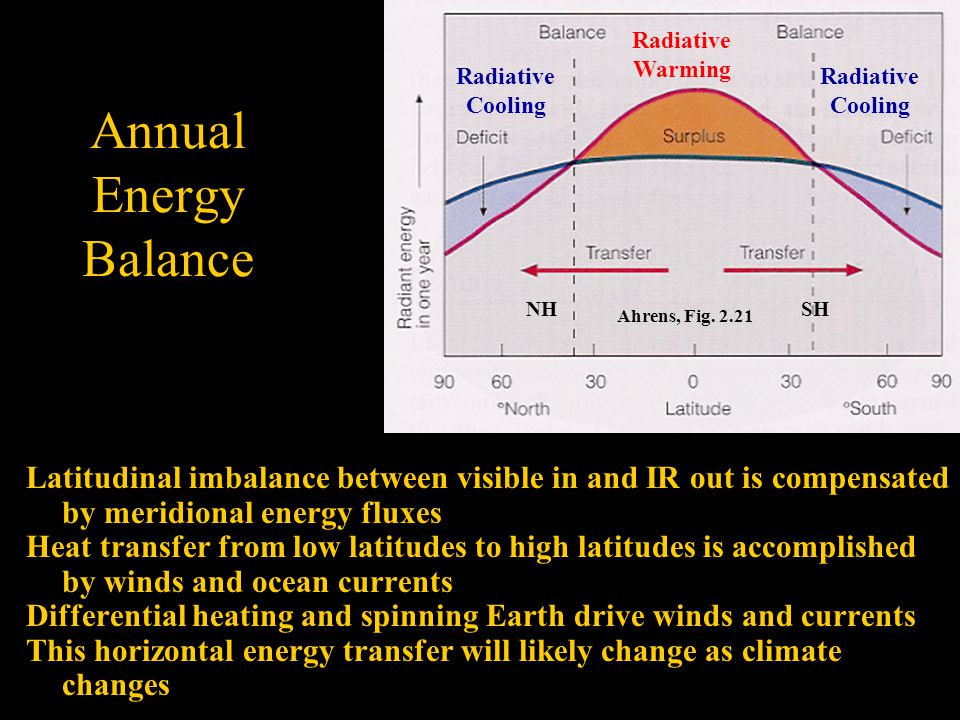
Annual Energy Balance Latitudinal imbalance between visible in and IR out is compensated by meridional energy fluxes Heat transfer from low latitudes to high latitudes is accomplished by winds and ocean currents Differential heating and spinning Earth drive winds and currents This horizontal energy transfer will likely change as climate changes NHSH Radiative Warming Radiative Cooling Ahrens, Fig. 2.21
59
Mid-Latitude Cyclones mP cP mT Ahrens, Meteorology Today, 5th Ed. Winter storms move tropical air poleward and polar air toward the tropics. Net result is to transport energy poleward

60
Ocean Currents of World Ahrens Fig. 7.24

61
www.gfdl.noaa.gov 4X CO2 Sea Ice Animation 4X CO2 Sea Ice Local Link

62
July Temperature over Southeastern U.S. Warms 5-9 o C July Heat Index over Southeastern U.S. Rises 7-14 o C due to increase H 2 O vapor Consistent Signal Warmer Southern U.S. CO 2 Increases 1% per Year www.gfdl.noaa.gov

63
Soil Moisture Much Drier over U.S. 60% Soil Moisture Decrease Higher Evapo-Transpiration Altered Balance between Evaporation-Precipitation Agricultural Implications How do we hydrate and feed ourselves? CO 2 Increases 1% per Year www.gfdl.noaa.gov

64
Arctic Warms the Most Consistent Model Signal www.gfdl.noaa.gov

65
Increasing CO 2 concentrations How high will they go? How warm will it get??? If CO 2 concentrations stay within factor of 2 of pre-industrial, then warming of 3+1 o C is expected If concentrations go still higher => larger uncertainty because the climate is moving into unprecedented territory Last 4 Ice Age cycles: 400,000 years Man made You are here Ice age CO 2 range You are going to be somewhere in here See http://epa.gov/climatechange/science/futureac.html

Similar presentations


>")


 1. Enhanced Greenhouse Effect 2. CO 2 sensitivity 3. Projected CO 2 emissions 4. Projected CO 2 atmosphere concentrations 5. What.>")


. Px272 Lect 3: Forcing and feedback Balance of solar incoming, and earth emitted outgoing radiation Increments.>")
>")


