Download presentation
Presentation is loading. Please wait.

1
MERCURY CONTAMINATION IN S-NEW ENGLAND AND LONG ISLAND SOUND, USA
JOHAN C. VAREKAMP EARTH & ENVIRONMENTAL SCIENCES WESLEYAN UNIVERSITY MIDDLETOWN CT USA

2
Mercury droplets on cinnabar (HgS)
")
3
MERCURY AND HUMAN HEALTH
Mercury has no known biological function and binds tightly to sulfhydryl groups, inhibiting molecular functions -SH reduces membrane permeability reacts with and disrupts phosphate bonds in ATP/ADP replaces cations in important molecules

4
ENVIRONMENTAL CONCERN HUMAN HEALTH CONCERN: HG IS A NEUROTOXIN

5
Victim of the “Minamata Bay” (Japan) tragedy,
the first documented disaster of Hg pollution (1954)
")
6
Eating fish or shellfish Breathing vapors (home, work)
Exposure to mercury? Eating fish or shellfish Breathing vapors (home, work) Dental work and medical treatments Religious rituals that include Hg inhalation (Santaria in Haiti) Eating fish or shellfish contaminated with methylmercury. Breathing vapors in air from spills, incinerators, and industries that burn mercury-containing fuels. Release of mercury from dental work and medical treatments. Breathing contaminated workplace air or skin contact during use in the workplace (dental, health services, chemical, and other industries that use mercury). Practicing rituals that include mercury.
 Dental work and medical treatments. Religious rituals that include Hg inhalation (Santaria in Haiti) Eating fish or shellfish contaminated with methylmercury. Breathing vapors in air from spills, incinerators, and industries that burn mercury-containing fuels. Release of mercury from dental work and medical treatments. Breathing contaminated workplace air or skin contact during use in the workplace (dental, health services, chemical, and other industries that use mercury). Practicing rituals that include mercury.")
7
Fish Consumption Primary form of human exposure to methylmercury is through fish consumption. Population at greatest risk: small children and pregnant women that consume fish EPA - RfD is 0.1 ug MeHg/day Maximum Hg-in-hair level is 1 ppm Hg

9
Wesleyan University study: 35%> EPA limit
(nationwide random sample shows 20% above EPA limit)
")
11
Delivery pathways of Hg to the coastal environment
Atmospheric deposition in the watersheds and fluvial transport to the coast Point source contamination on land with fluvial transport to the coast Direct discharge through outfall pipes of waste water treatment plants Dredge and sludge dumping

13
Some important forms of Mercury in the environment:
CH3-Hg organic, charged, lipophilic Hg2+ oxidized Hg0 reduced, elemental,volatile CH3-Hg-CH3 organic, volatile, lipophilic

14
aerobic anaerobic Hg0 CH3-Hg+ Hg2+ (CH3)2-Hg volatilization
bioaccumulation reduction CH3-Hg+ Hg2+ demethylation (CH3)2-Hg Diagram is from Mark Coyne, Soil Microbiology text methylation (Sulfate reducing bacteria) anaerobic
2-Hg. Diagram is from Mark Coyne, Soil Microbiology text. methylation. (Sulfate reducing bacteria) anaerobic.")
15
Hg Transport Dissolved metals (e.g., in complexes with dissolved organic matter) Attached to fine particles: Inorganic Organic

16
Repositories of metals
Coastal subtidal sediments (delivery mainly by particulate deposition) Coastal salt marshes and estuarine marshes (delivery mainly by particulate deposition and to some degree through in situ atmospheric deposition)
 Coastal salt marshes and estuarine marshes (delivery mainly by particulate deposition and to some degree through in situ atmospheric deposition)")
17
Sediment Cores Chemical mobility in the sediment column
Environmental archives that contain contamination records of metals Record can be blurred by Chemical mobility in the sediment column Discontinuous sediment deposition (flood deposits) Bioturbation
 Bioturbation.")
21
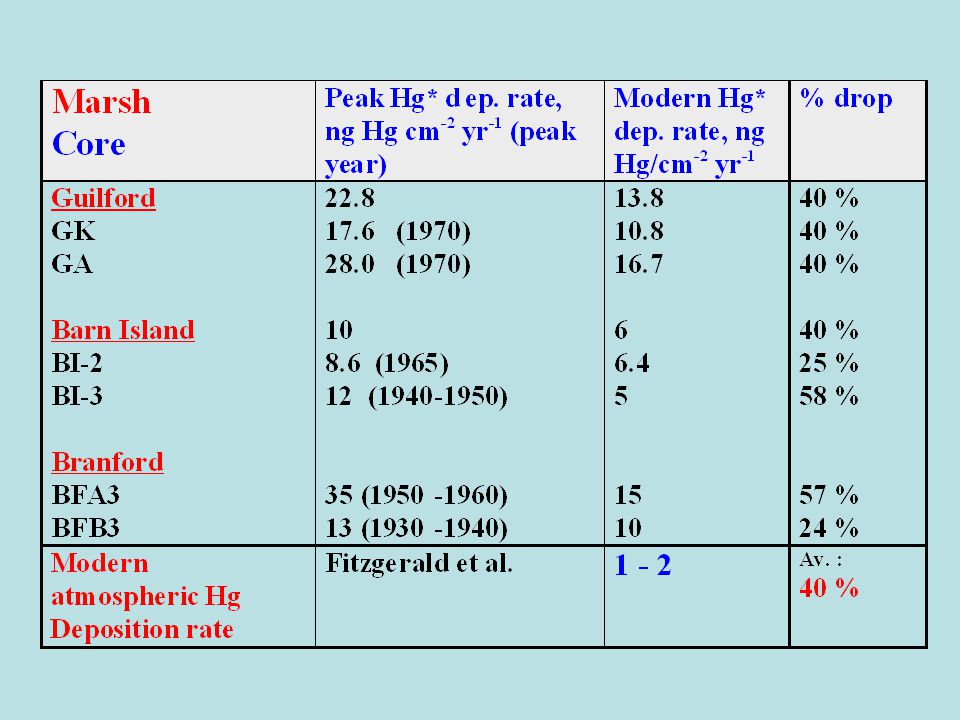
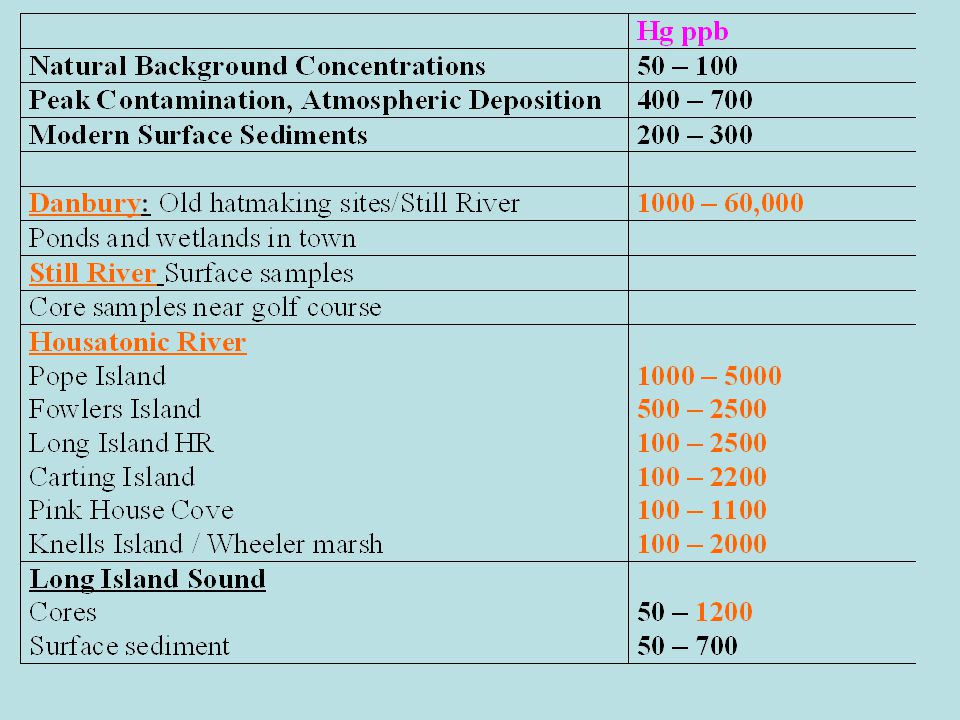
Mercury Levels Normal modern soil background levels for mercury in the northeast USA are around 200 to 300 parts per billion Mostly due to atmospheric deposition Sediment samples with higher Hg suggest point sources of Hg in watershed Hg inventories: total amount of Hg deposited on 1 cm2 over the full pollution period

22
GRAIN SIZE EFFECT ON HG INVENTORIES

23
SR FI PI DB

24
Mercury profile core Chapman Pond, CT River, CT

25
Mercury profile from core BFB3A,
Farm River marsh, Branford, CT

31
THE STILL RIVER, WESTERN CONNECTICUT

34
~1955

35
Fowler Island core, Housatonic River

36
Pope Island core, Housatonic River

38
Floods of 1955 Wooster Square, Danbury

39
The floods of 1955 in Waterbury, CT after two
hurricanes hit in a few weeks time

40
Norwalk River Core 1955 1900 1820

41
Housatonic River, Still River, Norwalk River: strong evidence for Hg from hat-making sources Source signals modified by floods The return of the mad hatter

42
Lee Hat Factory Mallory Hat Factory
Photos of Mallory Hat Factory and Lee Hat Factory

43
EVERYONE wore hats. Men, women,

45
The Carroting Solution
…had nothing to do with vegetables. This bright yellow-orange solution of mercury and nitric acid was used to treat animal fur from pelts. It made the fur fibers mat into felt more easily.

46
Men working in Mallory’s carroting room

47
Benedict’s factory initially produced 3 hats per day

48
Background Hg contamination in
central and eastern Connecticut, much higher levels of Hg contamination in western Connecticut (Still River and Housatonic River wetlands) How about sediments from Long Island Sound?
 How about sediments from. Long Island Sound")
49
R/V UCONN

50
Sampling mud

51
HG IN LIS SEDIMENT: GREATEST ENRICHMENTS
ON THE WEST SIDE NEAR NEW YORK

54
1975 1820 Core near Execution Rock near NYC peak is Hg-rich debris of unknown origin

55
Core in the delta of the Housatonic River
1955 1900 1820 Core in the delta of the Housatonic River

58
First estimate of Hg sources for LIS
~30-35 % from Waste Water Treatment Plants ~20-25% from Housatonic River/Danbury (WLIS) Rest from Connecticut River
 Rest from Connecticut River.")
61
How do we get rid of the Hg??
We have documented extensive Hg contamination in soils and sediments from a known point source: hat-making! How do we get rid of the Hg??

62
Phytoremediation REMOVAL OF POLLUTANTS THROUGH PLANT UPTAKE:
STORAGE IN PLANT FOLLOWED BY PLANT REMOVAL OR FOR HG UPTAKE IN PLANT, REDUCTION TO Hgo AND THEN EMISSION OF VAPOR FROM LEAVES

63
Growth Experiment Brassica rapa P. (Mustard Spinach)
")
64
1. Good correlation between Hg in leaves and Hg in spiked soils 2
1. Good correlation between Hg in leaves and Hg in spiked soils 2. No correlation between Hg leaves and Hg from ‘field contaminated soils’ 3. Decrease in Hg in leaves over time

65
Hg in Maple Trees Soils with 0
Hg in Maple Trees Soils with ppm Hg Hg in leaves increased over time Positive correlation Hg(leaves) with Hg(soil)
 with Hg(soil)")
66
Mean Hg loss from soils Hg in ‘normal leaves’ minus Hg in ‘MER A leaves’ About 300 microgram Hg / m2 per growing season Ten cm thick soil with 50 ppm Hg-about yrs to clean up

70
PLANT EXPERIMENTS HG UPTAKE DEPEND ON PLANT SPECIES AND HG SPECIATION IN SOIL HG IN LEAVES FROM MAPLE TREES INCREASES WITH TIME AND REFLECTS SOIL HG PHYTOREMEDIATION WORKS IN PRINCIPLE (MER A PLANTS DO NOT RETAIN MUCH HG IN LEAVES) BUT MAGNITUDE IS SMALL ROLE OF PLANTS IN SOIL HG EMISSION IS NOT YET CLEAR
 BUT MAGNITUDE IS SMALL. ROLE OF PLANTS IN SOIL HG EMISSION IS NOT YET CLEAR.")
71
Thanks to CT Sea Grant College Program,
CTDEP, USGS and the Mellon Foundation for funding. Much of the field and analytical work was done by Wesleyan University students Beth Goldoff, Kate Lauriat, Bart Kreulen, Billo Jallow and Patrick Welsh. THANKS TO YOU FOR LISTENING

Similar presentations


 Hg is a silvery, liquid metal at room temperature heavy metals. Like water, Hg can evaporate and become.>")
 Cinnabar.>")


