Download presentation
Presentation is loading. Please wait.

1
Multi-Tasking Models and Algorithms
Task-Channel (Computational) Model & Asynchronous Communication (Part II)
 Model. & Asynchronous Communication. (Part II)")
2
Outline for Multi-Tasking Models
Note: Items in black are in this slide set (Part II). Preliminaries Common Decomposition Methods Characteristics of Tasks and Interactions Mapping Techniques for Load Balancing Some Parallel Algorithm Models The Data-Parallel Model The Task Graph Model The Work Pool Model The Master-Slave Model The Pipeline or Producer-Consumer Model Hybrid Models
. Preliminaries. Common Decomposition Methods. Characteristics of Tasks and Interactions. Mapping Techniques for Load Balancing. Some Parallel Algorithm Models. The Data-Parallel Model. The Task Graph Model. The Work Pool Model. The Master-Slave Model. The Pipeline or Producer-Consumer Model. Hybrid Models.")
3
Outline (cont.) Algorithm examples for most of preceding algorithm models. This part currently missing & need to add next time. Some could be added as examples under Task/Channel model Task-Channel (Computational) Model Asynchronous Communication and Performance Evaluation Modeling Asynchronous Communicaiton Performance Metrics and Asynchronous Communications The Isoefficiency Metric & Scalability Future revision plans for preceding material. BSP (Computational) Model Slides posted separately on course website
 Model. Asynchronous Communication and Performance Evaluation. Modeling Asynchronous Communicaiton. Performance Metrics and Asynchronous Communications. The Isoefficiency Metric & Scalability. Future revision plans for preceding material. BSP (Computational) Model. Slides posted separately on course website.")
4
References Michael Quinn, Parallel Programming in C with MPI and OpenMP, McGraw Hill, 2004. Particularly, Chapters 3 and 7 plus algorithm examples. Textbook slides for this book Ananth Grama, Anshul Gupta, George Karypis, and Vipin Kumar, Introduction to Parallel Computing, 2nd Edition, Addison Wesley, 2003. Particularly, Chapter 3 (available online) Also, Section 2.5 (Asynchronous Communications) Textbook Authors’ slides Barry Wilkinson and Michael Allen, “Parallel Programming: Techniques and Applications Using Networked Workstations and Parallel Computers ”, Second Edition, Prentice Hall, 2005. Ian Foster, Designing and Building Parallel Programs: Concepts and Tools for Parallel Software Engineering, Addison Wesley, 1995, Online at
 Also, Section 2.5 (Asynchronous Communications) Textbook Authors’ slides. Barry Wilkinson and Michael Allen, Parallel Programming: Techniques and Applications. Using Networked Workstations and Parallel Computers , Second Edition, Prentice Hall, Ian Foster, Designing and Building Parallel Programs: Concepts and Tools for Parallel Software Engineering, Addison Wesley, 1995, Online at.")
5
Primary References for Part II
Michael Quinn, Parallel Programming in C with MPI and OpenMP, McGraw Hill, 2004. Also slides by author for this textbook. Ian Foster, Designing and Building Parallel Programs: Concepts and Tools for Parallel Software Engineering, Addison Wesley, 1995, Online at Ananth Grama, Anshul Gupta, George Karypis, and Vipin Kumar, Introduction to Parallel Computing, 2nd Edition, Addison Wesley, 2003. Also, slides created by authors of this textbook

6
Change in Chapter Title
This chapter consists of three sets of slides. This chapter was formerly called Strictly Asynchronous Models The name has now been changed to Multi-Tasking Models However, the old name still occurs regularly in the internal slides.

7
Multi-Tasking Models and Algorithms
The Task/Channel Model

8
Outline: Task/Channel Model
Task/channel model of Ian Foster Used by both Foster and Quinn in their textbooks Is a model for a general style of computation; i.e., a computational model, not an algorithm model Algorithm design methodology Recommended algorithmic choice tree for problems Case studies Boundary value problem Finding the maximum

9
Relationship of Task/Channel Model to Algorithm Models
In designing algorithms for problems, the Task Graph algorithm model discussed in textbook by Grama, et. al. uses both the task dependency graph where dependencies usually result from communications between two tasks. the task interaction graph also captures interactions between tasks such as data sharing. The Task Graph Algorithm model provides guidelines for creating one type of algorithm It does not attempt to model computational or communication costs.

10
Relationship of Task/Channel Model to Algorithm Models (cont.)
The Task/Channel model is a computational model, in that it attempts to capture a style of computation that can be used by certain types of parallel computers. It also uses the task dependency graph Also, it provides methods for analyzing computation time and communication time. Use of Task/Channel model results in more than one algorithmic style being used to solve problems. e.g., task graph algorithms, data-parallel algorithms, master-slave algorithms, etc.

11
The Task/Channel Model (Ref: Chapter 3 in Quinn)
This model is intended for MIMDs (i.e., multiprocessors and multicomputers) and not for SIMDs. Parallel computation = set of tasks A task consists of a Program Local memory Collection of I/O ports Tasks interact by sending messages through channels A task can send local data values to other tasks via output ports A task can receive data values from other tasks via input ports. The local memory contains the program’s instructions and its private data
 and not for SIMDs. Parallel computation = set of tasks. A task consists of a. Program. Local memory. Collection of I/O ports. Tasks interact by sending messages through channels. A task can send local data values to other tasks via output ports. A task can receive data values from other tasks via input ports. The local memory contains the program’s instructions and its private data.")
12
Task/Channel Model A channel is a message queue that connects one task’s output port with another task’s input port. Data values appear in input port in the same order in which they are placed in the channel’s output queue. A task is blocked if a task tries to receive a value at an input port and the value isn’t available. The blocked task must wait until the value is received. A process sending a message is never blocked even if previous messages it has sent on the channel have not been received yet. Thus, receiving is a synchronous operation and sending is an asynchronous operation.

13
Task/Channel Model Local accesses of private data are assumed to be easily distinguished from nonlocal data access done over channels. Thus, we should think of local accesses as being faster than nonlocal accesses. In this model: The execution time of a parallel algorithm is the period of time a task is active. The starting time of a parallel algorithm is when all tasks simultaneously begin executing. The finishing time of a parallel algorithm is when the last task has stopped executing.

14
Task/Channel Model Task Channel
A parallel computation can be viewed as a directed graph.

15
Foster’s Design Methodology
Ian Foster has proposed a 4-step process for designing parallel algorithms for machines that fit the task/channel model. Foster’s online textbook is a useful resource here It encourages the development of scalable algorithms by delaying machine-dependent considerations until the later steps. The 4 design steps are called: Partitioning Communication Agglomeration Mapping

16
Foster’s Methodology

17
Partitioning Partitioning: Dividing the computation and data into pieces Domain decomposition – one approach Divide data into pieces Determine how to associate computations with the data Focus on the largest and most frequently accessed data structure Functional decomposition – another approach Divide computation into pieces Determine how to associate data with the computations This often yields tasks that can be pipelined.

18
Example Domain Decompositions
Think of the primitive tasks as processors. In 1st, each 2D slice is mapped onto one processor of a system using 3 processors. In second, a 1D slice is mapped onto a processor. In last, an element is mapped onto a processor The last leaves more primitive tasks and is usually preferred.

19
Example Functional Decomposition

20
Partitioning Checklist for Evaluating the Quality of a Partition
At least 10x more primitive tasks than processors in target computer Minimize redundant computations and redundant data storage Primitive tasks are roughly the same size Number of tasks an increasing function of problem size Remember – we are talking about MIMDs here which typically have a lot less processors than SIMDs.

21
Foster’s Methodology

22
Communication Determine values passed among tasks
There are two kinds of communication: Local communication A task needs values from a small number of other tasks Create channels illustrating data flow Global communication A significant number of tasks contribute data to perform a computation Don’t create channels for them early in design

23
Communication (cont.) Communications is part of the parallel computation overhead since it is something sequential algorithms do not have do. Costs larger if some (MIMD) processors have to be synchronized. SIMD algorithms have much smaller communication overhead because Much of the SIMD data movement is between the control unit and the PEs especially true for associative Parallel data movement along the interconnection network involves lockstep (i.e. synchronously) moves.
 processors have to be synchronized. SIMD algorithms have much smaller communication overhead because. Much of the SIMD data movement is between the control unit and the PEs. especially true for associative. Parallel data movement along the interconnection network involves lockstep (i.e. synchronously) moves.")
24
Communication Checklist for Judging the Quality of Communications
Communication operations should be balanced among tasks Each task communicates with only a small group of neighbors Tasks can perform communications concurrently Task can perform computations concurrently

25
Foster’s Methodology

26
What We Have Hopefully at This Point – and What We Don’t Have
The first two steps look for parallelism in the problem. However, the design obtained at this point probably doesn’t map well onto a real machine. If the number of tasks greatly exceed the number of processors, the overhead will be strongly affected by how the tasks are assigned to the processors. Now we have to decide what type of computer we are targeting Is it a centralized multiprocessor or a multicomputer? What communication paths are supported How must we combine tasks in order to map them effectively onto processors?

27
Agglomeration Agglomeration: Grouping tasks into larger tasks Goals
Improve performance Maintain scalability of program Simplify programming – i.e. reduce software engineering costs. In MPI programming, a goal is to lower communication overhead. often to create one agglomerated task per processor By agglomerating primitive tasks that communicate with each other, communication is eliminated as the needed data is local to a processor.

28
Agglomeration Can Improve Performance
It can eliminate communication between primitive tasks agglomerated into consolidated task It can combine groups of sending and receiving tasks

29
Scalability We are manipulating a 3D matrix of size 8 x 128 x 256.
Our target machine is a centralized multiprocessor with 4 CPUs. Suppose we agglomerate the 2nd and 3rd dimensions. Can we run on our target machine? Yes- because we can have tasks which are each responsible for a 2 x 128 x 256 submatrix. Suppose we change to a target machine that is a centralized multiprocessor with 8 CPUs. Could our previous design basically work. Yes, because each task could handle a 1 x 128 x 256 matrix.

30
Scalability However, what if we go to more than 8 CPUs? Would our design change if we had agglomerated the 2nd and 3rd dimension for the 8 x 128 x 256 matrix? Yes. This says the decision to agglomerate the 2nd and 3rd dimension in the long run has the drawback that the code portability to more CPUs is impaired.

31
Agglomeration Checklist for Checking the Quality of the Agglomeration
Locality of parallel algorithm has increased Replicated computations take less time than communications they replace Data replication doesn’t affect scalability Agglomerated tasks have similar computational and communications costs Number of tasks increases with problem size Number of tasks suitable for likely target systems Tradeoff between agglomeration and code modifications costs is reasonable

32
Foster’s Methodology

33
Mapping Mapping: The process of assigning tasks to processors
Centralized multiprocessor: mapping done by operating system Distributed memory system: mapping done by user Conflicting goals of mapping Maximize processor utilization – i.e. the average percentage of time the system’s processors are actively executing tasks necessary for solving the problem. Minimize interprocessor communication

34
Mapping Example (a) is a task/channel graph showing the needed communications over channels. (b) shows a possible mapping of the tasks to 3 processors.
 shows a possible mapping of the tasks to 3 processors.")
35
Mapping Example If all tasks require the same amount of time and each CPU has the same capability, this mapping would mean the middle processor will take twice as long as the other two..

36
Optimal Mapping Optimality is with respect to processor utilization and interprocessor communication. Finding an optimal mapping is NP-hard. Must rely on heuristics applied either manually or by the operating system. It is the interaction of the processor utilization and communication that is important. For example, with p processors and n tasks, putting all tasks on 1 processor makes interprocessor communication zero, but utilization is 1/p.

37
A Mapping Decision Tree (Quinn, Pg 72)
Static number of tasks Structured communication Constant computation time per task Agglomerate tasks to minimize communications Create one task per processor Variable computation time per task Cyclically map tasks to processors Unstructured communication Use a static load balancing algorithm Dynamic number of tasks Frequent communication between tasks Use a dynamic load balancing algorithm Many short-lived tasks. No internal communication Use a run-time task-scheduling algorithm

38
Mapping Checklist to Judge the Quality of a Mapping
Consider designs based on one task per processor and multiple tasks per processor. Evaluate static and dynamic task allocation If dynamic task allocation chosen, the task allocator (i.e., manager) is not a bottleneck to performance If static task allocation chosen, ratio of tasks to processors is at least 10:1
 is not a bottleneck to performance. If static task allocation chosen, ratio of tasks to processors is at least 10:1.")
39
Task/Channel Case Studies
Boundary value problem Finding the maximum The n-body problem (omitted) Adding data input (omitted)
 Adding data input (omitted)")
40
Boundary Value Problem
Task-Channel Model Boundary Value Problem

41
Boundary Value Problem
Ice water Insulation Rod Problem: The ends of a rod of length 1 are in contact with ice water at 00 C. The initial temperature at distance x from the end of the rod is 100sin(x). (These are the boundary values.) The rod is surrounded by heavy insulation. So, the temperature changes along the length of the rod are a result of heat transfer at the ends of the rod and heat conduction along the length of the rod. We want to model the temperature at any point on the rod as a function of time.
. (These are the boundary values.) The rod is surrounded by heavy insulation. So, the temperature changes along the length of the rod are a result of heat transfer at the ends of the rod and heat conduction along the length of the rod. We want to model the temperature at any point on the rod as a function of time.")
42
Over time the rod gradually cools.
A partial differential equation (PDE) models the temperature at any point of the rod at any point in time. PDEs can be hard to solve directly, but a method called the finite difference method is one way to approximate a good solution using a computer. The derivative of f at a point s is defined by the limit: lim f(x+h) – f(x) h h If h is a fixed non-zero value (i.e. don’t take the limit), then the expression is called a finite difference.
 models the temperature at any point of the rod at any point in time. PDEs can be hard to solve directly, but a method called the finite difference method is one way to approximate a good solution using a computer. The derivative of f at a point s is defined by the limit: lim f(x+h) – f(x) h0 h. If h is a fixed non-zero value (i.e. don’t take the limit), then the expression is called a finite difference.")
43
Finite differences approach differential quotients as h goes to zero.
Thus, we can use finite differences to approximate derivatives. This is often used in numerical analysis, especially in numerical ordinary differential equations and numerical partial differential equations, which aim at the numerical solution of ordinary and partial differential equations respectively. The resulting methods are called finite-difference methods.

44
An Example of Using a Finite Difference Method for an ODE (Ordinary Differential Equation)
Given f’(x) = 3f(x) + 2, the fact that f(x+h) – f(x) approximates f’(x) h can be used to iteratively calculate an approximation to f’(x). In our case, a finite difference method finds the temperature at a fixed number of points in the rod at various time intervals. The smaller the steps in space and time, the better the approximation.
 = 3f(x) + 2, the fact that. f(x+h) – f(x) approximates f’(x) h. can be used to iteratively calculate an approximation to f’(x). In our case, a finite difference method finds the temperature at a fixed number of points in the rod at various time intervals. The smaller the steps in space and time, the better the approximation.")
45
Rod Cools as Time Progresses
A finite difference method computes these temperature approximations (vertical axis) at various points along the rod (horizontal axis) for different times between 0 and 3.
 at various points along the rod (horizontal axis) for different times between 0 and 3.")
46
The Finite Difference Approximation Requires the Following Data Structure
A matrix is used where columns represent positions and rows represent time. The element u(i,j) contains the temperature at position i on the rod at time j. At each end of the rod the temperature is always 0. At time 0, the temperature at point x is 100sin(x)
 contains the temperature at position i on the rod at time j. At each end of the rod the temperature is always 0. At time 0, the temperature at point x is 100sin(x)")
47
Finite Difference Method Actually Used
We have seen that for small h, we may approximate f’(x) by f’(x) ~ [f(x + h) – f(x)] / h It can be shown that in this case, for small h, f’’(x) ~ [f(x + h) – 2f(x) + f(x-h)] Let u(i,j) represent the matrix element containing the temperature at position i on the rod at time j. Using above approximations, it is possible to determine a positive value r so that u(i,j+1) ~ ru(i-1,j) + (1 – 2r)u(i,j) + ru(i+1,j) In the finite difference method, the algorithm computes the temperatures for the next time period using the above approximation.
 by. f’(x) ~ [f(x + h) – f(x)] / h. It can be shown that in this case, for small h, f’’(x) ~ [f(x + h) – 2f(x) + f(x-h)] Let u(i,j) represent the matrix element containing the temperature at position i on the rod at time j. Using above approximations, it is possible to determine a positive value r so that. u(i,j+1) ~ ru(i-1,j) + (1 – 2r)u(i,j) + ru(i+1,j) In the finite difference method, the algorithm computes the temperatures for the next time period using the above approximation.")
48
Partitioning Step This one is fairly easy to identify initially.
There is one data item (i.e. temperature) per grid point in matrix. Let’s associate one primitive task with each grid point. A primitive task would be the calculation of u(i,j+1) as shown on the last slide.
 per grid point in matrix. Let’s associate one primitive task with each grid point. A primitive task would be the calculation of u(i,j+1) as shown on the last slide.")
49
u(i,j+1) = ru(i-1,j) + (1 – 2r)u(i,j) + ru(i+1,j)
Communication Step Next, we identify the communication pattern between primitive tasks. Each interior primitive task needs three incoming and three outgoing channels because to calculate u(i,j+1) = ru(i-1,j) + (1 – 2r)u(i,j) + ru(i+1,j) the task needs u(i-1,j), u(i,j), and u(i+1,j). – i.e. 3 incoming channels and u(i,j+1) will be needed for 3 other tasks - i.e. 3 outgoing channels. Tasks on the sides don’t need as many channels, but we really need to worry about the interior nodes.
 = ru(i-1,j) + (1 – 2r)u(i,j) + ru(i+1,j) the task needs u(i-1,j), u(i,j), and u(i+1,j). – i.e. 3 incoming channels and. u(i,j+1) will be needed for 3 other tasks. - i.e. 3 outgoing channels. Tasks on the sides don’t need as many channels, but we really need to worry about the interior nodes.")
50
Agglomeration Step We now have a task/channel graph below: It should be clear this is not a good situation even if we had enough processors. The top row depends on values from bottom rows. Be careful when designing a parallel algorithm that you don’t think you have parallelism when tasks are sequential.

51
Collapse the Columns in the 1st Agglomeration Step
This task/channel graph represents each task as computing one temperature for a given position and time. This task/channel graph represents each task as computing the temperature at a particular position for all time steps.

52
Mapping Step This graph shows only a few intervals. We are using one processor per task. For the sake of a good approximation, we may want many more intervals than we have processors. We go back to the decision tree on page 72 to see if we can do better when we want more intervals than we have available processors. Note: On a SIMD with an interconnection network, we could probably stop here, as we could possibly have enough processors.

53
Use Decision Tree Pg 72 The number of tasks is static once we decide on how many intervals we want to use. The communication pattern among the tasks is regular – i.e. structured. Each task performs the same computations. Therefore, the decision tree says to create one task per processor by agglomerating primitive tasks so that computation workloads are balanced and communication is minimized. So, we will associate a contiguous piece of the rod with each task by dividing the rod into n pieces of size h, where n is the number of processors we have.

54
Pictorially Our previous task/channel graph assumed 10 consolidated tasks, one per interval: If we now assume 3 processors, we would now have: Note this maintains the possibility of using some kind of nearest neighbor interconnection network and eliminates unnecessary communication. What interconnection networks would work well?

55
Agglomeration and Mapping

56
Sequential execution time
Notation: – time to update element u(i,j) n – number of intervals on rod There are n-1 interior positions m – number of time iterations Then, the sequential execution time is m (n-1)
 n – number of intervals on rod. There are n-1 interior positions. m – number of time iterations. Then, the sequential execution time is. m (n-1) ")
57
Parallel Execution Time
Notation (in addition to ones on previous slide): p – number of processors – time to send (receive) a value to (from) another processor In task/channel model, a task may only send and receive one message at a time, but it can receive one message while it is sending a message. Consequently, a task requires 2 time to send data values to its neighbors, but it can receive the two data values it needs from its neighbors at the same time. So, we assume each processor is responsible for roughly an equal-sized portion of the rod’s intervals.
: p – number of processors. – time to send (receive) a value to (from) another processor. In task/channel model, a task may only send and receive one message at a time, but it can receive one message while it is sending a message. Consequently, a task requires 2 time to send data values to its neighbors, but it can receive the two data values it needs from its neighbors at the same time. So, we assume each processor is responsible for roughly an equal-sized portion of the rod’s intervals.")
58
Parallel Execution Time For Task/Channel Model
Then, the parallel execution time is for one iteration is (n-1)/p +2 and an estimate of the parallel execution time for all m iterations is m ( (n-1)/p +2) where – time to update element u(i,j) n – number of intervals on rod m – number of time iterations p – number of processors – time to send (receive) a value to (from) another processor Note that s means to round up to the nearest integer.
/p +2 and an estimate of the parallel execution time for all m iterations is. m ( (n-1)/p +2) where. – time to update element u(i,j) n – number of intervals on rod. m – number of time iterations. p – number of processors. – time to send (receive) a value to (from) another processor. Note that s means to round up to the nearest integer.")
59
Comparisons (n = #intervals; m = time )
Sequential Task/Channel with p << n-1 SIMD with p = n-1 m (n-1) m ( (n-1)/p +2) m ( +21) 48 100 4800 p = 1 600 + 200 p = 8 100 + 200 p = 48 ditto 300 + 200 p = 16 8K ~(800K) ~800 + 200 p = 1000 p = 8K 64K ~(6400K) ~6400 + 200 p = 64K 1For a SIMD, communications are quicker than for a message passing machine as a packet doesn’t have to be built.
 m ( (n-1)/p +2) m ( +21) p = + 200 p = + 200 p = 48. ditto. 300 + 200 p = 16. 8K. ~(800K) ~800 + 200 p = p = 8K. 64K. ~(6400K) ~6400 + 200 p = 64K. 1For a SIMD, communications are quicker than for a message passing machine as a packet doesn’t have to be built.")
60
Designing the Reduction Algorithm
Task-Channel Model Designing the Reduction Algorithm

61
Evaluating the Finite Difference Method (FDM) Solution for the Boundary Value Problem
The FDM only approximates the solution for the PDE. Thus, there is an error in the calculation. Moreover, the FDM tells us what the error is. If the computed solution is x and the correct solution is c, then the percent error is |(x-c)/c| at a given interval m. Let’s enhance the algorithm by computing the maximum error for the FDM calculation. However, this calculation is an example of a more general calculation, so we will solve the general problem instead.
/c| at a given interval m. Let’s enhance the algorithm by computing the maximum error for the FDM calculation. However, this calculation is an example of a more general calculation, so we will solve the general problem instead.")
62
Reduction Calculation
We start with any associative operator . A reduction is the computation of the expression a0 a1 a2 … an-1 Examples of associative operations: Add Multiply And, Or Maximum, Minimum On a sequential machine, this calculation would require how many operations? n – 1 i.e. the calculation is Θ(n). How many operations are needed on a parallel machine? For notational simplicity, we will work with the operation +.
. How many operations are needed on a parallel machine For notational simplicity, we will work with the operation +.")
63
Partitioning Communication Suppose we are adding n values.
First, divide the problem as finely as possible and associate precisely one value to a task. Thus we have n tasks. Communication We need channels to move the data together in a processor so the sum can be computed. At the end of the calculation, we want the total in a single processor.

64
Communication The brute force way would be to have one task receive all the other n-1 values and perform the additions. Obviously, this is not a good way to go. In fact, it will be slower than the sequential algorithm because of the communication overhead! Its time is (n-1)( + ) where is the communication cost to send and receive one element and is the time to perform the addition. The sequential algorithm is only (n-1)!
( + ) where is the communication cost to send and receive one element and is the time to perform the addition. The sequential algorithm is only (n-1)!")
65
Parallel Reduction Evolution Let’s Try
The timing is now (n/2)( + ) +
( + ) + ")
66
Parallel Reduction Evolution But, Why Stop There?
The timing is now (n/4)( + ) + 2
( + ) + 2")
67
If We Continue With This Approach
We have what is called a binomial tree communication pattern. It is one of the most commonly encountered communication patterns in parallel algorithm design. Now you can see why the interconnection networks we have seen are typically used.

68
The Hypercube and Binomial Trees

69
The Hypercube and Binomial Trees
An 8 node bionomial tree is a subgraph of the 8 node hypercube

70
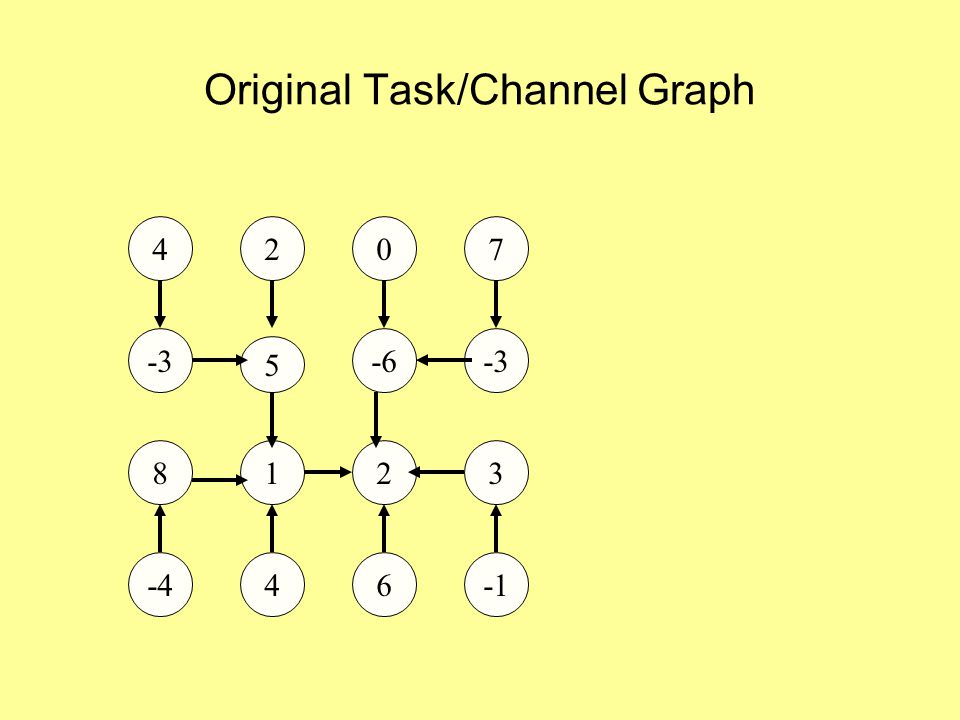
Finding Global Sum Using 16 Task/Channel Processors
Start with one number per processor. Half send values and half receive and add. 4 2 7 -3 5 -6 -3 8 1 2 3 -4 4 6 -1

71
Finding Global Sum 1 7 -6 4 4 5 8 2

72
Finding Global Sum 8 -2 9 10

73
Finding Global Sum 17 8

74
Finding Global Sum Binomial Tree 25

75
What If You Don’t Have a Power of 2?
For example, suppose we have 2k + r numbers where r < 2k ? In the first step, r processors send values and r tasks receive values and add their values. Now r tasks become inactive and we proceed as before. Example: With 6 numbers. Send 2 numbers to 2 other tasks and add them. Now you have 4 tasks with numbers assigned. So, if the number of tasks n is a power of 2, reduction can be performed in log n communication steps. Otherwise, we need log n + 1. Thus, without loss of generality, we can assume we have a power of 2 for the communication steps.

76
Agglomeration and Mapping
We will assume that the number of processors p is a power of 2. For task/channel machines, we’ll assume p << n (i.e. p is much less than n). Using the mapping decision tree on page 72, we see we should minimize communication and create one task per processor since we have Static number of tasks Structured communication Constant computation time per task
. Using the mapping decision tree on page 72, we see we should minimize communication and create one task per processor since we have. Static number of tasks. Structured communication. Constant computation time per task.")
77
Original Task/Channel Graph
4 2 7 -3 -6 -3 5 8 1 2 3 -4 4 6 -1
78
Agglomeration to 4 Processors Initially This Minimizes Communication
But, we want a single task per processor So, each processor will run the sequential algorithm and find its local subtotal before communicating to the other tasks ...

79
Agglomeration and Mapping Complete
sum

80
Analysis of Reduction Algorithm
Assume n integers are divided evenly among the p tasks, no task will handle more than n/p integers. The time needed to perform concurrently their subtasks is (n/p - 1) where is the time to perform the binary operation. We already know the reduction can be performed in log p communication steps. The receiving processor must wait for the message to arrive and add its value to the received value. So each reduction step requires + time. Combining all of these, the overall execution time is (n/p - 1) + log p ( + ) What would happen on a SIMD with p = n?
 where is the time to perform the binary operation. We already know the reduction can be performed in log p communication steps. The receiving processor must wait for the message to arrive and add its value to the received value. So each reduction step requires + time. Combining all of these, the overall execution time is. (n/p - 1) + log p ( + ) What would happen on a SIMD with p = n")
81
Parallel and Distributed Algorithms (CS 6/76501)
Asynchronous Communication Costs & Performance Metrics

82
References Michael Quinn, Parallel Programming in C with MPI and OpenMP, McGraw Hill, 2004. Chapters 7 plus algorithm examples. Textbook Slides for Chapter 7 on isoefficiencyds Ananth Grama, Anshul Gupta, George Karypis, and Vipin Kumar, Introduction to Parallel Computing, 2nd Edition, Addison Wesley, 2003. Particularly, Section 2.5, pgs Plan to make available online Chapter 5 on performance evaluation used lightly Authors’ Slides for Section 2.5

83
Communication Costs in Asychronous Computing

84
Message Passing Terminology
The time to communicate a message between two nodes in a network is the sum of the following: The time to prepare a message for transmission. The time taken by the message to transverse the network to its destination. Link: Connection between two nodes. A switch enables packets to be routed through a node to other nodes without disturbing the processor. The links can be assumed to be bi-directional. Bandwidth: The number of words or bits that can be transmitted in unit time (i.e., bits per second)
")
85
Communications Cost Parameters
The principal parameters that determine the communication cost are the following: Startup time: ts Time required to handle a message at the sending and receiving nodes. Includes the time to prepare a message and the time to execute the routing algorithm. Per-hop time: th Time taken by the header of a node to reach the next directly connected node in its path. Also called the node latency.) Per-word transfer time: tw If the channel bandwidth is r words per second, then each word takes tw= 1/r to traverse the link
 Per-word transfer time: tw. If the channel bandwidth is r words per second, then each word takes tw= 1/r to traverse the link.")
86
Store-and-Forward Routing
A message traversing multiple hops is completely received at an intermediate hop before being forwarded to the next hop. The total communication cost for a message of size m words to traverse l communication links is In most platforms, th is small and the above expression can be approximated by

87
Packet Routing Store-and-forward makes poor use of communication resources. Packet routing breaks messages into packets and pipelines them through the network. Since packets may take different paths, each packet must carry routing information, error checking, sequencing, and other related header information. The total communication time for packet routing is approximated by: The factor tw accounts for overheads in packet headers.

88
Cut-Through Routing Takes the concept of packet routing to an extreme by further dividing messages into basic units called flits. Since flits are typically small, the header information must be minimized. This is done by forcing all flits to take the same path, in sequence. A tracer message first programs all intermediate routers. All flits then take the same route. Error checks are performed on the entire message, as opposed to flits. No sequence numbers are needed.

89
Cut-Through Routing The total communication time for cut-through routing is approximated by: This is identical to packet routing, however, tw is typically much smaller.

90
Routing Techniques Passing a message from node P0 to P3 (a) through a store-and-forward communication network; (b) and (c) extending the concept to cut-through routing. The shaded regions represent the time that the message is in transit. The startup time associated with this message transfer is assumed to be zero.
 through a store-and-forward communication network; (b) and (c) extending the concept to cut-through routing. The shaded regions represent the time that the message is in transit. The startup time associated with this message transfer is assumed to be zero.")
92
Simplified Cost Model for Communicating Messages
The cost of communicating a message between two nodes l hops away using cut-through routing is given by In this expression, th is typically smaller than ts and tw. For this reason, the second term in the RHS does not show, particularly, when m is large. Furthermore, it is often not possible to control routing and placement of tasks (e.g., when using MPI). For these reasons, we can approximate the cost of message transfer by
. For these reasons, we can approximate the cost of message transfer by.")
93
Simplified Cost Model for Communicating Messages
It is important to note that the original expression for communication time is valid for only uncongested networks. If a link takes multiple messages, the corresponding tw term must be scaled up by the number of messages. Different communication patterns congest different networks to varying extents. It is important to understand and account for this in the communication time accordingly.

94
Cost Models for Shared Address Space Machines
While the basic messaging cost applies to these machines as well, a number of other factors make accurate cost modeling more difficult. Memory layout is typically determined by the system. Smaller cache sizes can result in cache thrashing. Overheads associated with ‘invalidate and update’ operations are difficult to quantify. Spatial locality is difficult to model. Pre-fetching can play a role in reducing the overhead associated with data access. False sharing and contention are difficult to model.

95
Performance Evaluation Metrics with Asynchronous Communication Costs
Including the Isoefficiency Metric & Scalability

96
Performance Metrics Revisited
Performance metrics were discussed in the first set of slides (Introduction & General Concepts). At that time, no restrictions were made as to whether these metrics were for synchronous or asynchronous models. The definitions of the metrics introduced there are the same for both synchronous & asynchronous models. However, there is a difference in the communication cost and how it is measured: A basic communication step in a synchronous model is treated the same as a basic computation step and charged a cost of O(1). For data parallel algorithms on asychronous models, data movements costs may be essentially the same as above. However, for the asynchronous communications covered here, asynchronous communication cost estimates should be used.
. At that time, no restrictions were made as to whether these metrics were for synchronous or asynchronous models. The definitions of the metrics introduced there are the same for both synchronous & asynchronous models. However, there is a difference in the communication cost and how it is measured: A basic communication step in a synchronous model is treated the same as a basic computation step and charged a cost of O(1). For data parallel algorithms on asychronous models, data movements costs may be essentially the same as above. However, for the asynchronous communications covered here, asynchronous communication cost estimates should be used.")
97
Performance Metrics and Asynchronous Communication
Running Time (or Execution Time): tp Time elapsed between when the first processor starts executing until the last processor terminates. While this definition is the same as the one given earlier, the communication is calculated separately and tp = tcomp + tcomm. Speedup: (n,p) As before, (n,p) = ts/tp, where ts is the fastest known sequential time for an algorithm. Total Parallel Overhead T0(n,p) = ptp – ts = cost – ts Note that ts time units are needed to do useful work and the remainder is overhead caused by parallelism.
: tp. Time elapsed between when the first processor starts executing until the last processor terminates. While this definition is the same as the one given earlier, the communication is calculated separately and tp = tcomp + tcomm. Speedup: (n,p) As before, (n,p) = ts/tp, where ts is the fastest known sequential time for an algorithm. Total Parallel Overhead. T0(n,p) = ptp – ts = cost – ts. Note that ts time units are needed to do useful work and the remainder is overhead caused by parallelism.")
98
Notation needed for the Isoefficiency Relation Slides
n data size p number of processors T(n,p) Execution time, using p processors (n,p) speedup (n) Inherently sequential computations (n) Potentially parallel computations (n,p) Communication operations (n,p) Efficiency Note: If (n) occurs, it is a misprint; Replace it with (n)
 Execution time, using p processors. (n,p) speedup. (n) Inherently sequential computations. (n) Potentially parallel computations. (n,p) Communication operations. (n,p) Efficiency. Note: If (n) occurs, it is a misprint; Replace it with (n)")
99
The Isoefficiency Metric
Parallel system – a parallel program executing on a parallel computer Scalability of a parallel system - a measure of its ability to increase performance as number of processors increases A scalable system maintains efficiency as processors are added Isoefficiency - a way to measure scalability

100
Isoefficiency Concepts
T0(n,p) is the total time spent by processes doing work not done by sequential algorithm. T0(n,p) = (p-1)(n) + p(n,p) We want the algorithm to maintain a constant level of efficiency as the data size n increases, so (n,p) is required to be a constant. Recall that T(n,1) represents the sequential execution time.
 is the total time spent by processes doing work not done by sequential algorithm. T0(n,p) = (p-1)(n) + p(n,p) We want the algorithm to maintain a constant level of efficiency as the data size n increases, so (n,p) is required to be a constant. Recall that T(n,1) represents the sequential execution time.")
101
The Isoefficiency Relation
Suppose a parallel system exhibits efficiency (n,p). Define In order to maintain the same level of efficiency as the number of processors increases, n must be increased so that the following inequality is satisfied.
. Define. In order to maintain the same level of efficiency as the number of processors increases, n must be increased so that the following inequality is satisfied.")
102
Isoefficiency Derivation Steps
Begin with speedup formula Compute total amount of overhead Assume efficiency remains constant Determine relation between sequential execution time and overhead

103
Deriving Isoefficiency Relation
Determine overhead Substitute overhead into speedup equation Substitute T(n,1) = (n) + (n). Assume efficiency is constant. Isoefficiency Relation
 = (n) + (n). Assume efficiency is constant. Isoefficiency Relation.")
104
Isoefficiency Relation Usage
Used to determine the range of processors for which a given level of efficiency can be maintained The way to maintain a given efficiency is to increase the problem size when the number of processors increase. The maximum problem size we can solve is limited by the amount of memory available The memory size is a constant multiple of the number of processors for most parallel systems

105
The Scalability Function
Suppose the isoefficiency relation reduces to n f(p) Let M(n) denote memory required for problem of size n M(f(p))/p shows how memory usage per processor must increase to maintain same efficiency We call M(f(p))/p the scalability function [i.e., scale(p) = M(f(p))/p) ]
 Let M(n) denote memory required for problem of size n. M(f(p))/p shows how memory usage per processor must increase to maintain same efficiency. We call M(f(p))/p the scalability function [i.e., scale(p) = M(f(p))/p) ]")
106
Meaning of Scalability Function
To maintain efficiency when increasing p, we must increase n Maximum problem size is limited by available memory, which increases linearly with p Scalability function shows how memory usage per processor must grow to maintain efficiency If the scalability function is a constant this means the parallel system is perfectly scalable

107
Interpreting Scalability Function
Cplogp Cannot maintain efficiency Cp Memory Size Memory needed per processor Can maintain efficiency Clogp C Number of processors

108
Example 1: Reduction Sequential algorithm complexity T(n,1) = (n)
Parallel algorithm Computational complexity = (n/p) Communication complexity = (log p) Parallel overhead T0(n,p) = (p log p)
 Communication complexity = (log p) Parallel overhead T0(n,p) = (p log p)")
109
Reduction (continued)
Isoefficiency relation: n C p log p We ask: To maintain same level of efficiency, how must n increase when p increases? Since M(n) = n, The system has good scalability
 = n, The system has good scalability.")
110
Example 2: Floyd’s Algorithm (Chapter 6 in Quinn Textbook)
Sequential time complexity: (n3) Parallel computation time: (n3/p) Parallel communication time: (n2log p) Parallel overhead: T0(n,p) = (pn2log p)
 Parallel computation time: (n3/p) Parallel communication time: (n2log p) Parallel overhead: T0(n,p) = (pn2log p)")
111
Floyd’s Algorithm (continued)
Isoefficiency relation n3 C(p n3 log p) n C p log p M(n) = n2 The parallel system has poor scalability
 n C p log p. M(n) = n2. The parallel system has poor scalability.")
112
Example 3: Finite Difference
See Figure 7.5 Sequential time complexity per iteration: (n2) Parallel communication complexity per iteration: (n/p) Parallel overhead: (n p)
 Parallel communication complexity per iteration: (n/p) Parallel overhead: (n p)")
113
Finite Difference (continued)
Isoefficiency relation n2 Cnp n C p M(n) = n2 This algorithm is perfectly scalable
 = n2. This algorithm is perfectly scalable.")
114
Multi-Tasking Models and Algorithms
Revision Plans for this Material

115
Outline for Revision Task-Channel (Computational) Model Basics
Revised to here Comments following this outline give general ideas Common Decomposition Methods Characteristics of Tasks and Interactions Mapping Techniques for Load Balancing Some Parallel Algorithm Models The Data-Parallel Model The Task Graph Model The Work Pool Model The Master-Slave Model The Pipeline or Producer-Consumer Model Hybrid Models

116
Outline (cont.) Algorithm examples for most of preceding algorithm models. This part currently missing & need to add next time. Some could be added as examples under Task/Channel model Task-Channel (Computational) Model Asynchronous Communication and Performance Evaluation Modeling Asynchronous Communicaiton Performance Metrics and Asynchronous Communications The Isoefficiency Metric & Scalability BSP (Computational) Model Slides posted separately on course website
 Model. Asynchronous Communication and Performance Evaluation. Modeling Asynchronous Communicaiton. Performance Metrics and Asynchronous Communications. The Isoefficiency Metric & Scalability. BSP (Computational) Model. Slides posted separately on course website.")
117
Proposed Revision Comments
Change title of “strictly asynchronous models” to “multitasking models”. This has been partly accomplished, but most interior slides still use the old terminology. The slides for the “Multi-Tasking Models” is in a “second draft” stage. An initial set of slides that partially covered this material was first created in Spring 2005, when this “Parallel Algorithms and Models” material was last ta\ught. The current set of slides needs to be revised to improve the integration of the material covered. Some topics are partially covered in two places, such as data decomposition Since coverage of other models start with the definition of the model, the “Multi-Tasking Models” material should also start with a model definition. The Task/Channel model seems to be the better model to use for this material, with the BSP mentioned afterwards as another “strictly asynchronous” model.

118
Proposed Revision Comments (cont)
The material covered from Quinn’s book and Grama et.al. need to be better integrated. Quinn’s presentation is overly simplistic and does not cover all issues that need to be covered. Some items (e.g., data decomposition) are essentially covered twice. The Foster-Quinn assignment of tasks to processors could be covered towards the end of material as one possible mapping. “Asynchronous Communication and Performance Evaluation” relocation Probably put isoefficiency material with material in first chapter on analysis of algorithms, as it makes sense for earlier models as well.
 are essentially covered twice. The Foster-Quinn assignment of tasks to processors could be covered towards the end of material as one possible mapping. Asynchronous Communication and Performance Evaluation relocation. Probably put isoefficiency material with material in first chapter on analysis of algorithms, as it makes sense for earlier models as well.")
Similar presentations

. One of the functions.>")


 Algorithm Design Parallel Computing Fall 2007.>")


: Selim Akl, “Parallel Computation: Models and Methods”, Prentice Hall, 1997, Updated.>")


>")

