Download presentation
Presentation is loading. Please wait.

1
Is SES a Surrogate for IQ in Predicting Health? Linda S. Gottfredson University of Delaware Rosalind Arden Kings College, London Geoffrey Miller University of New Mexico International Congress of Psychology Berlin, Germany July 24, 2008

2
Social Cause Theory of Health Disparities Striking fact – All indicators of social class privilege predict disparities in health—in virtually all places, times, etc. Striking problem with “wealth health” theory – Social class indicators too uniformly predictive to represent material resources So, new “social-psychological” theory – Inequality itself creates unhealthy psychological hazards. – Search now underway for a highly generalizable, transportable resource or “fundamental cause”—stress of relative deprivation??

3
One Alternative—“g is useful tool for prospering in everyday life” Much is known about g: Highly general, highly transportable resource Good construct validity – A general proficiency to learn and reason well – Many correlates in brain and behavior Measured reliably Good predictive validity: – E.g., Predicts trainability and performance in all jobs – Predicts better when jobs more complex Highly stable, highly heritable by adolescence

4
But relevant to health? A mechanism: Health self-care matters Health self-care is like any other job – Good performance depends on learning and reasoning (g) – Demands are greatest when tasks most complex (constantly changing, ambiguous, multi-faceted, abstract, unclear means-ends…) – Examples: accident prevention, chronic diseases such as diabetes g level more critical (predictive) when tasks are more complex Advances in health care increase both complexity and opportunity to choose Those stubborn disparities: Greater choice and complexity increases variation (disparities) in performance (“second law of individual differences”)
 – Demands are greatest when tasks most complex (constantly changing, ambiguous, multi-faceted, abstract, unclear means-ends…) – Examples: accident prevention, chronic diseases such as diabetes g level more critical (predictive) when tasks are more complex Advances in health care increase both complexity and opportunity to choose Those stubborn disparities: Greater choice and complexity increases variation (disparities) in performance ( second law of individual differences ).")
5
A Prediction : “SES indicators predict health disparities to the extent they act as surrogates for g”

6
Opportunity to Test Prediction: Vietnam-Era Veterans Data Study mandated by US Congress: Did defoliants affect health of Vietnam veterans? Inducted 1965-1971 (N =18,313) – Average age at induction = 20 – Half served in Vietnam war theatre – 4 cognitive tests, used to extract g factor Telephone interview ~1985 (N =15,288) – Average age at interview = 37 Physical/mental exam ~1985 (N = 4,462) Mortality follow-up 2000 – Average age ~ 52
 – Average age at induction = 20 – Half served in Vietnam war theatre – 4 cognitive tests, used to extract g factor Telephone interview ~1985 (N =15,288) – Average age at interview = 37 Physical/mental exam ~1985 (N = 4,462) Mortality follow-up 2000 – Average age ~ 52.")
7
Correlations of g and 3 SES Indicators With 4 Health Outcomes and 2 Predictors (age partialled out) gPTSD symptoms (15) Anxiety/ depression (7) Somatic (19) Self- rated health MarriedServed in Vietnam g1.00 Years Educ.56 Occu Pres.37 Family Income.36
 gPTSD symptoms (15) Anxiety/ depression (7) Somatic (19) Self- rated health MarriedServed in Vietnam g1.00 Years Educ.56 Occu Pres.37 Family Income.36")
8
Correlations of g and 3 SES Indicators With 4 Health Outcomes and 2 Predictors (age partialled out) gPTSD symptoms (15) Anxiety/ depression (7) Somatic (19) Self- rated health MarriedServed in Vietnam g1.00-.20-.21-.04.27.02-.06 Years Educ.56-.15-.16-.00.25-.00-.06 Occu Pres.37-.13-.12-.01.18.07-.04 Family Income.36-.22-.19-.05.26.30-.02
 gPTSD symptoms (15) Anxiety/ depression (7) Somatic (19) Self- rated health MarriedServed in Vietnam g Years Educ Occu Pres Family Income")
9
Correlations of g and 3 SES Indicators With 4 Health Outcomes and 2 Predictors (age partialled out) gPTSD symptoms (15) Anxiety/ depression (7) Somatic (19) Self- rated health MarriedServed in Vietnam g1.00-.20-.21-.04.27.02-.06 Years Educ.56-.15-.16-.00.25-.00-.06 Occu Pres.37-.13-.12-.01.18.07-.04 Family Income.36-.22-.19-.05.26.30-.02 V Family income violates prediction—or does it? What does it stand for? WWWhat do ANY of the SES indicators stand for??

10
Correlations of g and 3 SES Indicators With 4 Health Outcomes and 2 Predictors (age partialled out) gPTSD symptoms (15) Anxiety/ depression (7) Somatic (19) Self- rated health MarriedServed in Vietnam g1.00-.20-.21-.04.27.02-.06 Years Educ.56-.15-.16-.00.25-.00-.06 Occu Pres.37-.13-.12-.01.18.07-.04 Family Income.36-.22-.19-.05.26.30-.02 Income per capita.22-.10-.11-.01.13-.44-.01 What resource(s) does marriage stand for? Social support? Financial buffer (2 nd income)? Own desirability as a mate?
. Own desirability as a mate .")
11
Cox Regressions of Mortality on g, SES, and Covariates (Hazards Ratios) (1)(2)(3)(4)(5)(6)(7)(8)(9) Age.99.101.021.01 1.02 Vietnam1.02.101.00.91.90.89 g.76.86.84.85.88.87.90 Income.79.85.88.87.89 Married.55.56 Educ1.01 1.001.02 Occ prest1.00 PTSD1.01 1.00 Anx/depr1.061.041.00 Somatic1.111.08 Worse health, self-rated 1.39 If income omitted, both g and marriage appear stronger. If g omitted, PTSD, anxiety/depression, and self-rated health appear stronger So, inherently ambiguous analytic method Also, at wrong level of analysis!

12
The Problems. Some ways forward. Level of analysis must match question 1.Explaining disparities = between-group differences (means, rates) 2.Explaining health = within-group differences (SDs, variance, beta weights) Why? Groups may not differ (#1) on some causes of ill health (#2); or they may differ a lot on only one (#2) that contributes to within-group variation (#1) A proposal and modest attempt….
 2.Explaining health = within-group differences (SDs, variance, beta weights) Why. Groups may not differ (#1) on some causes of ill health (#2); or they may differ a lot on only one (#2) that contributes to within-group variation (#1) A proposal and modest attempt…..")
13
“Environmental scans” For recurring consilience across studies, variables, fields, levels of analysis (networks of convergence) – E.g., why do some sorts of group mean differences coincide but others less so? For anomolies and constraints—replicated violations of expectation (persistent divergence) – E.g., why do some risk gradients disfavor the higher classes? Why do some gradients reverse over time? For cascading, relentlessly compounding small effects – E.g., can we develop a calculus for measuring converging rivers of minuscule, inconspicuous risks?
 – E.g., why do some risk gradients disfavor the higher classes. Why do some gradients reverse over time. For cascading, relentlessly compounding small effects – E.g., can we develop a calculus for measuring converging rivers of minuscule, inconspicuous risks .")
14
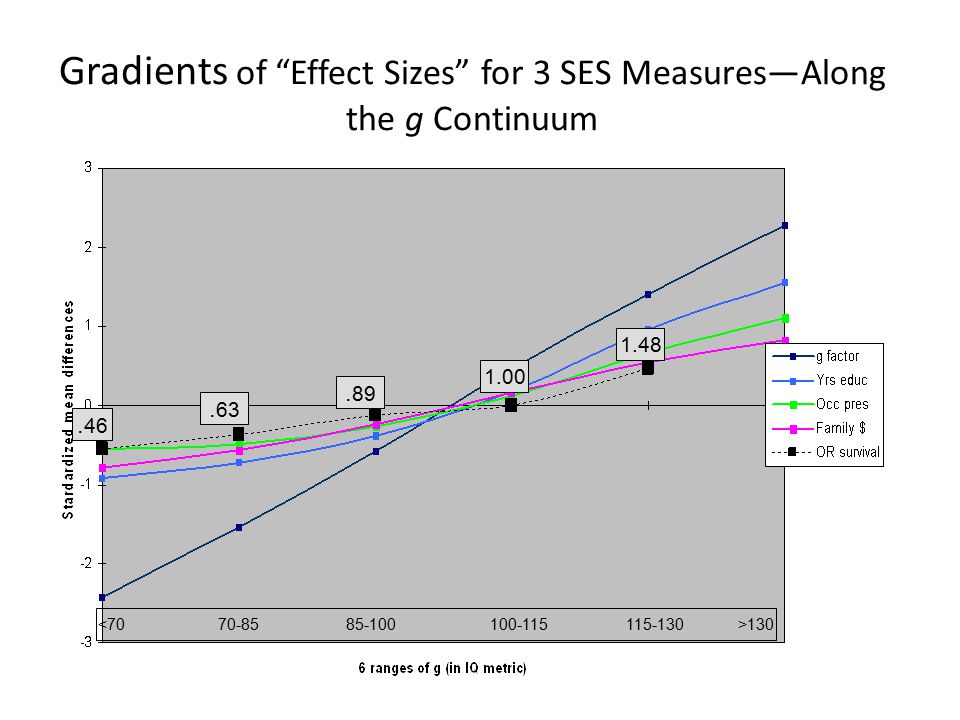
Gradients of “Effect Sizes” for 3 SES Measures—Along the g Continuum >130115-130100-11585-10070-85<70

15
Gradients of “Effect Sizes” for 3 SES Measures—Along the g Continuum >130115-130100-11585-10070-85<70. 63. 89 1.00 1.48. 46
16
Gradients of “Effect Sizes” for g and Other SES Measures—Along the Family-Income Continuum >$50K$40-50K$30-40K$20-30K$10-20K<$10K.31.55.75 1.00 1.09 1.17

17
Gradients of Psychological and Somatic Problems Along the g Continuum >130115-130100-11585-10070-85<70

18
Gradients of Avoiding Smoking and Drinking—Or Quitting—Along the g Continuum (Odds Ratios). >130115-130100-11585-10070-85<70

19
And No Cirrhosis! >130115-130100-11585-10070-85<70

20
Same Good Behaviors, Along the Family-Income Continuum >$50K$40-50K$30-40K$20-30K$10-20K<$10K

21
And No Cirrhosis! >$50K$40-50K$30-40K$20-30K$10-20K<$10K

22
Odds Ratios for Other Chronic Diseases—Along the g Continuum >130115-130100-11585-10070-85<70

23
PTSD Symptoms (Count of 15 items)
")
24
Anxiety-Depression (Count of 7 items)
")
25
Somatic Problems (Count of 19 items)
")
26
% Married Within Each g x Income Category

27
N of Men in Each g x Income Category

28
The Prediction? 1.Years of education and occupational prestige are mostly surrogates for g. 2.“Household income” captured something important and independent of g—but unclear what it represents (reverse causation possible, too) 3.g better than “household income” at predicting psychological problems (no reverse causation). 4.Psychological problems in 1985 does not predict mortality to 2000
 3.g better than household income at predicting psychological problems (no reverse causation). 4.Psychological problems in 1985 does not predict mortality to")
29
Thank you.

Similar presentations


 Childhood poverty is a major problem in the US –Over 22% of children in the US live in poverty as compared to 9% in.>")


 is widely used in research on health inequalities by socioeconomic status. However, researchers must be certain that.>")


