Download presentation
Presentation is loading. Please wait.

1
CHAPTER 10 BUDGETARY CONTROL AND RESPONSIBILITY ACCOUNTING
Managerial Accounting Weygandt • Kieso • Kimmel CHAPTER 10 BUDGETARY CONTROL AND RESPONSIBILITY ACCOUNTING Prepared by Dan R. Ward Suzanne P. Ward University of Louisiana at Lafayette John Wiley & Sons, Inc. © 2005

2
BUDGETARY CONTROL AND RESPONSIBILITY ACCOUNTNG
CHAPTER 10 BUDGETARY CONTROL AND RESPONSIBILITY ACCOUNTNG Study Objectives Describe the concept of budgetary control. Evaluate the usefulness of static budget reports. Explain the development of flexible budgets and the usefulness of flexible budget reports. Describe the concept of responsibility accounting

3
Study Objectives: Continued
Indicate the features of responsibility reports for cost centers. Identify the content of responsibility reports for profit centers. Explain the basis and formula used in evaluating performance in investment centers

4
BUDGETARY CONTROL Study Objective 1
A major function of management is to control operations Takes place by means of budget reports which compare actual results with planned objectives Provides management with feedback on operations

5
BUDGETARY CONTROL Works best when a company has a formalized reporting system which: Identifies the name of the budget report (such as the sales budget or the manufacturing overhead budget) States the frequency of the report (weekly or monthly) Specifies the purpose of the report Indicates recipient of the report
 States the frequency of the report (weekly or monthly) Specifies the purpose of the report. Indicates recipient of the report.")
6
BUDGETARY CONTROL Schedule below illustrates a partial budgetary control system for a manufacturing company. Note the frequency of reports and their emphasis on control

7
STATIC BUDGET REPORTS Study Objective 2
Projection of budget data at one level of activity Ignores data for different levels of activity Always compares actual results with the budget data at the activity level used in the master budget Static budgets are best for fixed costs and expenses

8
STATIC BUDGET REPORTS Example – Hayes Company
Budget/actual sales data for Kitchen-mate for the first and second quarters of 2005 Data for Hayes Company from Chapter 9

9
STATIC BUDGET REPORTS Example – Hayes Company
Shows that sales are $1,000 under budget – an unfavorable result. Difference is less that 1% of budgeted sales - assume immaterial (not significant) to top management with no specific action taken
 to top management with no specific action taken.")
10
STATIC BUDGET REPORTS Example – Hayes Company
Shows that sales were $10,500, or 5%, below budget Material difference between budgeted and actual sales Merits investigation - begin by asking the sales manager the cause(s) – consider corrective action
 – consider corrective action.")
11
STATIC BUDGET REPORTS Uses and Limitations
Appropriate for evaluating a manager’s effectiveness in controlling costs when: Actual level of activity closely approximates the master budget activity level Behavior of the costs is fixed in response to changes in activity Appropriate for fixed costs Not appropriate for variable costs

12
FLEXIBLE BUDGETS Study Objective 3
Projects budget data for various levels of activity Essentially, a series of static budgets at different activity levels Budgetary process more useful if it is adaptable to changes in operating conditions Can be prepared for each type of budget in the master budget Flexible budgets are static budgets at different activity levels

13
FLEXIBLE BUDGET Example – Barton Steel
Static budget for the Forging Department at a 10,000 unit level:

14
FLEXIBLE BUDGET Example – Barton Steel
Demand increases – produce 12,000 units rather than 10,000

15
FLEXIBLE BUDGET Example – Barton Steel
Very large variances in budget report due to increased demand for steel ingots Total unfavorable difference of $132,000 – 12% over budget Comparison based on budget data for 10,000 units - the original activity level which is not relevant Meaningless to compare actual variable costs for 12,000 units with budgeted variable costs for 10,000 units Variable cost increase with production Budgeted amounts should increase proportionately with production

16
FLEXIBLE BUDGET Example – Barton Steel
Budget data for variable costs at 10,000 units: Calculate variable costs at the 12,000 unit level:

17
FLEXIBLE BUDGET Example – Barton Steel
New budget report (no change in fixed costs)
")
18
DEVELOPING THE FLEXIBLE BUDGET Steps
Identify the activity index and the relevant range of activity Identify the variable costs and determine the budgeted variable cost per unit of activity for each cost Identify the fixed costs and determine the budgeted amount for each cost Prepare the budget for selected increments of activity within the relevant range

19
FLEXIBLE BUDGET – A CASE STUDY Example – Fox Manufacturing Co.
Monthly comparisons of actual and budgeted manufacturing overhead costs for Finishing Department 2005 master budget Expected operating capacity of 120,000 direct labor hours Overhead costs:

20
FLEXIBLE BUDGET – A CASE STUDY Example – Fox Manufacturing Co.
Identify the activity index and the relevant range activity index: direct labor hours relevant range: 8,000 – 12,000 direct labor hours per month Identify the variable costs, and determine the budgeted variable cost per unit of activity for each cost

21
FLEXIBLE BUDGET – A CASE STUDY Example – Fox Manufacturing Co.
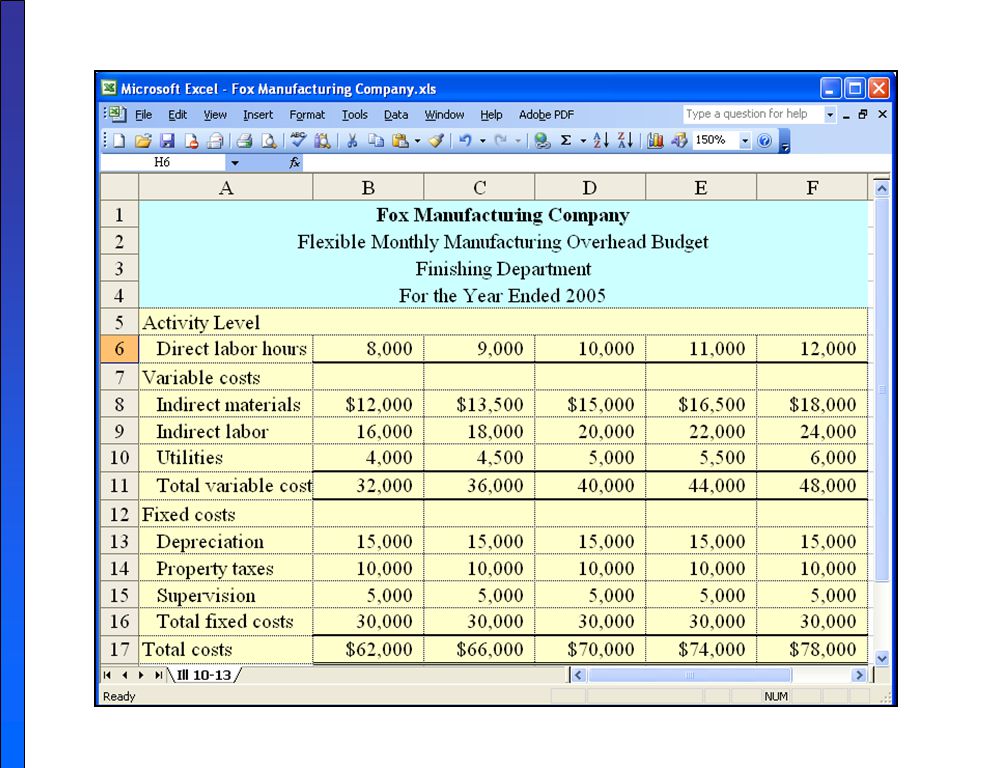
Identify the fixed costs and determine the budgeted amount for each cost Three fixed costs per month: depreciation $15,000 property taxes $5,000 supervision $10,000 Prepare the budget for selected increments of activity within the relevant range Prepared in increments of 1,000 direct labor hours

23
FLEXIBLE BUDGET – A CASE STUDY Example – Fox Manufacturing Co.
Formula to determine total budgeted costs from the budget at any level of activity: * Total variable cost per unit X activity level Determine total budgeted costs for Fox Manufacturing Company with fixed costs of $30,000 and total variable cost $4 per unit At 9,000 direct labor hours : $30,000 + ($4 X 9,000) = $66,000 At 8,622 direct labor hours: $30,000 + ($4 X 8,622) = $64,488
 = $66,000. At 8,622 direct labor hours: $30,000 + ($4 X 8,622) = $64,488.")
24
FLEXIBLE BUDGET – A CASE STUDY Example – Fox Manufacturing Co.
Graphic flexible budget data highlighting 10,000 and 12,000 activity levels

25
FLEXIBLE BUDGET REPORTS
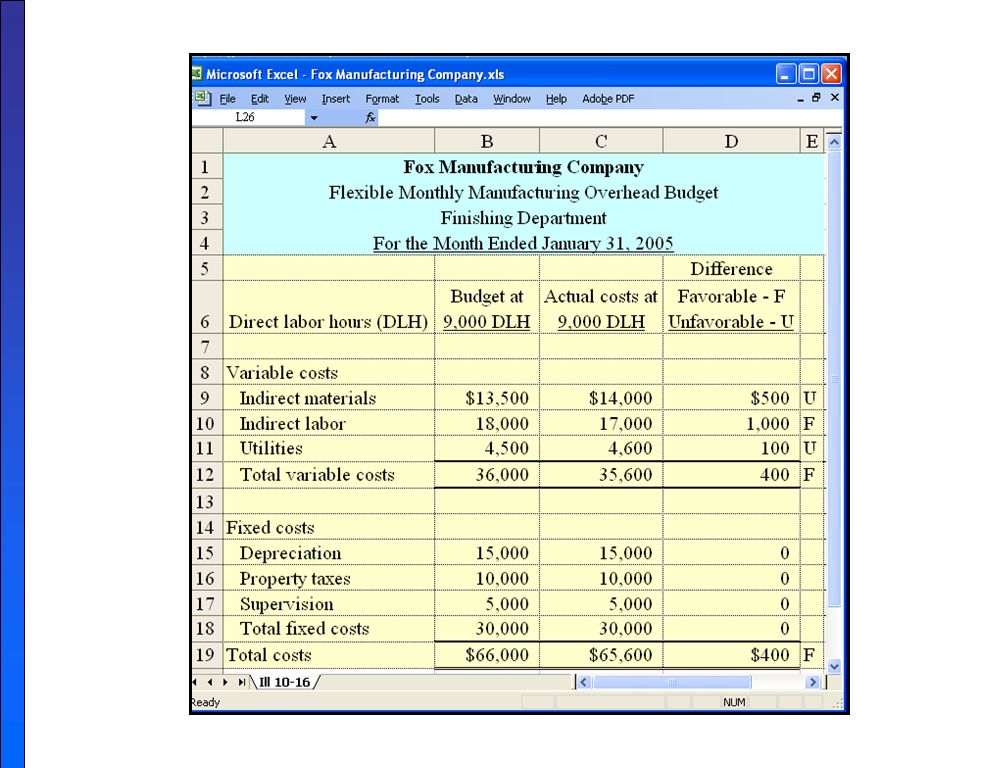
A type of internal report Consists of two sections: Production data for a selected activity index, such as direct labor hours Cost data for variable and fixed costs Widely used in production and service departments to evaluate a manager’s performance in production control and cost control A budget report for the Finishing Department for the month of January follows

27
MANAGEMENT BY EXCEPTION
Focus of top management’s review of a budget report: differences between actual and planned results Able to focus on problem areas Investigate only material and controllable exceptions Express materiality as a percentage difference from budget Controllability relates to those items controllable by the manager

28
Let’s Review Budgetary control involves all but one of the following:
Modifying future plans Analyzing differences Using static budgets Determining differences between actual and planned results

29
Let’s Review Budgetary control involves all but one of the following:
Modifying future plans Analyzing differences Using static budgets Determining differences between actual and planned results

30
THE CONCEPT OF RESPONSIBILITY ACCOUNTING Study Objective 4
Involves accumulating and reporting costs on the basis of the manager who has the authority to make the day-to-day decisions about the items Means a manager's performance is evaluated on the matters directly under the manager's control

31
THE CONCEPT OF RESPONSIBILITY ACCOUNTING
Conditions for using responsibility accounting: Costs and revenues can be directly associated with the specific level of management responsibility The costs and revenues are controllable at the level of responsibility with which they are associated Budget data can be developed for evaluating the manager's effectiveness in controlling the costs and revenues

32
THE CONCEPT OF RESPONSIBILITY ACCOUNTING
Levels of responsibility for controlling costs

33
THE CONCEPT OF RESPONSIBILITY ACCOUNTING
Responsibility center - any individual who has control and is accountable May extend from the lowest levels of management to the top strata of management Responsibility accounting is especially valuable in a decentralized company control of operations delegated to many managers throughout the organization

34
THE CONCEPT OF RESPONSIBILITY ACCOUNTING
Two differences from budgeting in reporting costs and revenues: Distinguishes between controllable and noncontrollable costs Emphasizes or includes only items controllable by the individual manager in performance reports Applies to both profit and not-for-profit entities Profit entities: maximize net income Not-for-profit: minimize cost of providing services

35
CONTROLLABLE VS NONCONTROLLABLE REVENUES AND COSTS
Can control all costs and revenues at some level of responsibility within the company Critical issue under responsibility accounting: Whether the cost or revenue is controllable at the level of responsibility with which it is associated

36
CONTROLLABLE VS NONCONTROLLABLE REVENUES AND COSTS
All costs controllable by top management Fewer costs controllable as one moves down to lower levels of management Controllable costs - costs incurred directly by a level of responsibility that are controllable at that level Noncontrollable costs – costs incurred indirectly which are allocated to a responsibility level

37
RESPONSIBILITY REPORTING SYSTEM
Involves preparation of a report for each level of responsibility in the company's organization chart Begins with the lowest level of responsibility and moves upward to higher levels Permits management by exception at each level of responsibility

38
RESPONSIBILITY REPORTING SYSTEM Example – Francis Chair Co.

39
RESPONSIBILITY REPORTING SYSTEM
Also permits comparative evaluations Plant manager can rank the department manager’s effectiveness in controlling manufacturing costs Comparative ranking provides incentive for a manager to control costs

40
RESPONSIBILITY REPORTING SYSTEM

41
TYPES OF RESPONSIBILITY CENTERS
Three basic types: Cost centers Profit centers Investment centers Indicates degree of responsibility that managers have for the performance of the center

42
TYPES OF RESPONSIBILITY CENTERS

43
TYPES OF RESPONSIBILITY CENTERS
Examples: Cost center: usually a production center or service department. Profit center: individual departments of retail stores and branch offices of banks. Investment center: subsidiary companies

44
RESPONSIBILITY ACCOUNTING FOR COST CENTERS
Based on a manager’s ability to meet budgeted goals for controllable costs Results in responsibility reports which compare actual controllable costs with flexible budget data Include only controllable costs in reports No distinction between variable and fixed costs

45
RESPONSIBILITY ACCOUNTING FOR COST CENTERS Example – Fox Manufacturing Co.
Assumes department manager can control all manufacturing overhead costs except depreciation, property taxes, and his own monthly salary of $4,000

46
RESPONSIBILITY ACCOUNTING FOR PROFIT CENTERS
Based on detailed information about both controllable revenues and controllable costs Manager controls operating revenues earned, such as sales, Manager controls all variable costs (and expenses) incurred by the center because they vary with sales
 incurred by the center because they vary with sales.")
47
RESPONSIBILITY ACCOUNTING FOR PROFIT CENTERS Direct and Indirect Fixed Costs
May have both direct and indirect fixed costs Direct fixed costs Relate specifically to a responsibility center Incurred for the sole benefit of the center Most controllable by the profit center manager Indirect fixed costs Pertain to a company's overall operating activities Incurred for the benefit of more than one profit center Most not controllable by the profit center manager

48
PROFIT CENTERS Responsibility Reports
Shows budgeted and actual controllable revenues and costs Prepared using the cost-volume-profit income statement format: Deduct controllable fixed costs from the contribution margin Controllable margin - excess of contribution margin over controllable fixed costs – best measure of manager’s performance in controlling revenues and costs Do not report noncontrollable fixed costs

49
PROFIT CENTER -RESPONSIBILITY REPORTS Example – Marine Division
$60,000 of indirect fixed costs are not controllable by manager not shown

50
RESPONSIBILITY ACCOUNTING FOR INVESTMENT CENTERS
Controls or significantly influences investment funds available for use ROI (return on investment) - primary basis for evaluating manager performance in an investment center ROI shows the effectiveness of the manager in utilizing the assets at his or her disposal
 - primary basis for evaluating manager performance in an investment center. ROI shows the effectiveness of the manager in utilizing the assets at his or her disposal.")
51
RESPONSIBILITY ACCOUNTING FOR INVESTMENT CENTERS - ROI
ROI is computed as follows: Operating assets include current assets and plant assets used in operations by the center. Exclude nonoperating assets such as idle plant assets and land held for future use Base average operating assets on the beginning and ending cost or book values of the assets

52
INVESTMENT CENTERS - Responsibility Report Example – Marine Division
All fixed costs are controllable by manager

53
JUDGMENTAL FACTORS IN ROI
Valuation of operating assets May be valued at acquisition cost, book value, appraised value, or market value Margin (income) measure May be controllable margin, income from operations, or net income R O I
 measure. May be controllable margin, income from operations, or net income. R O I.")
54
IMPROVING ROI ROI can be improved by
Increasing controllable margin or Reducing average operating assets Assume the following data for Laser Division of Berra Manufacturing:

55
IMPROVING ROI Increasing Controllable Margin
Increased by increasing sales or by reducing variable and controllable fixed costs Increase sales by 10% Sales increase $200,000 and contribution margin increases $90,000 ($200,000 X 45%) Thus, controllable margin increases to $690,000 ($600,000 + $90,000) New ROI is 13.8%
 Thus, controllable margin increases to $690,000 ($600,000 + $90,000) New ROI is 13.8%")
56
IMPROVING ROI Increasing Controllable Margin
Decrease variable and fixed costs 10% Total costs decrease $140,000 [($1,100,000 + $300,000) X 10%] Controllable margin becomes $740,000 ($600,000 + $140,000 ) New ROI becomes 14.8%
 X 10%] Controllable margin becomes $740,000 ($600,000 + $140,000 ) New ROI becomes 14.8%")
57
IMPROVING ROI Reducing Average Operating Assets
Reduce average operating assets by 10% or $500,000 Average operating assets become $4,500,000 ($5,000,000 X 10%) Controllable margin remains unchanged at $600,000 New ROI becomes 13.3%
 Controllable margin remains unchanged at $600,000. New ROI becomes 13.3%")
58
PRINCIPLES OF PERFORMANCE EVALUATION
Management function that compares actual results with budget goals At center of responsibility accounting Includes both behavioral and reporting principles

59
PRINCIPLES OF PERFORMANCE EVALUATION Behavioral Principles
Human factor – critical in performance evaluation Behavioral principles: Managers of responsibility centers should have direct input into the process of establishing budget goals for their area of responsibility The evaluation of performance should be based entirely on matters that are controllable by the manager being evaluated Top management should support the evaluation process The evaluation process must allow managers to respond to their evaluations The evaluation should identify both good and poor performance

60
PRINCIPLES OF PERFORMANCE EVALUATION Reporting Principles
Reporting principles for performance reports include reports which Contain only data that are controllable by the manager of the responsibility center Provide accurate and reliable budget data to measure performance Highlight significant differences between actual results and budget goals Are tailor-made for the intended evaluation Are prepared at reasonable intervals

61
Summary of Study Objectives
Describe the concept of budgetary control. Preparing periodic budget reports to compare actual results with planned objectives Analyzing the differences to determine causes Taking appropriate corrective action Modifying future plans, if necessary Evaluate the usefulness of static budget reports Useful in evaluating the progress toward planned sales and profit goals Also appropriate in assessing manager’s effectiveness in controlling cost when Actual activity approximates budget activity level and/or Costs are fixed

62
Summary of Study Objectives
Explain the development of flexible budgets and the usefulness of flexible budget reports. Identify the activity index and the relevant range Identify variable costs and determine the budgeted variable cost per unit Identify fixed costs and the budgeted amount for each cost Prepare budget for selected increments of activity within relevant range Flexible budget reports permit evaluation of manager’s performance

63
Summary of Study Objectives
Describe the concept of responsibility accounting. Accumulating and reporting revenues and costs on the basis of the individual who has the authority to make the decisions Manager’s performance judged on matters directly under manager’s control Necessary to distinguish between controllable and noncontrollable fixed costs Must identify three types of responsibility centers Cost centers Profit centers Investment centers

64
Summary of Study Objectives
Indicate the features of responsibility reports for cost centers. Compare actual costs with flexible budget data Reports show only controllable costs No distinction is made between variable and fixed costs Identify the content of responsibility reports for profit centers. For each profit center show Contribution margin Controllable fixed costs Controllable margin

65
Summary of Study Objectives
Explain the basis and formula used in evaluating performance in investment centers. Primary basis for evaluating performance : return on investment (ROI) Formula for ROI: Controllable margin ÷ average operating assets
 Formula for ROI: Controllable margin ÷ average operating assets.")
66
Let’s Review Under responsibility accounting, the evaluation of a manager’s performance is based on matters that the manager: Directly controls Directly and indirectly controls Indirectly controls Has shared responsibility for with another manager

67
Let’s Review Under responsibility accounting, the evaluation of a manager’s performance is based on matters that the manager: Directly controls Directly and indirectly controls Indirectly controls Has shared responsibility for with another manager

68
APPENDIX: RESIDUAL INCOME – ANOTHER PERFORMANCE MEASUREMENT
Most companies use ROI to evaluate investment performance Significant disadvantage - ignores the minimum rate of return on operating assets Rate at which cost are covered and a profit earned

69
APPENDIX: RESIDUAL INCOME – ANOTHER PERFORMANCE MEASUREMENT Example – Electronics Division of Pujols Manufacturing Co. Electronics Division has the following ROI: Considering producing a new product – Tracker To produce the product, operating assets increase $2,000,000 Tracker expected to generate an additional $260,000 of controllable margin

70
APPENDIX: RESIDUAL INCOME – ANOTHER PERFORMANCE MEASUREMENT Example – Electronics Division
Making Tracking reduces ROI from 20% to 18%: If only use ROI, would not produce Tracker However, if Electronics has a minimum rate of return of 10%, Tracker would be produced because its ROI, 13%, is greater

71
APPENDIX: RESIDUAL INCOME COMPARED TO ROI
Use the residual income approach to evaluate performance using the minimum rate of return Residual Income: The income that remains after subtracting from controllable margin the minimum rate of return on average operating assets Residual Income

72
APPENDIX: RESIDUAL INCOME COMPARED TO ROI Example – Electronics Division
The residual income for Tracking: With Tracker, Electronics’ residual income increases: Thus, ROI can be misleading by rejecting a project that actually increases income

73
APPENDIX: RESIDUAL INCOME WEAKNESS
Attempting to evaluate a company only on maximizing residual income ignores the fact that one division might use substantially fewer assets to attain the same level of residual income Electronics Division used $2,000,000 of average operating assets to generate $260,000 of residual income Can a different division use fewer operating assets to generate a greater amount of residual income?

74
APPENDIX: RESIDUAL INCOME WEAKNESS Example – Electronics Division vs
APPENDIX: RESIDUAL INCOME WEAKNESS Example – Electronics Division vs. Seadog Division Seadog used $4,000,000 to generate $460,000 of controllable margin Using the residual income approach, both investments are equal However, this ignores the fact that Seadog Required twice as many operating assets to achieve the same level of residual income

75
Summary of Study Objective (Appendix)
Explain the difference between ROI and residual income. ROI is controllable income divided by average operating assets Residual income is the income remaining after subtracting the minimum rate of return on average operating assets ROI can provide misleading results because Profitable investments can be rejected when the investment reduces ROI but increases overall profitability

76
COPYRIGHT Copyright © 2005 John Wiley & Sons, Inc. All rights reserved. Reproduction or translation of this work beyond that permitted in Section 117 of the 1976 United States Copyright Act without the express written consent of the copyright owner is unlawful. Request for further information should be addressed to the Permissions Department, John Wiley & Sons, Inc. The purchaser may make back-up copies for his/her own use only and not for distribution or resale. The Publisher assumes no responsibility for errors, omissions, or damages, caused by the use of these programs or from the use of the information contained herein.

Similar presentations