Download presentation
Presentation is loading. Please wait.

1
Thanks to: DARPA BioComp DNA&RNA Polonies: Mitra, Shendure, Zhu Protein MS: Jaffe, Leptos Metabolism/Proliferation models : Segre, Vitkup, Badarinarayana 20-Mar-2003 New Methods for Genomic Systems Biology

2
gggatttagctcagtt gggagagcgccagact gaa gat ttg gag gtcctgtgttcgatcc acagaattcgcacca Modeling successes: 3D & Sequence alignment

3
Agenda for March 20 15' George Church -- proteomics & polonies 20' Daniel Segre – Metabolic modeling 10' Matt Wright – 3D & 4D modeling 25' Jingdong Tian -- minigenome 10' Wayne Rindone – BioSpice Discussion throughout is welcome. 10’ Financial, etc.

4
DNA RNA Proteins Metabolites Replication rate Environment Biosystems Integrating Measures & Models Microbes Cancer & stem cells Darwinian optima In vitro replication Small multicellular organisms RNAi Insertions SNPs interactions

5
Improving Models & Measures Why model? “Killer Applications”: Share, Search, Merge, Check, Design

6
The issue is not speed, but integration. Cost per 99.99% bp : Including Reagents, Personnel, Equipment/5yr, Overhead/sq.m Sub-mm scale : 1 m = femtoliter (10 -15 ) Instruments $2-50K per CPU Why improve measurements? Human genomes (6 billion) 2 = 10 19 bp Immune & cancer genome changes >10 10 bp per time point RNA ends & splicing: in situ 10 12 bits/mm 3 Biodiversity: Environmental & lab evolution Compact storage 10 5 now to 10 17 bits/ mm 3 eventually & How ? ($1K per genome, 10 8 -10 13 bits/$ )
 Instruments $2-50K per CPU Why improve measurements. Human genomes (6 billion) 2 = bp Immune & cancer genome changes >10 10 bp per time point RNA ends & splicing: in situ bits/mm 3 Biodiversity: Environmental & lab evolution Compact storage 10 5 now to bits/ mm 3 eventually & How . ($1K per genome, bits/$ ).")
7
Projected costs determine when biosystems data overdetermination is feasible. In 1984, pre-HGP ( X, pBR322, etc.) 0.1bp/$, would have been $30B per human genome. In 2002, (de novo full vs. resequencing ) ABI/Perlegen/Lynx: $300M vs. $3M 10 3 bp/$ (4 log improvement) Other data I/O (e.g. video) 10 13 bits/$
 0.1bp/$, would have been $30B per human genome. In 2002, (de novo full vs. resequencing ) ABI/Perlegen/Lynx: $300M vs. $3M 10 3 bp/$ (4 log improvement) Other data I/O (e.g. video) bits/$.")
8
Steeper than exponential growth http://www.faughnan.com/poverty.html http://www.kurzweilai.net/meme/frame.html?main=/articles/art0184.html Kurzweil/Moore's law of ICs 1965

9
New sequencing approaches in commercial R&D Method liter/bp LengthError Test-set $/device bp/hr Capil fluidics e-6600 <0.1% 1e11 350k 80k ABI, Amersham, GenoMEMS, Caliper*, RTS* SeqByHyb e-12 1 <5% 1e9 200k 1M Perlegen-Affymetrix*, Xeotron* Mass Spectrometry Sequenom, Bruker* Single molecule>e-24 >>40? >80 30k-1M 180k Pore(Agilent*) Fluor(USGenomics, Solexa) FRET(VisiGen,Mobious) In vitro DNA-Amplification (e.g. Polonies) -- Multiplex cycles: Lynx*e-15 20<3% 1e7 ? 1M Pyroseq.* e-6>40<1% 1e6 100k 5k HMS* e-13 1M? ParAllele, 454, RTS* *GMC has a potential financial interest (or Harvard license)
 Fluor(USGenomics, Solexa) FRET(VisiGen,Mobious) In vitro DNA-Amplification (e.g. Polonies) -- Multiplex cycles: Lynx*e-15 20<3% 1e7 . 1M Pyroseq.* e-6>40<1% 1e6 100k 5k HMS* e-13 1M. ParAllele, 454, RTS* *GMC has a potential financial interest (or Harvard license).")
10
Why single molecules? Integration from cells/genomes/RNAs to data Geometric constraints : Who’s “in cis” on a molecule, complex, or cell. e.g. DNA Haplotypes & RNA splice-forms

11
Polymerase colonies (Polonies) along a DNA or RNA molecule
 along a DNA or RNA molecule")
12
A’ B B B B B B A Single Molecule From Library B B A’ 1st Round of PCR Primer is Extended by Polymerase B A’ B Polymerase colony (polony) PCR in a gel Primer A has 5’ immobilizing Acrydite Mitra & Church Nucleic Acids Res. 27: e34

13
Hybridize Universal Primer Add Red (Cy3) dTTP. Wash. Add Green (FITC) dCTP Wash; Scan BB’ 3’5’ A G T. T C BB’ 3’5’ G C G.. C Sequence polonies by sequential, fluorescent single-base extensions
 dCTP Wash; Scan BB’ 3’5’ A G T. T C BB’ 3’5’ G C G.. C Sequence polonies by sequential, fluorescent single-base extensions.")
14
Inexpensive, off-the-shelf equipment MJR in situ Cycler $10K Automated slide fluidics $4K Microarray Scanner $26K+

15
Human Haplotype: CFTR gene 45 kbp Rob Mitra Vincent Butty Jay Shendure Ben Williams

16
Quantitative removal of Fluorophores Rob Mitra

17
Template ST30: 3' TCACGAGT Base added: (C) A G T (C) (A) G (T) C (A) (G) T C A 3' TCACGAGT AGTGCTCA Sequencing multiple polonies Rob Mitra
 A G T (C) (A) G (T) C (A) (G) T C A 3 TCACGAGT AGTGCTCA Sequencing multiple polonies Rob Mitra")
18
Mutiple Image Alignment Metric based on optimal coincidence of high intensity noise pixels over a matrix of local offsets (0.4 pixel precision)
")
19
Polony exclusion principle & Single pixel sequences Mitra & Shendure

20
DNA RNA Proteins Metabolites Replication rate Environment Biosystems Integrating Measures & Models Microbes Cancer & stem cells Darwinian optima In vitro replication Small multicellular organisms RNAi Insertions SNPs interactions

21
Alternatively Spliced Cell Adhesion Molecule Specific variable exons are up-or-down-regulated in various cancers Controversial prospective diagnostic / prognostic marker (>1000 papers) Can full isoforms resolve controversy and/or act as superior markers? Eph4 = murine mammary epthithelial cell line Eph4bDD = stable transfection of Eph4 with MEK-1 (tumorigenic) CD44 Exon Combinatorics (Zhu & Shendure)
 CD44 Exon Combinatorics (Zhu & Shendure).")
22
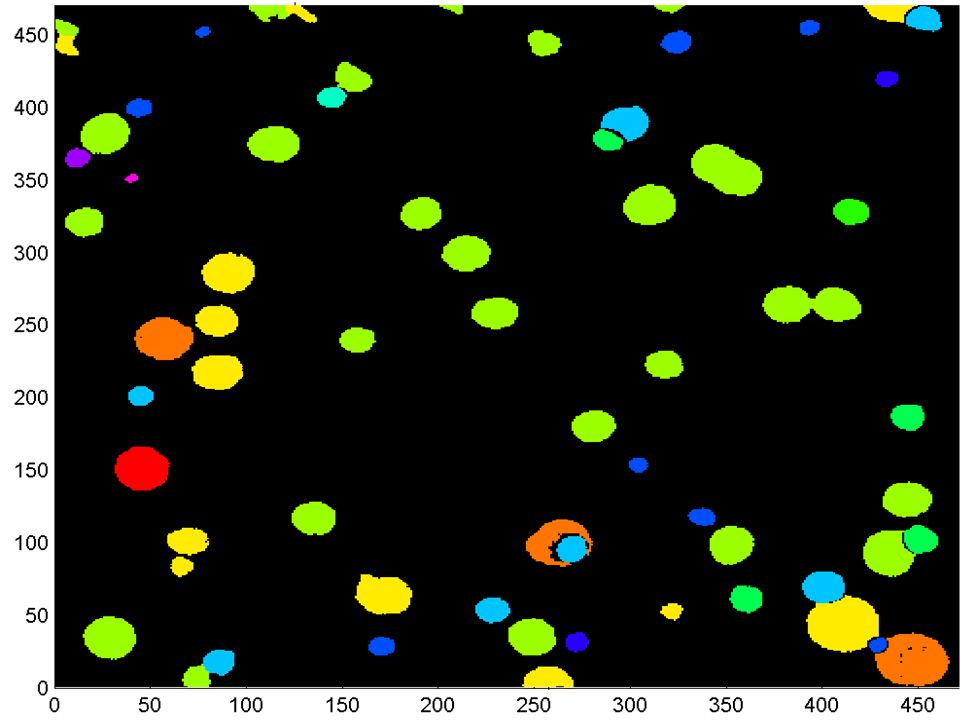
1. Search Signature Image for qualified ‘objects’ a. > 50 connected pixels with same signature value b. ‘solidity’ of > 0.50 c. long axis / short axis ratio < 3 OR a. > 25 connected pixels with same signature value b. ‘solidity’ of > 0.80 c. long axis / short axis ratio < 1.5 2. Search for internal regional maxima within each object (lest two adjacent polonies with same signature get counted as one) 3. Assign centroid locations as qualified individual ‘polonies’ Trial & Error Derived Algorithm for Polony Finding
 3. Assign centroid locations as qualified individual ‘polonies’ Trial & Error Derived Algorithm for Polony Finding.")
24
V1 V2 V3 V4 V5 V6 V7 V8 V9 V10

25
Examples of Counts (isoforms) of 8000 analyzed Jun Zhu
 of 8000 analyzed Jun Zhu")
26
Summary of Counts (isoforms) Jun Zhu Eph4 = murine mammary epthithelial cell line Eph4bDD = stable transfection of Eph4 with MEK-1 (tumorigenic)
 Jun Zhu Eph4 = murine mammary epthithelial cell line Eph4bDD = stable transfection of Eph4 with MEK-1 (tumorigenic)")
27
Polony Flavors 1.Replica Plating of DNA images [Mitra et al. NAR 1999] 2.Long Range Haplotyping [Mitra et al. PNAS 2003] 3.Allelic mRNA Quantitation (HEP) [Mitra et al. 2003] 4.Alternative Splicing Combinatorics [Zhu et al. 2003] 5.Precise SNP-mutant & mRNA ratios [Merrill et al. 2003] 6.Fluor in situ Sequencing (FISSEQ 1) [Mitra et al. 2003] 7.Multiplex Genotyping (ApoE, Hyman, Shendure & Williams) 8.In situ / single-cell extensions of the above (Zhu & Williams)
 [Mitra et al. 2003] 4.Alternative Splicing Combinatorics [Zhu et al. 2003] 5.Precise SNP-mutant & mRNA ratios [Merrill et al. 2003] 6.Fluor in situ Sequencing (FISSEQ 1) [Mitra et al. 2003] 7.Multiplex Genotyping (ApoE, Hyman, Shendure & Williams) 8.In situ / single-cell extensions of the above (Zhu & Williams).")
28
DNA RNA Proteins Metabolites Replication rate Environment Biosystems Integrating Measures & Models Microbes Cancer & stem cells Darwinian optima In vitro replication Small multicellular organisms RNAi Insertions SNPs interactions

29
Link et al. 1997 Electrophoresis 18:1259-313 (Pub) (Pub) Comparison of predicted with observed protein properties (abundance, localization, postsynthetic modifications) E.coli
 (Pub) Comparison of predicted with observed protein properties (abundance, localization, postsynthetic modifications) E.coli.")
30
Circadian Cycle Proteogenomic Map 1/4

31
Circadian Cycle Proteogenomic Map 2/4

32
Circadian Cycle Proteogenomic Map 3/4

33
Circadian Cycle Proteogenomic Map 4/4

34
Numbers on top in basepairs. 1700 ORFs are predicted. Proteomic Model is based on Mass-spectrometry of peptides at 24h time points. DifferenceMap indicates new peptide regions. The 6 colors represent ORFs in the 6 reading frames. (Harvard-MIT GtL: Jaffe, Church, Lindell, Chisholm, et al. ) Circadian &Cell Cycle Proteogenomic Map (zoom)
 Circadian &Cell Cycle Proteogenomic Map (zoom).")
35
Circadian time-series (Prochlorococcus) RNA & protein quantitation: R 2 =.992 R 2 =.635 Linear Regression R 2 =.1 (Harvard-MIT GtL: Jaffe, Church, Lindell, Chisholm, et al. ) RNA (3 AM)
 RNA (3 AM).")
36
DNA RNA Proteins Metabolites Replication rate Environment Biosystems Integrating Measures & Models Microbes Cancer & stem cells Darwinian optima In vitro replication Small multicellular organisms RNAi Insertions SNPs interactions

Similar presentations
 proteome: complete.>")


 Harvard / Wash U George Church, Rob Mitra Greg Porreca, Jay Shendure Sequencing by Ligation on Polony Beads with.>")


 Isolate total RNA Isolate mRNA from total RNA (poly.>")

 Analysis of DNA (Sequencing) Chemical Synthesis of DNA.>")
 Oct 9, 2002 HBS.>")
 5-Jan-2006 HPCGG Landsdowne 2 PM Personal Genomics meets Quantitative Proteomics NHGRI Seq Tech 2004:>")

