Download presentation
Presentation is loading. Please wait.

1
In the U.S. there appears to be something of a correlation between Teenage Birth Rate, and the overall birth rate, but the correlation is not that strong. Justin Domke

2
There was great growth in life expectancy in the first half of the 20 th century, but it appears to be leveling off. Justin Domke

3
Cigarette Smoking According to Gender Although there has been a decrease in cigarette smoking, about 25% of men and 20% of female were current smokes in year 2002.

4
Cigarette Smoking According to Age & Gender (2002) African American females have one of the lowest rate of cigarette smoking. Cigarette smoking decreases as white males get older. African American females have one of the lowest rate of cigarette smoking. Cigarette smoking decreases as white males get older.

5
Cigarette Smoking According to Education (2002) Smoking is highly correlated with educational attainment. Adults with less than high school diploma were 3 times more likely to smoke than those with bachelor’s degree. Smoking is highly correlated with educational attainment. Adults with less than high school diploma were 3 times more likely to smoke than those with bachelor’s degree.

6
Mustafa Bilgic Percentage of women who gave birth Aids Cases Deaths related to motor vehicle related injury

7
Percentage for 20-24, 25-29, and 30-34 dramatically increased, but percentage for 40-44 remained almost constant. So, did the “increased portion” gave birth when they turned 40? Or some other explanation?

8
One wonders what happened between 1985 and 1995, and what changed between 1995 and 2000.

9
Do women drive more safely? Or, is the percentage of women who drive is less? Or do the women drive less on the rush hours? Why is the rate for American Indians is twice and the rate for Asians half as the rate for Whites and African Americans?

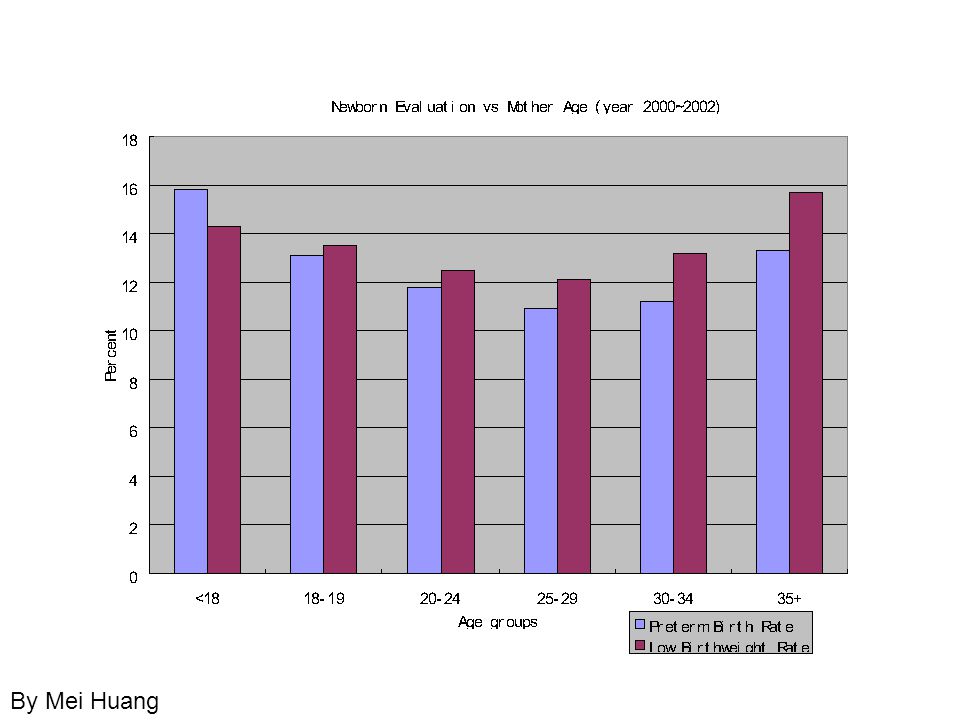
13
By Mei Huang

19
This graph shows the variation in birth rate over the years from 1980 until 1999, separated by age group. The birth rate of 20-29 year olds stays pretty much the same, while that of 30-39 is ever increasing, and the birth rate of 15-19 year olds goes up around 1992 but then lessens once again. The birth rate of women aged 40-44 increases slightly as well. The birth rate of women age 45-54 and 10-14 are so small to see significant change. Louis Licamele

20
The birth rate of women under 20 who are of different races is shown over the last decade. Some obvious differences among and within races can be seen. The birth rate among Asian women under 20 is very small, followed next by White women. The birth rate of Black and Hispanic women are the largest. The birth rate of Black women, which was the largest in the beginning of the decade, has decreased the fastest and has put the birth rate of Hispanic women as the largest towards the end of the decade. The general pattern is that the birth rate in all women under 20 has decreased regardless of race. Louis Licamele

21
Here we can see how the birth rate of women who are age 30 to 54 has changed based on their race over the last decade. The birth rate of Asian women, which was the lowest for under age 20, is now the highest. The birth rate of American Indian and Black women remains rather constant and not that high. Once again the birth rate of Hispanic women is high, as it was for Hispanic women under 20. One distinct anomaly is the sharp increase in birth rates among White women in this age group. One would have to wonder something such as fertility drugs might be playing a role in this change.

22
By Chunyuan Liao

25
Kenny Weiss CMSC 828S Excel Data Visualization NCHS Datasets

26
Life Expectancy for 20th Century Americans Life expectancy has nearly doubled in the last century. Americans now expect to live longer lives than their predecessors. Data Source: www.cdc.gov/nchs/about/major/dvs/mortdata.htm ©Kenny Weisswww.cdc.gov/nchs/about/major/dvs/mortdata.htm

27
Age Distribution in America 1950, 2000 and 2050 The percentage of senior citizens in the population has steadily increased in the past 50 years and is projected to continue increasing. Data Source: ftp://ftp.cdc.gov/pub/Health_Statistics/NCHS/Publications/Health_US/hus04tables/Table027.xls ©Kenny Weissftp://ftp.cdc.gov/pub/Health_Statistics/NCHS/Publications/Health_US/hus04tables/Table027.xls

28
Expected Lifetimes by Gender of Americans in the 20th Century Women continue to live longer than men, but the gap is slowly closing in. Data Source: www.cdc.gov/nchs/about/major/dvs/mortdata.htm ©Kenny Weisswww.cdc.gov/nchs/about/major/dvs/mortdata.htm

29
As Americans age, they increasingly embrace some form of complementary alternative medicine (CAM). However, for most therapy types, usage peaks between the ages of 40 and 60, which then drops off over time. The gap is bridged by the increasingly important role prayer plays in alternative healing for Americans as they age beyond 60. Amy Karlson

30
The likelihood an individual will use a form of comparative alternative medicine (CAM) therapy generally correlates with higher levels of completed education. However, the most widely practiced type of CAM, mind-body therapy, does not follow this trend. People at all levels of education are generally equally likely to practice mind-body therapy, but the less educated the individual, the more likely the practice includes some type of prayer. Amy Karlson

31
Alternative medicine in America is practiced considerably across all races. Taking into account all therapy types, a higher percentage of Black Americans practice alternative forms of healing than individuals of other ethnicities. However, this relative percentage falls below those of other races when Megavitamin and Prayer therapies are removed from consideration, at which point Asian Americans practice CAM at the highest rate. Overall, over one third of the population practices some form of CAM, and if prayer is included, the percentage rises to nearly two-thirds. Amy Karlson

32
United States Mortality Trends 1950 - 2002 Nitin Madnani

33
Overall Mortality Trend Last 50 Years Higher Life Expectancy Lower Death Rates

34
Causes of Mortality Leading causes of death have not changed. Deaths in 2002 Deaths due to all causes except respiratory diseases have declined.

35
Mortality Disparities Number of males dying from leading causes is higher than females. Death rate decreases with increased educational attainment.

39
Total Resident Population of U.S.

40
Resident Population of U.S. Male and Female

41
Resident Population of U.S. According to Age Data

45
Dataset taken from National Vital Statistics Reports, Vol. 52, No. 2, September 15, 2003 Submitted by : Sanket Sinha ssinha@umd.edu

46
Susan Campbell Is there a difference in infant mortality rate based on the mother's age? Yes. The youngest and oldest mothers are most likely to lose children in the first year, and infant mortality is not strictly proportional to total number of children born. General Infant Mortality by Maternal Age

47
Susan Campbell When do expectant mothers start prenatal care? Women of different ages appear to seek prenatal care in different parts of pregnancy. The youngest women appear to be most likely to delay prenatal care, but the pattern differs for different age groups. Gestational age where prenatal care starts

48
Susan Campbell Does prenatal care have a differential effect based on the age of the mother? The previous graph suggests that the youngest mothers tend to get prenatal care later or not at all, and, unfortunately, as shown below, their infants are more likely not to survive if they do not get adequate prenatal care. This data is correlational, but it does suggest that improving access to prenatal care for very young mothers might improve infant mortality rates. Prenatal care and birth outcomes by age

49
Education Attainment Presentation Assignment Jerry Alan Fails

50
Education Attainment on the Rise Education attainment in the United States from 1940 to 2000 for people between the ages of 25 and 34.

51
Education Attainment by Sex Education attainment in the United States from 1940 to 2000 for people between the ages of 25 and 34.

52
Education Attainment by Race Education attainment in the United States from 1940 to 2000 for people between the ages of 25 and 34.

Similar presentations


 White population. According to the U.S. Census Bureau,>")


 Eligible Metropolitan Areas Florida Department of Health HIV/AIDS and Hepatitis Section Division of Disease.>")


. However, for most therapy types, usage peaks between.>")


