Download presentation
Presentation is loading. Please wait.

1
An Internet Tool For Forecasting Land Use Change And Land Degradation In The Mediterranean Region Richard Kingston & Andy Turner University of Leeds UK

2
The presentation Some background The problem Aims and objectives Work packages Building a common spatial framework Land use predictors Building the web interface Conclusions & next stages

3
Background MedAction funded by the EU –Fifth framework program –Key Action 2: Energy, Environment and Sustainable Development Specifically looking at: –Policies for land use to combat desertification http://www.icis.unimaas.nl/medaction/

4
The problem Increasing desertification in the Mediterranean region is having a direct impact upon land use It is largely a society-driven problem combated by various EC agricultural subsidies A lack of coordinated action across the Mediterranean has led to a patchwork of policy actions

5
Overall aims and objectives The EC have decided that we need to: – Develop land use change scenarios at various scales – Analyse effects of past policies in four target areas – Analyse the costs of land degradation and benefits of mitigation measures – Develop options for land use policies, mitigation strategies, and incentives to combat desertification

6
Specific aims and objectives Develop a scenario based integrated land use and land degradation prediction model Develop an interactive internet interface to the modelling system and associated data Encourage experts, policy makers and the public to use the on-line modelling system and develop the way it operates, its functionality and its capabilities based on feedback from these users

7
Work Packages our work

8
Work Package 3.3 Develop an internet interface to an existing stand-alone modelling system that –allows users to select which variables to include –enables them to try out different types of model –search for and evaluate available data with respect to the modelling tasks

9
Previous research Developed a means of estimating the likely impacts of climate change on agricultural land use and land degradation In order to –gain and raise awareness of the problems –inform political and public debate –have a way of contributing to the development of mitigation strategies

10
Previous modelling challenge To predict contemporary agricultural land use based on a range of climatic, physical and socio- economic indicators Forecast the various indicators for some time in the future in order to forecast land use and provide a land use change scenario Translate land use change scenarios into land degradation indicators Combine land degradation indicators to produce a synoptic forecast of land degradation

11
What was required Highest possible level of spatial resolution Complete coverage over the Mediterranean climate region of the EU Produce forecasts for about 50 years hence Base the results on global climate change scenarios Incorporate socio-economic data Produce outputs as maps Provide a modelling framework that could be refined as better data and understanding of the processes is gained something we are doing now

12
Creating the common spatial framework Step 1: Assemble a database of all relevant physical, socio-economic & environmental data Step 2: Model the relationships between land use and other data assembled Step 3: Obtain and make forecasts of the data Step 4: Create and analyse maps of changes Step 5: Translate the changes into land degradation risk indicators Step 6: Repeat forecasting based on different climate change scenarios

13
Assembling the data Decided upon a grid at a 1-decimal-minute resolution with a fixed origin aligned in terms of latitude and longitude covering the entire Mediterranean climate region of the EU Manipulating available source data into the framework involved the use of GIS operations and/or modelling applications –Most environmental data could be manipulated into it in a relatively straight forward manner –BUT... –BUT... socio-economic data need to be interpolated

14
The land use predictors soil type soil quality biomass temperature precipitation height above sea level population density

15
Height above Sea level Climatic Biomass Potential

16
Predicting future land use An example rule If a high proportion of land use estimated/predicted now is arable and a high proportion of estimated/forecast future land use is: arable then land degradation is possible trees then land degradation is unlikely barren then land degradation is serious other land use then land degradation is probable

17
Building a web interface WP 3.3 main aim is to develop a Web interface to the existing stand-alone prototype modelling system –allow the viewing of available input data and existing model results –allow users to alter climate change scenarios and input data and view the effects on land use change and land degradation

18
Work so far On-line data viewer –allows users to view relevant spatial data –meta data Developing web-based GIS –allows users to decide on input variables –model type

19
Step 1: Choose data and view in the on-line map viewer Step 2: Run model choose between model types Step 3: Obtain Results Step 5: Run another scenario? Step 4: Submit Results to policy makes Neural NetFuzzy Logic Satisfied? Not Satisfied?

20
Datasets library Split into –socio-economic land use predictors e.g. distance to nearest built-up area e.g. frequency of night-time lights observation –physical land use predictors e.g. soil type e.g. biomass data

21
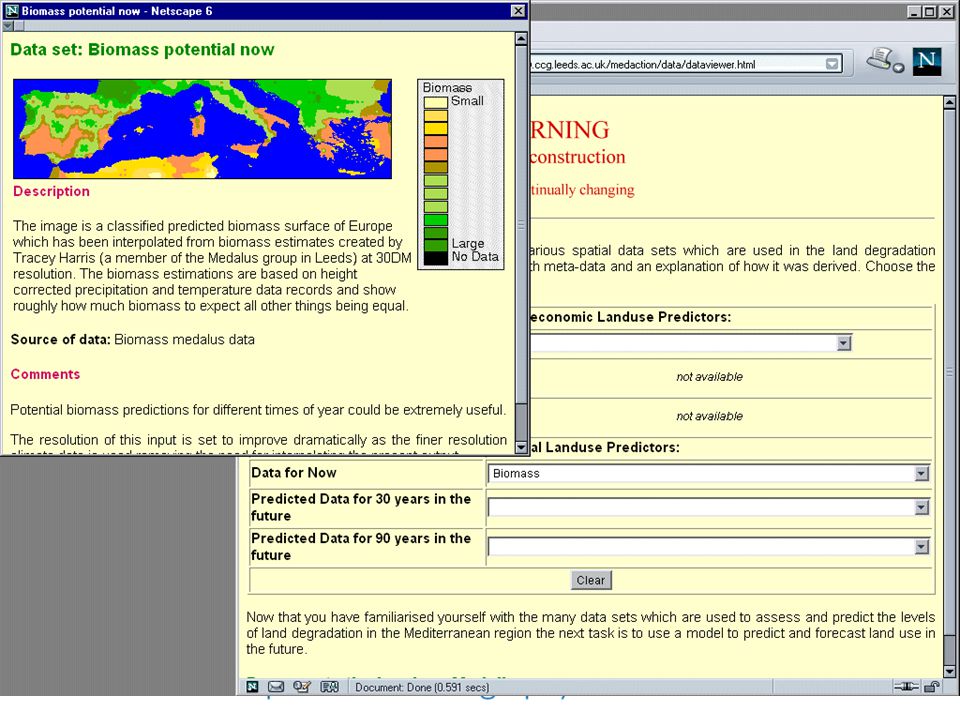
The Data Viewer Extracts relevant gif image and associated meta data –drop down lists of data types –data for now 50 years in the future

23
Web enabled GIS Developing in house GIS –Java based open source –vector and raster capabilities –runs on the Web or stand alone http://mapkenzie.sourceforge.net/

24
The modelling interface After using the data library users then –select which variables to include –enables them to try out different types of model Neural networks for classification Fuzzy logic based for subjective interpretation –view results –re-run with different data-sets and/or models The modelling interface still has to be developed!

25
Here’s an example from some previous work

26
Next stages Update the system with new –socio-economic –environmental –physical data Develop the Web-based interface Develop the modelling system Allow users to add their own data

27
Conclusions This work is still in its early stages Results will only be good enough to enlighten debate – not control policy It is a first step towards providing wider access to land degradation data and models It has the potential to open up the decision making process to those who are interested It provide an example web-based tool for planners, decision makers and citizens interested in visualising the consequences of environmental change

28
Further details MedAction http://www.ccg.leeds.ac.uk/medaction/ richard@geog.leeds.ac.uk a.turner@geog.leeds.ac.uk Java GIS http://geotools.sourceforge.net/ http://mapkenzie.sourceforge.net/ Other examples http:/www.ccg.leeds.ac.uk/atomic/

Similar presentations


 ENVIROGRIDS Building Capacity for a Black Sea Catchment Observation and Assessment (Environment)>")
 projections Olivier Crespo Thanks to M. Tadross Climate Systems Analysis Group University.>")


