Download presentation
Presentation is loading. Please wait.

1
©EGEA 2006 Burda, WyploszMACROECONOMIA: UNA PROSPETTIVA EUROPEA Capitolo 11 Prodotto, Occupazione e Prezzi

2
©EGEA 2006 Burda, WyploszMACROECONOMIA: UNA PROSPETTIVA EUROPEA Figure 11.1 Equilibrio generale Fig. 11.01

3
©EGEA 2006 Burda, WyploszMACROECONOMIA: UNA PROSPETTIVA EUROPEA Figure 11.1 Output Interest rate IS Equilibrium in the goods market Changes in output will occur when we are not on the IS curve (as response to shortage to the left of IS and surplus to the right). Fig. 11.01

4
©EGEA 2006 Burda, WyploszMACROECONOMIA: UNA PROSPETTIVA EUROPEA Figure 11.1 Interest rate LM Equilibrium in the money market Changes in the interest rate will occur when we are not on the LM curve. Below LM there is an excess demand for money (bonds chase money). Above the LM there is an excess supply of money (money chases bonds). Output Fig. 11.01
. Above the LM there is an excess supply of money (money chases bonds). Output Fig")
5
©EGEA 2006 Burda, WyploszMACROECONOMIA: UNA PROSPETTIVA EUROPEA Figure 11.1 Interest rate General equilibrium LM IS A Output Y1Y1 Fig. 11.01

6
©EGEA 2006 Burda, WyploszMACROECONOMIA: UNA PROSPETTIVA EUROPEA Figure 11.2 Output and employment Fig. 11.02

7
©EGEA 2006 Burda, WyploszMACROECONOMIA: UNA PROSPETTIVA EUROPEA Figure 11.2 Output Labour Real wage Labour (b) Goods production Output and employment (a) Labour market A Fig. 11.02

8
©EGEA 2006 Burda, WyploszMACROECONOMIA: UNA PROSPETTIVA EUROPEA Figure 11.3 General equilibrium Fig. 11.03

9
©EGEA 2006 Burda, WyploszMACROECONOMIA: UNA PROSPETTIVA EUROPEA Figure 11.3 Output Desired demand Interest rate Output (c) (d) Employ- ment Real wage Output (b) (a) Equilibrium in the goods market Warning: the axes have been switched from the original 45° diagram! Fig. 11.03

10
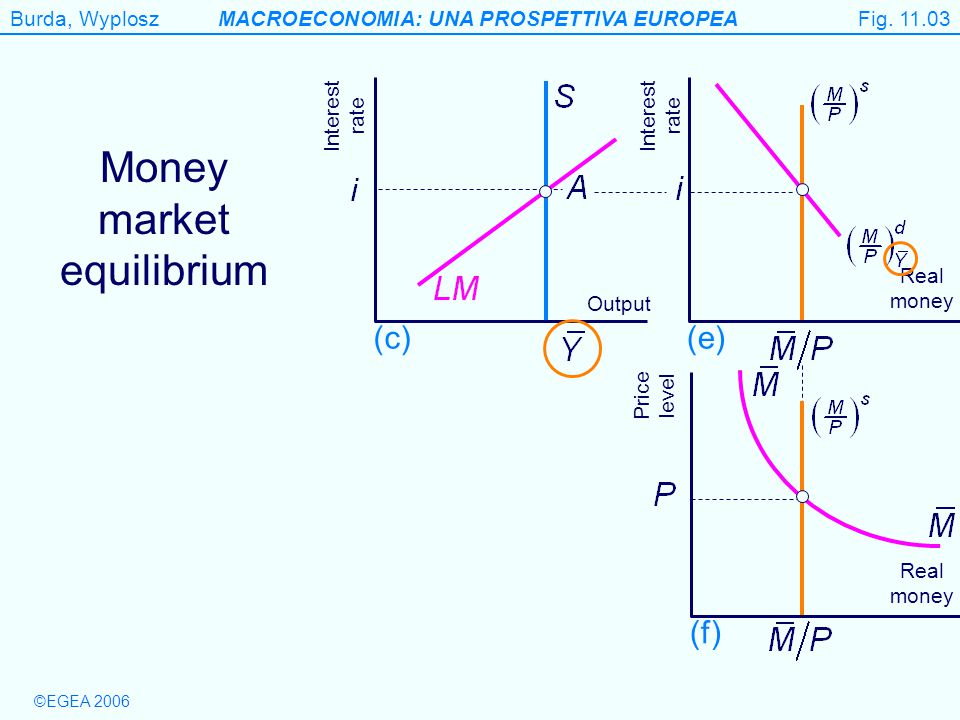
©EGEA 2006 Burda, WyploszMACROECONOMIA: UNA PROSPETTIVA EUROPEA Figure 11.3 Real money Interest rate (e) Price level Real money (f) Money market equilibrium Interest rate Output (c) Fig. 11.03
11
©EGEA 2006 Burda, WyploszMACROECONOMIA: UNA PROSPETTIVA EUROPEA Figure 11.3 Real money Interest rate (e) Price level Real money (f) Real wage Employ- ment (a) Output Employ- ment (b) Output Desired demand (d) Interest rate Output (c) Now….general equilibrium! Fig. 11.03

12
©EGEA 2006 Burda, WyploszMACROECONOMIA: UNA PROSPETTIVA EUROPEA Figure 11.4 The role of the price level Fig. 11.04

13
©EGEA 2006 Burda, WyploszMACROECONOMIA: UNA PROSPETTIVA EUROPEA Figure 11.4 Real money Interest rate Price level Real money (e) (f) Real wage Employ- ment Output Employ- ment (b) (a) Output Desired demand Interest rate Output (c) (d) Determining equilibrium Y and i Fig. 11.04

14
©EGEA 2006 Burda, WyploszMACROECONOMIA: UNA PROSPETTIVA EUROPEA Figure 11.4 Real money Interest rate Price level Real money (e) (f) Real wage Employ- ment Output Employ- ment (b) (a) Output Desired demand Interest rate Output (c) (d) What happens, if P is “too” high? Fig. 11.04

15
©EGEA 2006 Burda, WyploszMACROECONOMIA: UNA PROSPETTIVA EUROPEA Output Desired demand Interest rate Output (c) (d) Figure 11.4 Real money Interest rate Price level Real money (e) (f) Real wage Employ- ment Output Employ- ment (b) (a) With low output, P falls... Fig. 11.04

16
©EGEA 2006 Burda, WyploszMACROECONOMIA: UNA PROSPETTIVA EUROPEA Output Desired demand Interest rate Output (c) (d) Figure 11.4 Real money Interest rate Price level Real money (e) (f) Real wage Employ- ment Output Employ- ment (b) (a) When P´´ is “too low”... Fig. 11.04

17
©EGEA 2006 Burda, WyploszMACROECONOMIA: UNA PROSPETTIVA EUROPEA Figure 11.5 Monetary neutrality Fig. 11.05

18
©EGEA 2006 Burda, WyploszMACROECONOMIA: UNA PROSPETTIVA EUROPEA Figure 11.5 Real money Interest rate Price level Real money Real wage Employ- ment Output Employ- ment Output Desired demand Interest rate Output (c)(e) (b)(d)(f) (a) Proportional changes in P and M. Fig. 11.05

19
©EGEA 2006 Burda, WyploszMACROECONOMIA: UNA PROSPETTIVA EUROPEA Figure 11.6 Sticky price equilibrium Fig. 11.06

20
©EGEA 2006 Burda, WyploszMACROECONOMIA: UNA PROSPETTIVA EUROPEA Figure 11.6 Real money Interest rate (e) Price level Real money (f) Real wage Employ- ment (a) Output Employ- ment (b) Output Desired demand (d) Interest rate Output (c) Output for labour market equilibrium Fig. 11.06

21
©EGEA 2006 Burda, WyploszMACROECONOMIA: UNA PROSPETTIVA EUROPEA Figure 11.6 Real money Interest rate (e) Price level Real money (f) Real wage Employ- ment (a) Output Employ- ment (b) Output Desired demand (d) Interest rate Output (c) P is high, M/P is low and i is high. Fig. 11.06

22
©EGEA 2006 Burda, WyploszMACROECONOMIA: UNA PROSPETTIVA EUROPEA Figure 11.6 Real money Interest rate Price level Real money Real wage Employ- ment Output Employ- ment Output Desired demand Interest rate Output (c)(e) (b)(d)(f) (a) Low Y means low L too. Fig. 11.06

23
©EGEA 2006 Burda, WyploszMACROECONOMIA: UNA PROSPETTIVA EUROPEA Figure 11.6 Real money Interest rate Price level Real money Real wage Employ- ment Output Employ- ment Output Desired demand Interest rate Output (c)(e) (b)(d)(f) (a) MPL > w between C and D, e.g. B Fig. 11.06

24
©EGEA 2006 Burda, WyploszMACROECONOMIA: UNA PROSPETTIVA EUROPEA Figure 11.7 Monetary neutrality fails when the price level is fixed Fig. 11.07

25
©EGEA 2006 Burda, WyploszMACROECONOMIA: UNA PROSPETTIVA EUROPEA Figure 11.7 LM IS Monetary neutrality fails if the price level is fixed LM´ A´ M/P will change with a change in M since P by assumption is fixed! Interest rate Output Fig. 11.07 A

Similar presentations


>")
 Price level = P = (1+ )W So P = P e (1+ ) F (u,z)>")
, and of normal and inferior goods (p. 72).>")
