Download presentation
Presentation is loading. Please wait.

1
Simulation/theory With modest marker spacing in a human study, LOD of 3 is 9% likely to be a false positive.

2
Not even counting recombinants AAbb aaBB AaBb Flower color inter-mate Two loci. Need one dominant allele at each locus to get phenotype. AABb AaBb aaBbAaBB aaBB Aabb Genotype at marker close to A locus purplewhite Top allele 31 Bottom allele 23 NOT complete co- inheritance.

3
Affected sib pair method 2,22,3 2,2 4,41,3 1,4 … Sib pairsObserved Expected under null Same allele 2(1/2)*2 Different allele 0(1/2)*2 Doesn’t require you to know dominant or recessive; doesn’t require large pedigrees. Model-free (a good thing).
..")
4
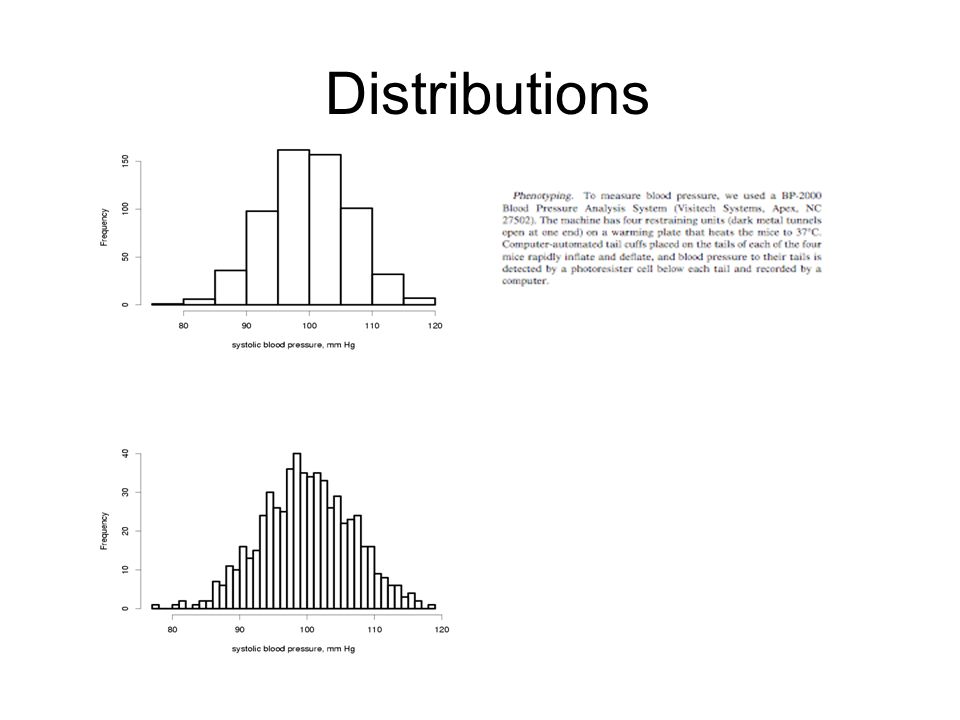
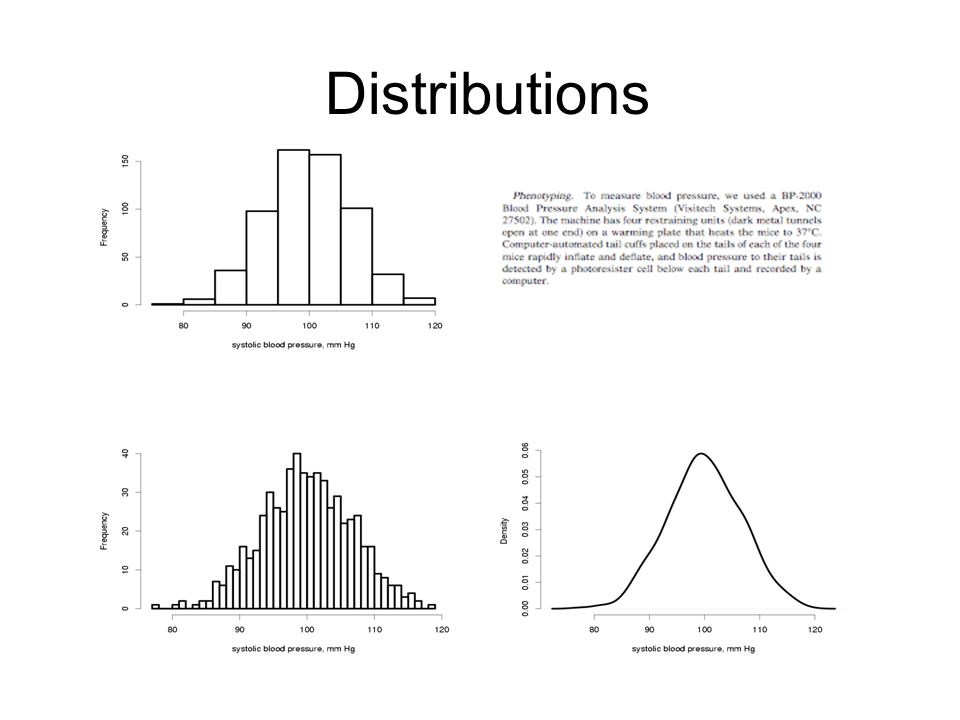
www.jax.org/staff/churchill/labsite/pubs/qtl.pdf Unlike cystic fibrosis and Huntington’s disease, most traits are not yes-or-no. E.g. blood pressure.

5
Distributions

8
Environment and error

9
What if… Salt water Plain water

10
What if… Exact same mouse, every day for 6 mo

11
What if… Exact same mouse, every day for 6 mo Time of day Change in cage-mates Age Reproductive cycle …

12
What if… Many clones/identical twins

13
What if… Many clones/identical twins Time of day Change in cage-mates Age Reproductive cycle … “Experimental error” + random variation

14
Imagine a cross: AA x aa Aa (F1) Aa x Aa AA Aa aA aa (F2)
 Aa x Aa AA Aa aA aa (F2)")
15
Single-locus, dominant (F2’s)
")
16
Single-locus, dominant 75%25% (F2’s)
")
17
Single-locus, dominant 75%25% Aa aA AA aa (F2’s)
")
18
Single-locus, dominant 75%25% Aa aA AA aa (F2’s) A given genotype does not guarantee exactly the same phenotype every time.
 A given genotype does not guarantee exactly the same phenotype every time.")
19
More generally: AA x BB AB (F1) AB x AB AA AB BA BB (F2)
 AB x AB AA AB BA BB (F2)")
20
1 locus, ?

21
25% 50%25%

22
1 locus, ? AA AB BA BB 25% 50%25%

23
1 locus, incomplete dominance AA AB BA BB 25% 50%25%

24
1 locus, incomplete dominance AA AB BA BB 25% 50%25% Remember? Fig. 3.2

25
AA AB BA BB 25% 50%25% AA AB BA BB Another representation

26
25% 50%25% AA AB BA BB AA AB BA BB “Effect of having a B” 1 locus, incomplete dominance

27
25% 50%25% “Effect of having a B” AA AB BA BB AA AB BA BB 1 locus, incomplete dominance

28
25% 50%25% “Effect of having a B” AA AB BA BB AA AB BA BB Effect of a B allele is the same regardless of genotype: additive 1 locus, incomplete dominance

29
1 locus, complete dominance 75%25% AB BA AA BB

30
1 locus, complete dominance 75%25% AB BA AA BB

31
1 locus, complete dominance 75%25% AB BA AA BB Dominance is a kind of epistasis: nonadditive

32
All these are examples of a single locus controlling variation in a quantitative trait. But usually…more complicated.

33
A real example (F2’s) CC x SS CS CS x CS CC SS CS SC (F2’s)
 CC x SS CS CS x CS CC SS CS SC (F2’s)")
34
A real example (F2’s)
")
35
A real example C3H parent (F2’s)
")
36
A real example SWR parentC3H parent (F2’s)
")
37
Not 1-locus dominant, or 1-locus incomplete dominance, or… SWR parentC3H parent (F2’s) Doesn’t look like this…
 Doesn’t look like this…")
38
Test for linkage to markers, to find unknown genetic determinants, as before.

39
Mechanics of test are different.

40
Quantitative trait linkage test Inheritance at a marker (F2’s)
")
41
Quantitative trait linkage test Alleles are named after parent! (F2’s)
")
42
Quantitative trait linkage test Mean BP across all F2’s that carry two SWR alleles at marker (F2’s)
")
43
Quantitative trait linkage test (F2’s) Mean BP across all F2’s that carry two C3H alleles at marker
 Mean BP across all F2’s that carry two C3H alleles at marker")
44
Quantitative trait linkage test (F2’s) Not counting recombinants. Statistical test for goodness of fit.

45
Locus effect vs. parents C3H parent F2’s, C/C at marker F2’s, C/S at marker F2’s, S/S at marker SWR parent Alleles are named after parent!

46
Locus effect vs. parents C3H parent F2’s, C/C at marker F2’s, C/S at marker F2’s, S/S at marker SWR parent Locus effect (F2’s split out by genotype)
.")
47
Locus effect vs. parents C3H parent F2’s, C/C at marker F2’s, C/S at marker F2’s, S/S at marker SWR parent Each parent strain

48
Locus effect vs. parents C3H parent F2’s, C/C at marker F2’s, C/S at marker F2’s, S/S at marker SWR parent Homozygotes do not look like parent.

49
Locus effect vs. parents C3H parent F2’s, C/C at marker F2’s, C/S at marker F2’s, S/S at marker SWR parent Homozygotes do not look like parent. What do you infer?

50
Locus effect vs. parents C3H parent F2’s, C/C at marker F2’s, C/S at marker F2’s, S/S at marker SWR parent Homozygotes do not look like parent. What do you infer? A single varying locus does not explain the data

51
>1 locus controlling trait (One mouse family)
")
52
What if… C3H parent F2’s, C/C at marker F2’s, C/S at marker F2’s, S/S at marker SWR parent Magnitude of error bars (spread within group) has not changed. Locus effect is weaker.

53
Correct interpretation: C3H parent F2’s, C/C at marker F2’s, C/S at marker F2’s, S/S at marker SWR parent Difference between S and C at this locus has a causal role in blood pressure variation, but effect is modest.

54
Correct interpretation: C3H parent F2’s, C/C at marker F2’s, C/S at marker F2’s, S/S at marker SWR parent Difference between S and C at this locus has a causal role in blood pressure variation, but effect is modest. “Effect of having an S allele”

55
Correct interpretation: C3H parent F2’s, C/C at marker F2’s, C/S at marker F2’s, S/S at marker SWR parent Most loci underlying human disease look like this. “Effect of having an S allele”

56
Complex traits (one family, mouse model)
")
57
Complex traits (one family, mouse model)
")
58
Complex traits Genetic differences at both loci affect the trait (one family, mouse model)
")
59
Complex traits Each locus responsible for half? (one family, mouse model)
")
60
Complex traits Each locus responsible for half? Depends on the model. (one family, mouse model)
")
61
Complex traits (one family, mouse model)
")
62
Complex traits (one family, mouse model) Each locus responsible for a third?
 Each locus responsible for a third")
63
Complex traits If 5 loci, each responsible for a fifth? 10 loci? … The more loci, the smaller the effects and the harder to detect.

64
Complex traits Genetic complexity is the rule; simple 1- or 2-locus models are the exception One common result of a linkage study is no significant linkage anywhere.

65
We haven’t talked about humans lately… With model organisms, can always study a single cross/family with lots of progeny, so better statistical power to detect weak loci. And less chance of locus heterogeneity.

66
New York Times, Nov. 11, 2007

67
Companies offering the service

68
Can knowing your inheritance at SNPs predict your disease risk?

Similar presentations


 2. Practicing with Chi Square Analysis (Part 2) 3. Thinking About Genetics and Agriculture.>")
