Download presentation
Presentation is loading. Please wait.

1
Dose Reduction in MDCT: Technique + Technology
William P. Shuman MD, FACR Department of Radiology University of Washington

2
Conflict of Interest Statement
I administer a grant from GE Healthcare which supports clinical investigation of cardiac CT. No support for equipment or salaries

3
Acknowledgements I thank my colleagues Dr. Kalpana Kanal, Dr. Lee Mitsumori, and Dr. Paul Kinahan for their input. I also thank Dr. Joel Platt of the University of Michigan for some of the image slides.

4
Radiation Induced Risk
Heritable genetic Developmental fetus Cancer linear non threshold model A-Bomb data (150 mSv), dirty radiation
, dirty radiation.")
5
Radiation exposure to US population
Medical 0.54 mSv per capita Total 3.6 mSv per capita Medical 3.0 mSv per capita Total 6.2 mSv per capita © UW and Kalpana M. Kanal, PhD, DABR K Kanal

6
Effective Dose Contributions
Medical Exposure 1990 2007 Effective Dose Contributions © UW and Kalpana M. Kanal, PhD, DABR slide courtesy: Dr M. Mahesh, Johns Hopkins

7
Background vs. Medical Radiation
Now about equal: 3m Sv 1/2 medical radiation from CT

8
Dramatic Growth in CT 1990 - 13 million CT scans

9
Arch Intern Med 169; Dec, 2009 (p.2071)
Insurance Claims Data

10
Projected Risks from CT
70 milion CT’s done in 2007 29,000 future cancers could result Biggest contributors: CT of Abdom and Pel CT of chest CT of head CT pulmonary angio for PE

11
Projected Risks from CT
One third in pts. betw. 35 and 54 15% younger than 18 66% in females Some scans up to 50 mSv Conclusion: Large contributions to total cancer risk Dose reduction efforts warranted

12
Arch Intern Med 169 ; Dec, 2009 (p.2078)
")
13
Radiation Dose Assoc. with CT
1119 consec. scans in 4 SF hosp’s Dose varied widely within and among instituitions for similar exams. Up to 13-fold variation 1 / 270 women Cor. CT age 40 - Cancer 1 / Head CT:

14
Radiation Dose Assoc. with CT
For 20 y/o risks doubled CT radiation doses are higher and more variable than usually quoted Greater monitoring / standardization needed

15
Arch Intern Med 169; Dec, 2009 (p.2049)
")
16
Editorial: Cancer Risks and CT
Of 72 million scans, 2% were high dose: mSv From CT scans performed in 2007, 15,000 deaths from induced CA “Public Health Time Bomb…” What to do?

17
Editorial: Cancer Risks and CT
Improve protocols and standardization Get rid of 13 fold variation Lower dose per scan significantly Inform Pts. About radiation risk 1 CT = 300 CXR’s

18
CBS Evening News with Katie Couric (12/14/09)
“CT Scans Harmful”?

19
Seattle Times 12/15/09 (p.A12 in print)
")
20
CT scans raise risk of cancer, report cautions
N Eng J Med 2007, 357: Thursday, November 29, 2007 CT scans raise risk of cancer, report cautions Millions of Americans, especially children, are needlessly getting dangerous radiation from "super X-rays" that increase the risk of cancer... © UW and Kalpana M. Kanal, PhD, DABR

21
Relative Risk from a CT To individual:
Lifetime risk of cancer: 25% (1 in 4 ) Added risk: 0.05% (1 in ) To population: 62M CT scans year in USA Without CT: M will die of cancer With CT: M will die of cancer (additional 31K)
 Added risk: 0.05% (1 in ) To population: 62M CT scans year in USA. Without CT: M will die of cancer. With CT: M will die of cancer. (additional 31K)")
22
CT Radiation Increasing
% of cancers in US from CT Physicians are uninformed on risks 3 steps to improve: Optimize each CT for dose Alternatives to CT when possible Appropriateness of each CT Brenner et al, NEJM 2007

23
Overuse of CT in Some Patients
15% had more than 100 mSv Follow up CT Stone CT CT Enterography Rule out PE Sodickson et al, Radiology 2009

24
CT Risk vs. Benefit If CT is felt to be medically necessary, radiation risk is both accepted and minimized

25
What Shoud Radiology Do ??
Leadship in: Dose Awareness Dose Reduction

26
Dose Awareness Education Publish dose of each exam
All in Radiology Dept. All Referrers Publish dose of each exam Put in report + med. Record ? National Registry Monitor exam doses regularly

27
CT Dose Reduction The Easy Stuff: Control Z axis scan length
Minimize number of phases Externally applied body shields Noise reduction filters

28
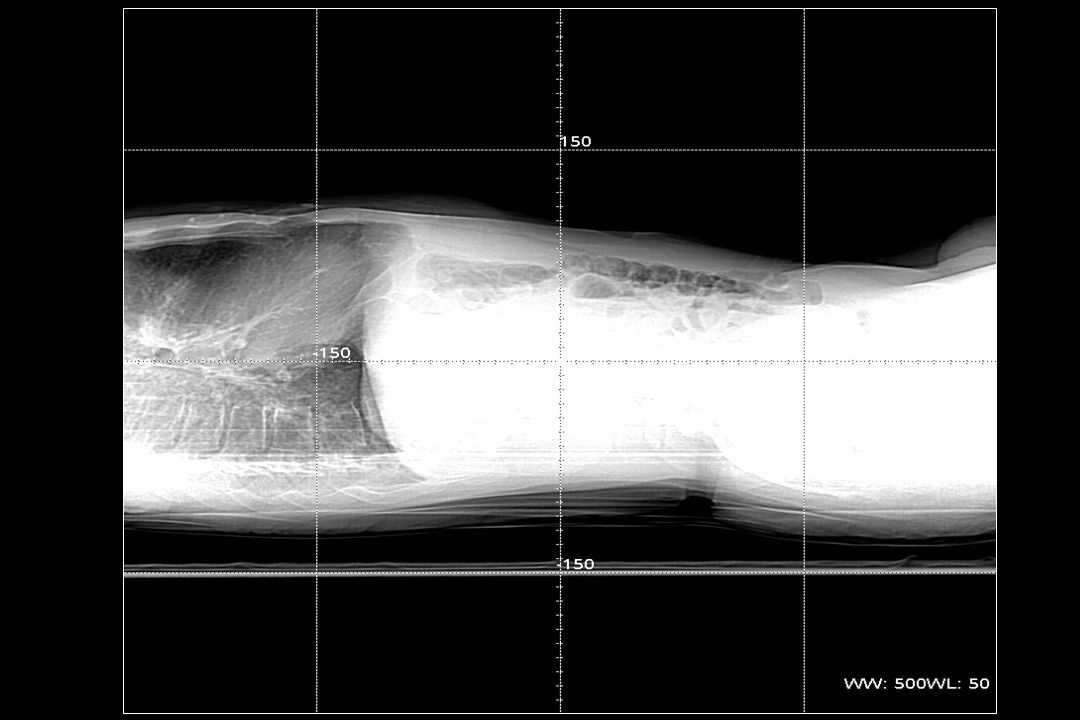
Control Z-Axis Z-axis length creep “Throw in” a chest or pelvis
Regions of overlap Neck/chest Lower chest/upper abdomen

29
Control Z Axis: Shrink to Fit Pt.
Challenge your technologists Control patient breathing and moving Especially avoid breast or pelvis

30
Minimize Number of Phases Used
Limit to only needed: 4 phase liver vs. 3 phase Use new protocols: CTU – split bolus

31
Externally Applied Shields
Breast Gonadal (males) Thyroid
 Thyroid.")
32
Breast Shield Bismuth shield Decreases breast dose Up to 40% ( ! )
")
33
Breast Shield Increased noise in ant. chest Proper positioning:
Slight stand off from chest (blanket) All females age
 All females age")
34
Breast shield with air gap

35
Gonadal Shield Breast shield with air gap

36
Thyroid Shield Breast shield with air gap

37
Dose Reduction Techniques: Filters
Specialized Noise Reduction Filters General noise reduction filter: thin sliced acquisitions for neuro 3D modes such as reformat or MIP Cardiac noise reduction filters Filters will allow for an estimated reduction exceeding 30% Most other manufacturers have noise reduction filters as well. IQ Enhance (where applicable) Cardiac noise reducing and edge preserving filters C1, C2, or C3 are available for Cardiac helical exams. These filters allow you to reduce the dose up to 30% on top of ECG modulation dose reduction while preserving the same image quality Some manufacturers call them adaptive filters.
 Cardiac noise reducing and edge preserving filters C1, C2, or C3 are available for Cardiac helical exams. These filters allow you to reduce the dose up to 30% on top of ECG modulation dose reduction while preserving the same image quality. Some manufacturers call them adaptive filters.")
38
Dose Reduction Techniques: Filters
The bow-tie filter : graphite that sits between the X-ray tube and patient Results in reduction in CT dose.

39
Dose Reduction Techniques: Penumbra
Unused X-ray (penumbra) 70 % 95% Wider beam coverage improves Z axis dose efficiency . Umbra is the used radiation. The Z axis dose efficiency an indicator of how much beam falls off the ends of the detector. In a single slice system, the slice profile is determined by a source collimator and the detector intercepts all of the beam. Hence, the dose efficiency is 100%. Note that the wider slices are more dose efficient. Beam tracking keeps the collimated beam centered over the over the detector to minimize penumbra a lower dose will be delivered if you Rx using 20mm collimation vs 10 mm for a head ie., As the length of the area to be scanned increases (to about 300mm), this will diminish. 10 mm width 70% of beam utilized 40 mm width 95% of beam utilized
 70 % 95% Wider beam coverage improves Z axis dose efficiency. . Umbra is the used radiation. The Z axis dose efficiency an indicator of how much beam falls off the ends of the detector. In a single slice system, the slice profile is determined by a source collimator and the detector intercepts all of the beam. Hence, the dose efficiency is 100%. Note that the wider slices are more dose efficient. Beam tracking keeps the collimated beam centered over the over the detector to minimize penumbra. a lower dose will be delivered if you Rx using 20mm collimation vs 10 mm for a head ie., As the length of the area to be scanned increases (to about 300mm), this will diminish. 10 mm width. 70% of beam utilized. 40 mm width. 95% of beam utilized.")
40
Dose Reduction: Technique
Noise index and Automatic Tube Current Modulation (ATCM) for mA kVp and body size Rotation time Centering
 for mA. kVp and body size. Rotation time. Centering.")
41
CT Dose and Image Quality
How do we balance ?? What are the trade offs ??

42
Dose Too Low (noise!)
")
43
Dose Too High (looks too good !)
Even thins look good –overdosed ?

44
Dose and mA Linear relationship Decrease mA to reduce dose linearly
mAs incorporates gantry rotation time

45
Tube Current mA Modulation
Fixed tube current Modulated tube current XY modulation Z modulation XYZ Automated Modulation (ATCM) Noise index
 Noise index.")
46
Automated Tube Current Modulation
Based on density in AP and Lat scouts Patient dose controlled not by mA but by manual setting of the Noise Index Standard deviation of the image noise

47
Image Quality: Noise Noise index (NI) Vendor specific term
Standard deviation of CT numbers within a ROI in a water phantom Vendor specific term Typical NI: High NI (low dose):
:")
48
The Physics

49
Department of Radiology University of Washington
Development of a Noise Index Table Demonstrating Interrelationships Among Noise Level, Reconstruction Slice Thickness, and Radiation Dose in 64-slice CT Kalpana M. Kanal, PhD, Brent K. Stewart, PhD, Orpheus Kolokythas MD, William P. Shuman, MD Department of Radiology University of Washington SCBT/MR Scientific Session, 2006; AJR 2008

51
ATCM: Not Entirely Automatic
Based on density in AP and Lat scouts Patient centering during scouts is critical Vertical offset can increased average tube current a lot Matsubara et al, AJR 2009

52
Patient Centering: Image Noise in ATCM
SD noise inc mA boost Cent’d % 0% 4 cm % 68% 6 cm % 100% Elevated 4 cm Elevated 6 cm Centered J. Platt

55
Standardize Image Quality: NI
Lower NI for smaller patients (30) FOV < 34, BMI < 25 Mid Range NI (36) FOV 34 – 44, BMI 25-35 Higher NI for larger patients (40) FOV > 44, BMI > 35
 FOV < 34, BMI < 25. Mid Range NI (36) FOV 34 – 44, BMI Higher NI for larger patients (40) FOV > 44, BMI > 35.")
56
BEWARE: This Can Be a 50 mSv Exam

57
Large Patient: Accept NI = 40
Large patient- DFOV 50 more than 350 lbs but with larger tube and ASiR looks great

58
kVp and Dose kVp→ exponential impact on dose
120 to 100 kV → 43% decrease in dose 120 to 80 kV → 70% decrease in dose Variable: patient size/density

59
Iodine K Edge Iodine K edge : 33 Kev (70 kVp)
Benefit in vascular imaging Lower kV = better iodine conspicuity Endoleak, CT Angio

60
Renal donor Becker 39384942 100 KV- very low dose but nice study DLP 260
J. Platt

61
100 kV Scanning: Small Patients
Decreases dose 43% BMI < 25, weight < 160 lbs. May need to increase mA or decrease NI Himes kV Aorta on 425 lb patient– 140 makes axials look good but aorta but may be less bright DLP 2600

62
140 kVp Scanning: Large Patients ?
Very high dose Use only in unusual cases Techs must get radiologist’s permission to use 140 kVp Himes kV Aorta on 425 lb patient– 140 makes axials look good but aorta but may be less bright DLP 2600 50 mSv !

63
Rotation Time and Dose Linear direct relationship
Decrease in time = decrease in dose 0.35 vs sec

64
Dose Reduction: Technology
Cardiac CT: Dose control techniques Adaptive Statistical Iterative Reconstruction (ASIR): the Theory ASIR: The Practice How we started Evolution of ASIR practice Cardiac ASIR ASIR: The Impact
: the Theory. ASIR: The Practice. How we started. Evolution of ASIR practice. Cardiac ASIR. ASIR: The Impact.")
65
Effective Dose MilliSieverts (mSv)
Risk from tissue exposure to radiation Gender Age Modeling and estimates For a population not one person

66
Effective Dose Calculating effective dose from DLP Use a multiplier:
Region mSv Head Chest Abdomen Pelvis

67
Effective Dose Example: If a chest CT has a DLP of 350 mGy
effective dose is - 350 X = 5.9 mSv

68
mSv Range for Body CT Chest: Abdomen Abdomen + Pelvis 7 – 18 mSv
12 – 36 mSv cardiac Abdomen 10 – 14 mSv Abdomen + Pelvis 15 – 35 mSv

69
Cardiac CT: A High Dose Exam ?
Reported doses vary from 1 – 36 mSv Low pitch ( ) High mA Long Z axis (triple rule out) What can be done to control dose in cardiac scanning??
 High mA. Long Z axis (triple rule out) What can be done to control dose in cardiac scanning")
72
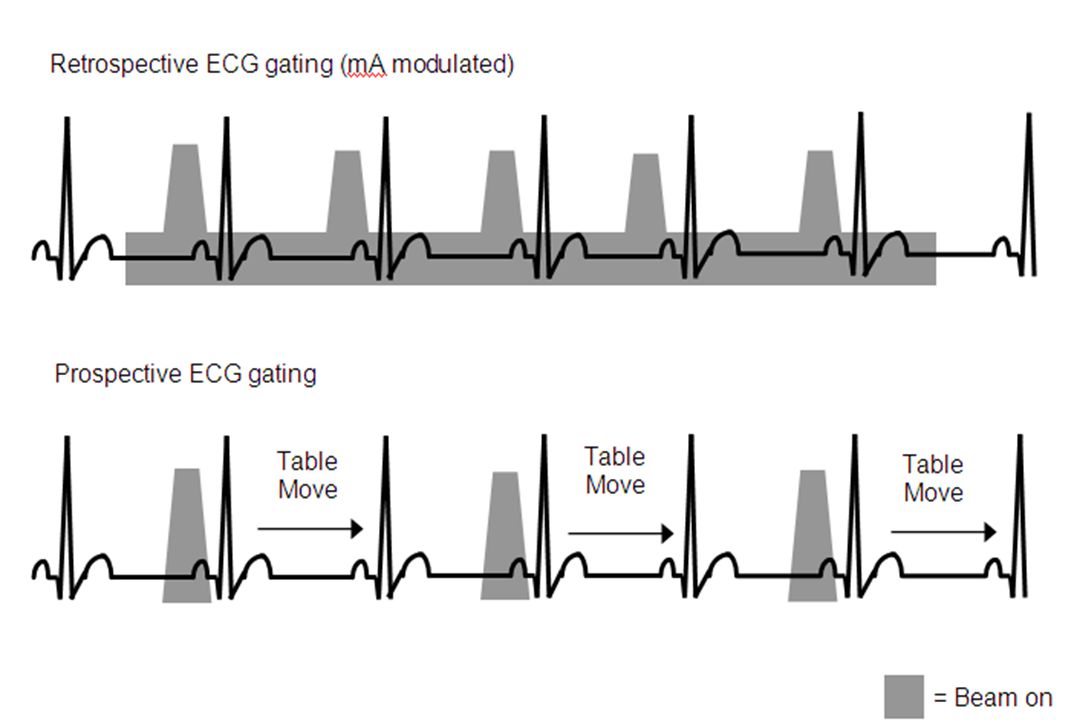
Cardiac Prospective Triggering
Earls, JP, et al. Radiology 2008; 246:742 Prospective triggering vs. Retrospective Gating 84 RG, 121 PG, not matched PG – 83% dose reduction; statistically significant improvement in image quality

73
Cardiac Prospective Triggering
Shuman, et al. Radiology, August 2008 Prospective vs. Retrospective Gating 50 RG, 50 PG, matched for clinical features PG – 77% dose reduction; statistically identical image quality

76
Prospective vs. Retrospective
Fact of Life: Prospective triggering only works at regular heart rates below 75 BPM Requires Beta blockers in most patients

77
Prospective vs. Retrospective
Fact of Life: Prospective gating only images 20% of the R-R interval, so functional information about heart motion, ejection fraction, valve motion, and wall thickening is not produced. Usually only need functional info in patients with known heart disease.

82
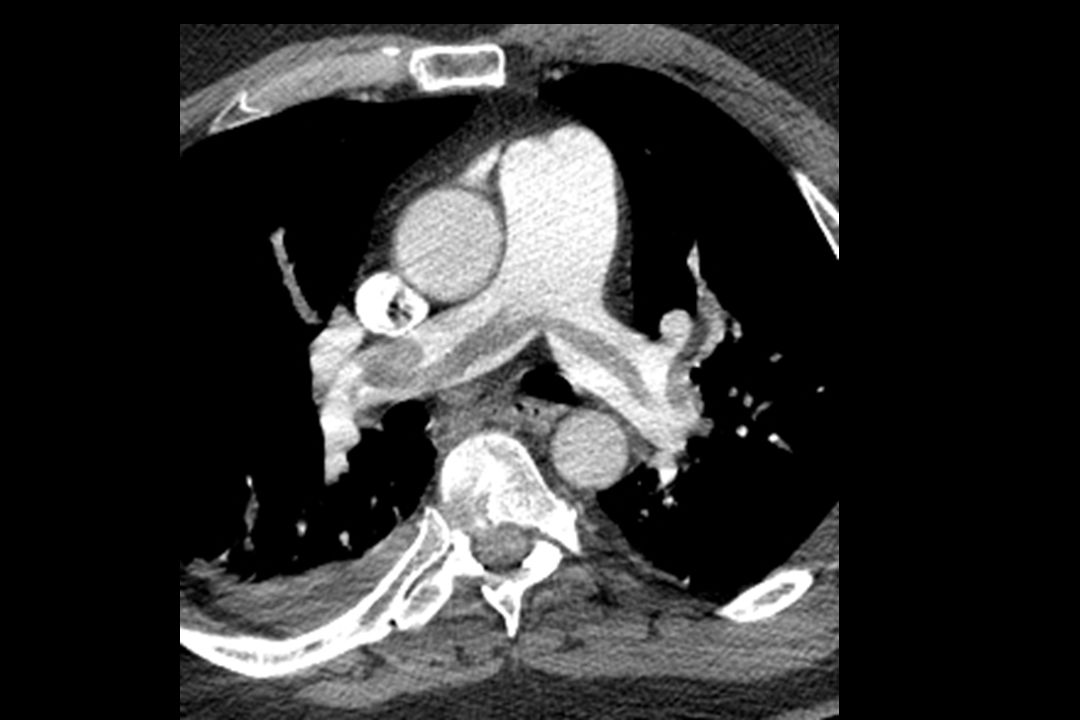
Dose from Whole Chest CT
Shuman, et al. AJR , June 2009 TRO Whole-Chest Long Z-Axis Prospective vs. Retrospective 41 RG, 31 PT, matched for clinical features PG – 71% dose reduction; statistically superior image quality

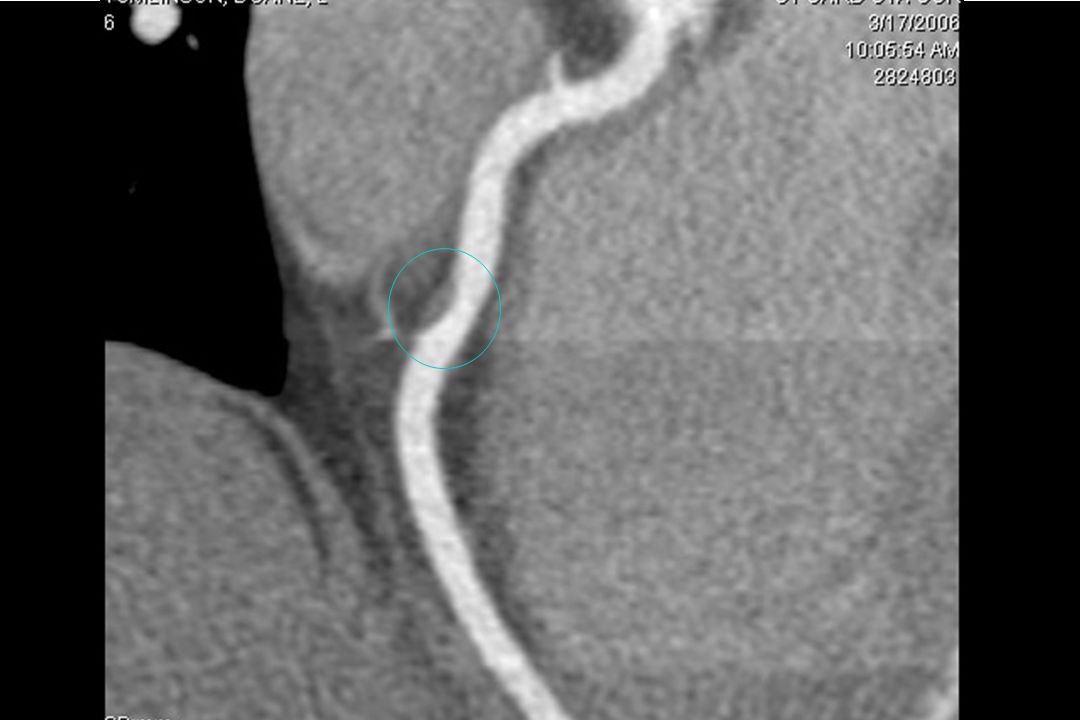
83
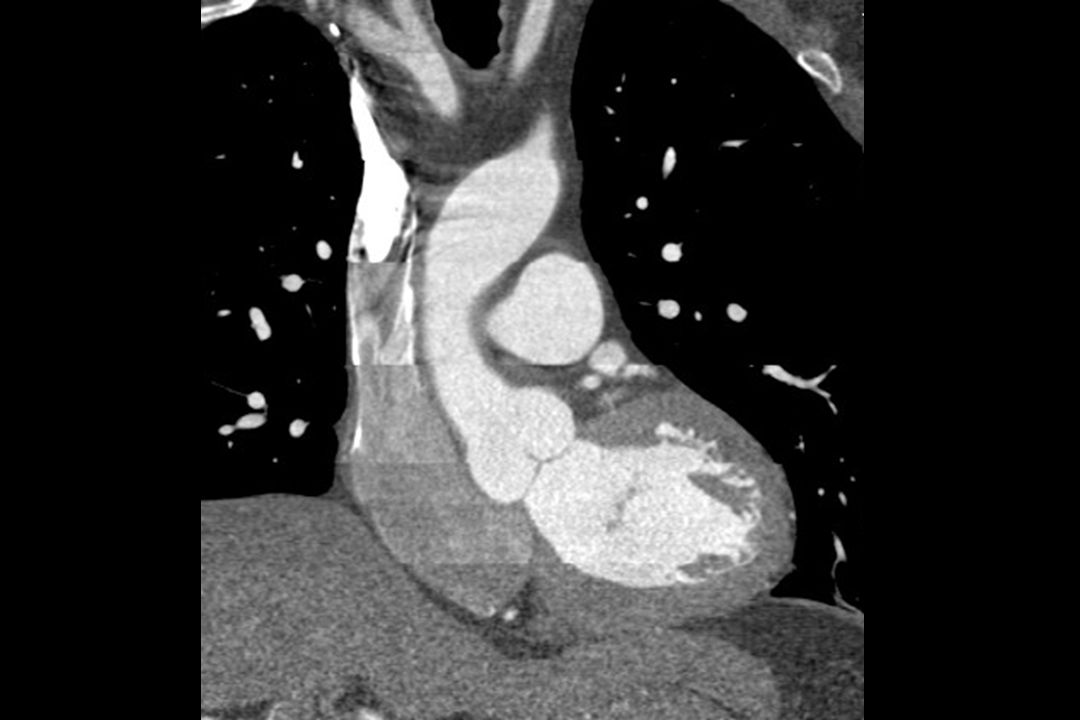
Clinical TRO case: good contrast in PA, Coronary arteries, and Aorta with low density in right heart
Mitsumori

84
Low-Risk Chest Pain Patients in the Emergency Department:
Negative 64 Channel Cardiac CT May Reduce Length of Stay and Hospital Charges Janet M. May, William P. Shuman, Jared N. Strote, Kelley R. Branch, David W. Lockhart, Lee M. Mitsumori, Bill H. Warren, Theodore J. Dubinsky, James H. Caldwell University of Washington Department of Radiology 84

85
Negative Whole Chest Gated CT
May et al, AJR, July 2009 Standard of Care: hours, $7597 Neg CT + 3 Enz, ECG: 14 hours, $6153 Neg CT + 1 Enz, EGC: 5 hours, $4251 CT in the diagnostic pathway may shorten ER LOS by 20 hours and lower charges by 44% for most patients with low risk non-specific chest pain

86
Dose Reduction: Technology
Cardiac CT: Dose control techniques Adaptive Statistical Iterative Reconstruction (ASIR): the Theory ASIR: The Practice How we started Evolution of ASIR practice Cardiac ASIR ASIR: The Impact
: the Theory. ASIR: The Practice. How we started. Evolution of ASIR practice. Cardiac ASIR. ASIR: The Impact.")
87
Noise Limits Dose Reduction
What if we did everything we could to lower dose and…. The Images are too noisy ? When generated with Filtered Back Projection (FBP) reconstruction technique
 reconstruction technique.")
88
Noise Limits Dose Reduction
Answer: find a different way to reconstruct low dose images so they look much less noisy

89
Filtered Back Projection
The Math : Several assumptions - simplify reality Saves time in calculations What if instead tried to model reality ? Filter back projection is complicated but make simplifications to make an image , raw data in the formula to make an image

90
Iterative Reconstruction
ASiR Adaptive Statistical Iterative Reconstruction

91
ASIR : Different Assumptions
FBP ASIR Point Focal Spot Point Detector Point Voxel Pencil Beam Perfect Sample Line Integral Simple Calculation Simplicity Real Focal Spot Real Detector Cubic Voxel Broad Beam Statistical Model Physics Model Complex Computation Image Quality . Today to make the formula work the focal spot is a point, no physical size, also the detector is a point, when we look at x-ray measurement we look a pencil beam (infinitely small thin pass, no physical dimension in width) with ir you are marrying a bundle(in ir we measure a bundle over an area in a volume) for fbp we ignore statistics (electronic noise and photon statistics) with fbp you treat it as perfect which makes it nosier, with IR you understand patterns and treat them differently which allow easier correction x-ray flux A Better Model of Reality !
 with ir you are marrying a bundle(in ir we measure a bundle over an area in a volume) for fbp we ignore statistics (electronic noise and photon statistics) with fbp you treat it as perfect which makes it nosier, with IR you understand patterns and treat them differently which allow easier correction. x-ray flux. A Better Model of Reality !")
92
ASiR ASIR is more computationally intensive
With today’s faster processors: Increased time not noticeable

93
Low Contrast Detectability
50% ASiR at half dose = full dose FBP. Full dose: mGy Half dose: mGy

94
Why not 100% ASIR? “Plastic or Waxy” look of 100% ASIR images Reduce ASiR 30% to 50% blend with FBP

95
ASIR: none vs. 100% None 100% ASIR
Deneau HA anuerysm small FOV, HI Res ( .9 Pitch ) and 100 kV with NI of DLP 268 Aorta HU 754 0 and 100 % ASiR sets None 100% ASIR
 and 100 kV with NI of 27.5 DLP 268 Aorta HU and 100 % ASiR sets. None. 100% ASIR.")
96
Varying ASIR % NI 40 asir 0% NI 40 asir 30% NI 40 asir 50%
Mitsumori

97
Noise Index and ASIR % Mitsumori NI 40, 0% NI 40, 30% NI 30, 0%

98
NI 40, ASIR 50% (190 – 114) / 190 = 40% dose reduction
 / 190 = 40% dose reduction")
99
Which Is the ASIR Image: 40% Lower Dose ?
VCT on left with DLP of 798 and HD on right with DLP of 378– VCT a little better but does it justify twice the dose ?

100
Impact of 40% ASIR, NI = 30 DLP = 815 DLP = 414 mSv = 11.4 mSv = 5.8
One study at 815 DLP and the other at NI ASiR 30 % DLP = 815 mSv = 11.4 DLP = 414 mSv = 5.8 J. Platt

101
Impact of 30% ASIR 40% dose reduction
O and 30 % ASiR sets look fine hence overdosed DLP 880 40% dose reduction

102
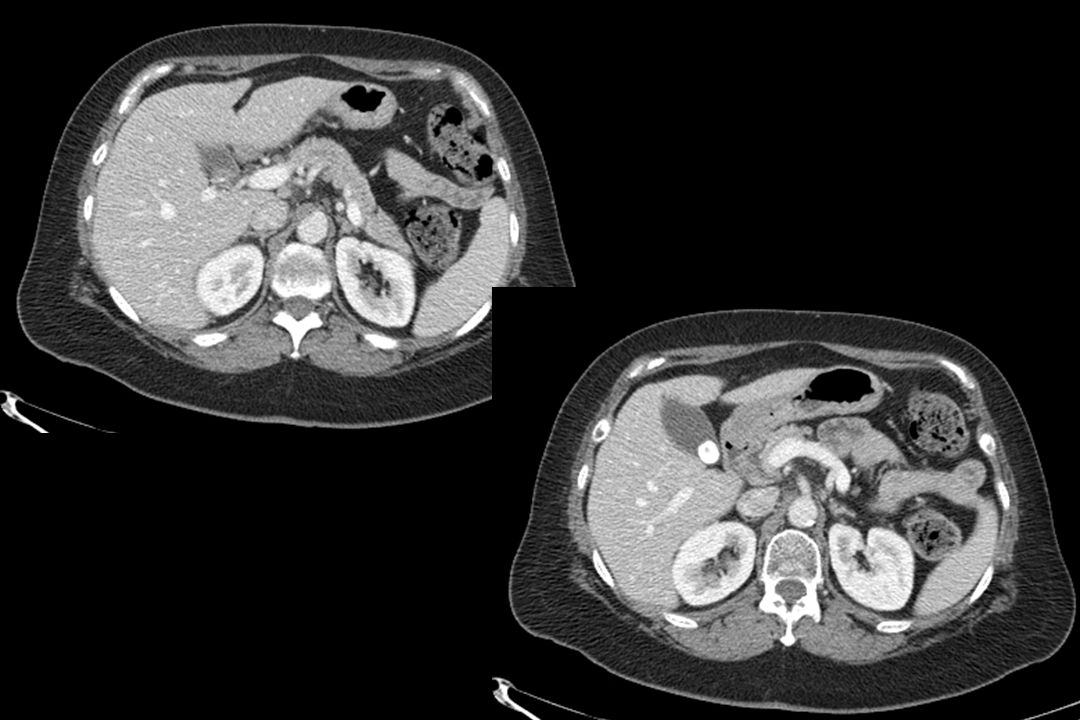
Crohn’s: Low Dose (ASIR 40%)
Low dose CT, DLP 388, with first dx of IBD in 70 year old DLP 388 = 5.4 mSv J. Platt

103
Rules of Thumb If routine images look good (2.5 to 5mm)
Cut dose by 30%: NI 30-36 Add ASIR: – 50% If thin slice imagers look good (0.625 mm) Cut dose by 50%: NI 36 – 40 Add ASIR: – 50%
 Cut dose by 50%: NI 36 – 40. Add ASIR: 30 – 50%")
104
ASIR and UWa Routine Body Started at NI 40, ASIR 50%
Looked too “different” Changed to NI 36, ASIR 40% Most images excellent, but not all Small pts: too noisy Large pts: Too much dose

105
ASIR and U Wa Routine Body Imaging Current:
Small: FOV < 34 (BMI < 25) NI 30, ASIR 40% Medium: FOV 34 – 44 (BMI 25 – 35) NI 36, ASIR 40% Large: FOV > 44 (BMI > 35) NI 40, ASIR 40%
 NI 30, ASIR 40% Medium: FOV 34 – 44 (BMI 25 – 35) NI 36, ASIR 40% Large: FOV > 44 (BMI > 35) NI 40, ASIR 40%")
107
ASIR and U Wa Chest Started at NI 40, ASIR 50% Edge effect annoying
A little too “waxy” Current: NI 36, ASIR 30%

108
ASIR: Chest No ASIR, NI 30 30 % ASIR, NI 36
30 % ASiR too much for HRCT- plastic- use 0% ASiR instead or could reduce dose further No ASIR, NI 30 30 % ASIR, NI 36

109
ASIR: Chest 30 % ASiR 30 % ASiR too much for HRCT- plastic- use 0% ASiR instead or could reduce dose further

110
ASIR and U Wa Neuro Started at NI 36, ASIR 40% Happy

111
Rules of Thumb For Cardiac CT, use 50% ASIR in all cases to reduce noise in images On the 750HD, use HD mode and small FOV for acquisition Use cardiac Prospective Gating in most cardiac cases (85%)
")
112
No ASIR

113
50% ASIR

114
HD + 50% ASIR

115
Dose Reduction: Technique
Noise index and Automatic Tube Current Modulation (ATCM) for mA kVp and body size Rotation time Centering Body Shields Z – axis control
 for mA. kVp and body size. Rotation time. Centering. Body Shields. Z – axis control.")
116
Dose Reduction: Technology
Cardiac CT: Dose control techniques ASIR: The Theory ASIR the practice How we started Evolution of ASIR practice Cardiac ASIR ASIR: The Impact

118
The Future: Model Based Iterative Reconstruction (MBIR)
ASiR MBIR 12 mAs FBP Paul Kinahan

119
FBP vs. ASIR vs. MBIR FBP ASIR MBIR
120 kVp, variable mAs (NI=36), pitch mm, BMI = 34 PAUL KINAHAN
, pitch mm, BMI = 34. PAUL KINAHAN.")
120
Change is inevitable…. ….except from a vending machine. Groucho Marx

123
FBP vs. ASiR vs. (MBIR) Simple Advanced Powerful FBP MBIR ASiR
Raw Data Mathematics Real Focal Spot Real Detector 3D Voxel Actual Beam Physics Model Point Focal Spot Point Detector Point Voxel Pencil Beam Point Focal Spot Point Detector Point Voxel Pencil Beam Perfect Sample Statistical Model Advanced Statistical Model Historically, CT technological advancement has been driven by hardware. However, image reconstruction is a critical part of the process. As a matter of fact, the images that radiologists see are the output from the reconstruction engine, not directly from the detector reading. For the past 30+ years, every vendor used a class of reconstruction algorithm call filtered backprojection (FBP). To make the mathematics tractable, many simplifications were made. These include the assumption that the focal spot is an infinitely small point, the detector is also an point located at the detector cell center, the reconstructed voxel has not shape or size, and the measured signal contains no error due to photon statistics or electronic noise. These assumptions are necessary from a mathematics point of view, but the end result is a compromise in image quality. This is due to the fact that these assumptions do not represent the true status of the CT system. In the past 9 years, GE has invested heavily in this area. We teamed up with top researchers from three major universities (ND/Purdue/Michigan) to developed a different class of reconstruction algorithm: model-based iterative reconstruction (MBIR). This algorithm accurately models both the CT system optics (geometric information) as well as statistics. The application of these algorithm can result in significant improvement in terms of spatial resolution, noise and dose reduction, and temporal resolution, as will be illustrated later. The drawback of this approach is the significant computational complexity. Even with today’s state-of-the-art computer platform, the image generation speed still does not meet the routine clinical workflow. To overcome this difficulty, we developed an adaptive statistical iterative reconstruction algorithm (ASIR) that simplifies the system optics modeling during the reconstruction. As a result, a significant increase in computational speed has been achieved. Because ASIR still full models the system statistics, we achieve noise and dose reduction as will be illustrated later. Stop – we keep going until no visual change in image. How many times do you iterate – not relevant - Optimal IQ Lower Noise Hi Resolution More Computation Simple Fast High Noise Better IQ Low Noise Lower Dose
. To make the mathematics tractable, many simplifications were made. These include the assumption that the focal spot is an infinitely small point, the detector is also an point located at the detector cell center, the reconstructed voxel has not shape or size, and the measured signal contains no error due to photon statistics or electronic noise. These assumptions are necessary from a mathematics point of view, but the end result is a compromise in image quality. This is due to the fact that these assumptions do not represent the true status of the CT system. In the past 9 years, GE has invested heavily in this area. We teamed up with top researchers from three major universities (ND/Purdue/Michigan) to developed a different class of reconstruction algorithm: model-based iterative reconstruction (MBIR). This algorithm accurately models both the CT system optics (geometric information) as well as statistics. The application of these algorithm can result in significant improvement in terms of spatial resolution, noise and dose reduction, and temporal resolution, as will be illustrated later. The drawback of this approach is the significant computational complexity. Even with today’s state-of-the-art computer platform, the image generation speed still does not meet the routine clinical workflow. To overcome this difficulty, we developed an adaptive statistical iterative reconstruction algorithm (ASIR) that simplifies the system optics modeling during the reconstruction. As a result, a significant increase in computational speed has been achieved. Because ASIR still full models the system statistics, we achieve noise and dose reduction as will be illustrated later. Stop – we keep going until no visual change in image. How many times do you iterate – not relevant - Optimal IQ. Lower Noise. Hi Resolution. More Computation. Simple. Fast. High Noise. Better IQ. Low Noise. Lower Dose.")
Similar presentations