Download presentation
Presentation is loading. Please wait.

1
http://www.meteo.unican.es/ensembles Hands-on Demonstration of the Statistical Downscaling Portal for Regional Climate Change Projection José M. Gutiérrez Applied Meteorology Research Group, Santander, Spain 4th General Assembly Prague 12-16 November 2007 Clare Goodess (CRU), Francisco Doblas-Reyes (ECMWF) Daniel San-Martín, Antonio S. Cofiño, Carmen Sordo, Jesús Fernández, Dolores Frías, Miguel A. Rodríguez, S. Herrera, Rafael Ancell, M.R. Pons, B. Orfila, E. Díez
, Francisco Doblas-Reyes (ECMWF) Daniel San-Martín, Antonio S. Cofiño, Carmen Sordo, Jesús Fernández, Dolores Frías, Miguel A. Rodríguez, S. Herrera, Rafael Ancell, M.R. Pons, B. Orfila, E. Díez.")
2
http://www.meteo.unican.es/ensembles Motivation There are many projects around the world producing global (GCM) and regional (RCM) simulations of climate change. Many of these projects involve end-uses from impact sectors... There is a need of friendly interactive tools so users can easily run interpolation/downscaling jobs on their own data using the existing downscaling techniques and simulation datasets (AR4, Prudence, ENSEMBLES,...). However, it is still difficult for end-users to access the stored simulations and to post-process them to be suitable for their own models: daily resolution, interpolation to prescribed locations, etc.
. However, it is still difficult for end-users to access the stored simulations and to post-process them to be suitable for their own models: daily resolution, interpolation to prescribed locations, etc..")
3
http://www.meteo.unican.es/ensembles Fabio Micale Iacopo Cerrani Giampiero Genovese Downscale DEMETER and ENSEMBLES s2d hindcasts to get daily precip, radiation, wind speed, and maximum/minimum temperatures to make crop yield modeling. The goal is to compare the downscaled data to GCM outputs and to estimate seasonal predictability. Two ongoing research collaborations with s2d users. Downscale DEMETER and ENSEMBLES s2d hindcasts to get daily maximum and minimum temperatures to make electricity demand forecasts. The goal is to compare the downscaled data to GCM outputs. Local precipitation forecasts for hydropower production capacities. ELECTRICITÉ DE FRANCE Laurent Dubus Marta Nogaj Collaboration with End-Users

4
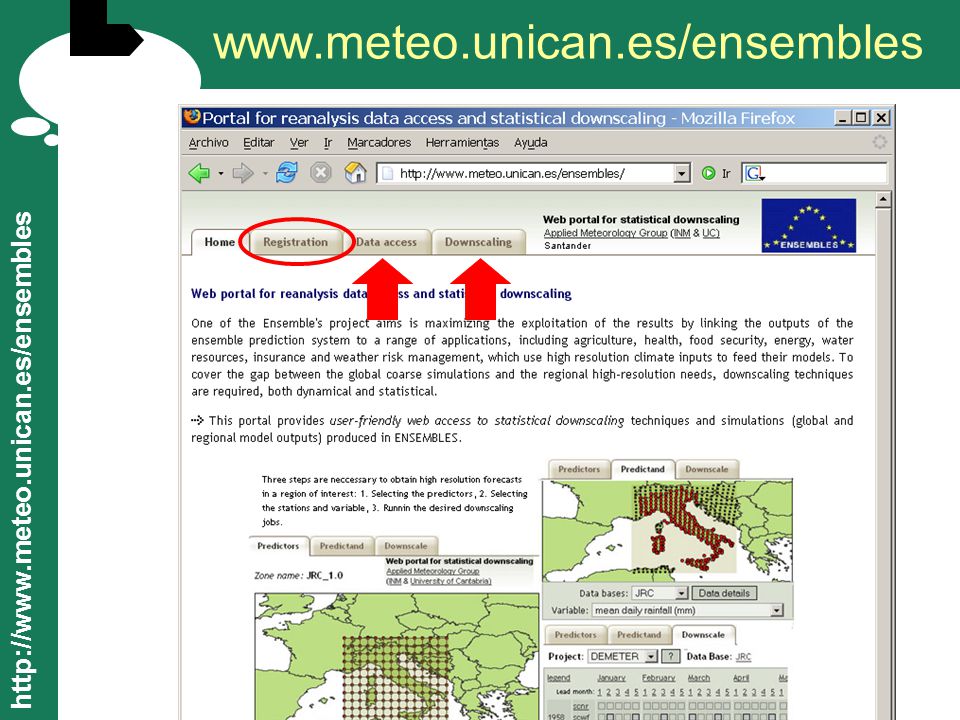
http://www.meteo.unican.es/ensembles www.meteo.unican.es/ensembles
5
http://www.meteo.unican.es/ensembles Data Access Portal 60,Potential Vorticity,PV 129,Geopotential,Z 130,Temperature,T 131,U velocity,U 132,V velocity,V 133,Specific humidity,Q 136,Total Column Water,TCW 137,Total Column Water Vapour,TCWV 138,Relative vorticity,VO 142,Large Scale Precipitation,LSP 143,Convective Precipitation,CP 151,MSLP,MSL 155,Divergence,D 157,Relative humidity,R 165,10m E-Wind Component,10U 166,10m N-Wind Component,10V 167,2m Temperature,2T 168,2m Dew Point,2D 1000, 925, 850, 700, 500, 300 mb 00, 06, 12, 18, 24 UTC 1.125ºx1.125º resolution

6
http://www.meteo.unican.es/ensembles Data Access: s2d & acc

7
http://www.meteo.unican.es/ensembles Problem: Local climate change prediction for Madrid (Spain):maximum temperature Goal: Provide daily local values for the summer season june-august 2010-2040 in a suitable format (e.g., text file, or Excel file). Statistical Downscaling Portal Precipitation Temperature ( T( 1ooo mb ),..., T( 500 mb ); Z( 1ooo mb ),..., Z( 500 mb ); H( 1ooo mb ),..., H( 500 mb ) ) X n Regres, CCA, … Y n = W T X n YnYn PredictorsPredictandsDownscaling Model This is the structure followed in the portal’s design: predictors + predictand + downscaling method. Global zone Local zone
,..., T( 500 mb ); Z( 1ooo mb ),..., Z( 500 mb ); H( 1ooo mb ),..., H( 500 mb ) ) X n Regres, CCA, … Y n = W T X n YnYn PredictorsPredictandsDownscaling Model This is the structure followed in the portal’s design: predictors + predictand + downscaling method. Global zone Local zone.")
8
http://www.meteo.unican.es/ensembles Demo... My Home The “My Home” tab allows the user to explore: 1.The zones (pre-defined regions). 2.The profile with the account information. 3.The status of the jobs: queued, running, finished.
. 2.The profile with the account information. 3.The status of the jobs: queued, running, finished..")
9
http://www.meteo.unican.es/ensembles A simple zone with a single predictor parameter: T850mb was created. New zones can be easily defined by clicking in the “new zone” button. Demo... Predictors

10
http://www.meteo.unican.es/ensembles Demo... predictand

11
http://www.meteo.unican.es/ensembles Demo... Downscaling Method

12
http://www.meteo.unican.es/ensembles Demo... Validation

13
http://www.meteo.unican.es/ensembles Demo... Regional Projection

14
http://www.meteo.unican.es/ensembles Demo... Computing Time Five minutes later... Scheduling the job

15
http://www.meteo.unican.es/ensembles Typical Application Data (local) netCDF lib Downs. Portal OpenDAP Client Downs. Portal OpenDAP Via http OpenDAP Servers Distributed-data Application Local access to data Data (ECMWF) Data (DMI) Data (remote) s2d RCM ACC GCM ACC PRESENT FUTURE Paco Doblas-Reyes Antje Weisheimer Philippe Gachon Distributed Data Access
 Data (DMI) Data (remote) s2d RCM ACC GCM ACC PRESENT FUTURE Paco Doblas-Reyes Antje Weisheimer Philippe Gachon Distributed Data Access.")
16
http://www.meteo.unican.es/ensembles Big Projects... Using Restricted Data

17
http://www.meteo.unican.es/ensembles Summary Nowadays, Statistical Downscaling (SD) is a mature field and there is a huge amount of data (observations, reanalysis and simulations) to apply SD techniques in a variety of problems. Web-based interactive tools (such as the statistical downscaling portal) can help end- users to explore and use this information. These tools should be part of the different climate change projects in order to maximize the analysis and explotation of the results.
 can help end- users to explore and use this information. These tools should be part of the different climate change projects in order to maximize the analysis and explotation of the results..")
18
http://www.meteo.unican.es/ensembles Future Plans Support end-users using the portal (complete documentation). Link the portal to the DMI database of regional models. Connect with existing E-Science EU initiatives (EGEE Earth Science VO). Santander is one of the nodes of the National Supercomputing Center and has also great experience in GRID computing.
. Santander is one of the nodes of the National Supercomputing Center and has also great experience in GRID computing..")
19
http://www.meteo.unican.es/ensembles Final Remark so we highly encourage CERA and GCM providers to work as much as they can to put their data in CERA as quick as possible. Without data we are nothing and our work is useless !!!

Similar presentations


, C.M. Goodess (2)>")


 Siraj Ul Islam, Nadia Rehman.>")
 Project is funded by the Climate Change Action Fund and provides climate change scenarios and related information.>")
 is responsible for forecasts several times.>")


 covering the period 1950-2100, for the majority.>")


