Download presentation
Presentation is loading. Please wait.

1
Chapter 2 Computer Imaging Systems

2
Content Image Formation and Sensing Human Visual Perception – Human Visual System – Spatial Frequency Resolution – Brightness Adaptation – Temporal Resolution

3
Image Formation & Sensing Digital images formed by energy interacting with a device that responds in a way that can be measured These measurements are taken at various points across a 2D grid The measuring devices – sensors and many different types are in use Sensors respond to electromagnetic (EM) spectrum, acoustical (sound) energy, electron beams, lasers and other signals
 spectrum, acoustical (sound) energy, electron beams, lasers and other signals")
4
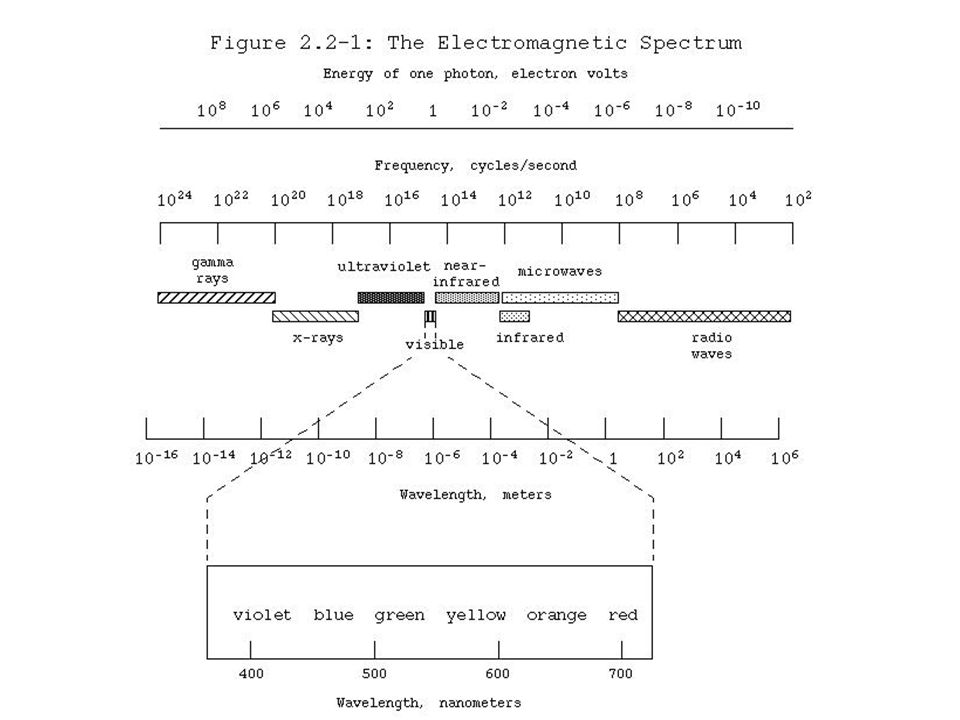
EM spectrum consists of visible light, infrared, ultraviolet, x-rays, microwaves, radio waves, or gamma waves Fig. 2.2.1 shows various spectral bands & their associated names, wavelengths, frequencies, and energy

6
Visible Light Imaging The light source emits light that is reflected from the object, & focused by lens onto the image sensor The sensor responds to the light energy by converting into electrical energy which is then measured This measurement is proportional to incident energy and describe as brightness at that point

7
Figure 2.2-2 Model for visible light imaging. The light source emits light that is reflected from the object, and focused by the lens onto the image sensor Object in the world Lens Image Sensor Reflected Light Incident Light Light Source

8
The way object appears dependent on the way it reflects light – reflectance function of the object & related to what we think of as color and texture The color determines which wavelengths of light are absorbed & reflected Texture determines the angle at which the light is reflected

9
Figure 2.2-3 The Reflectance Function. Here we see that the way in which an object reflects the incident light, the reflectance function, has a major effect on how it appears in the resulting image. The reflectance function is an intrinsic property of the object and relates to both color and texture. a) monochrome image showing brightness only, the color determines how much light is reflected and the surface texture determines the angle at which the light is reflected, b) color image, the color determines which wavelengths are absorbed and which are reflected
 monochrome image showing brightness only, the color determines how much light is reflected and the surface texture determines the angle at which the light is reflected, b) color image, the color determines which wavelengths are absorbed and which are reflected.")
10
Imaging Outside the Visible Range of EM Spectrum Imaging with gamma-rays – measuring the rays as they are emitted from the object X-rays used in medical diagnostics Ultraviolet (UV) imaging used in industrial applications, law enforcement, microscopy, astronomy Infrared (IR) images used in satellite imaging
 imaging used in industrial applications, law enforcement, microscopy, astronomy Infrared (IR) images used in satellite imaging")
11
a) X-ray of a chest with an implanted electronic device to assist the heart (image courtesy of George Dean) b) dental x-ray
 X-ray of a chest with an implanted electronic device to assist the heart (image courtesy of George Dean) b) dental x-ray")
12
c) and d) fluorescence microscopy images of cells, generated by emitting visible light when illuminated by ultraviolet (UV) light (cell images courtesy of Sara Sawyer, SIUE)
 and d) fluorescence microscopy images of cells, generated by emitting visible light when illuminated by ultraviolet (UV) light (cell images courtesy of Sara Sawyer, SIUE)")
13
e) one “slice” of a computerized tomography (CT) image of a patient’s abdomen, multiple 2-D image “slices” are taken at various angles and are then assembled to create a 3-D image
 one slice of a computerized tomography (CT) image of a patient’s abdomen, multiple 2-D image slices are taken at various angles and are then assembled to create a 3-D image")
14
Figure 2.2-11 (a) Infrared satellite image showing water vapor, (b) Infrared satellite imagery in the near infrared band (images courtesy of National Oceanic and Atmospheric Administration (NOAA))
 Infrared satellite image showing water vapor, (b) Infrared satellite imagery in the near infrared band (images courtesy of National Oceanic and Atmospheric Administration (NOAA))")
15
Acoustic Imaging Works by sending out pulses of sonic energy (sound) at various frequencies & meauring the reflected waves Used in biological systems
 at various frequencies & meauring the reflected waves Used in biological systems")
16
a) b) c) Figure 2.2-13 a) Ultrasound image of a baby showing the head and spine, b) Ultrasound image of a baby sucking its thumb, c) Ultrasound image of a baby smiling (isn’t it amazing what parent’s can see! – images courtesy of Angi and Dave Lunning)
.")
17
Electron Imaging a) b) c) d) Figure 2.2-14 a) Scanning Electron Microscope (SEM) b) SEM image of a mosquito, c) logic gate in a microchip, d) strawberry
 b) c) d) Figure a) Scanning Electron Microscope (SEM) b) SEM image of a mosquito, c) logic gate in a microchip, d) strawberry")
18
Laser Imaging Used to create range images (depth maps) which contain information about the distance of a point in the world to image sensor instead of intensity
 which contain information about the distance of a point in the world to image sensor instead of intensity")
19
Stockman MSU/CSE Fall 200919 2.5D face image from Minolta Vivid 910 scanner in the CSE PRIP Lab A rotating mirror scans a laser stripe across the object. 320x240 rangels obtained in about 2 seconds. [x,y,z,R,G,B] image.

20
Computer Generated Images Computers can be used to create images for applications For engineering (design & drafting), medicine and education, computer graphics, games etc.
, medicine and education, computer graphics, games etc.")
21
Image Representation We have seen that the imaging sensor receives an input image as a collection of spatially distributed light energy; this form is called an optical image. Optical images are the types we deal with everyday-cameras capture them, monitors display them, and we see them. The digital image I(r, c) is represented as a two- dimensional array of data, where each pixel value corresponds to the brightness of the image at the point (r, c)
 is represented as a two- dimensional array of data, where each pixel value corresponds to the brightness of the image at the point (r, c).")
22
In linear algebra terms, a two-dimensional array like our image model I(r, c) is referred to as a matrix, and one row (or column) is called a vector. This image model is for monochrome (one-color, this is what we normally refer to as black and white) image data, but we have other types of image data that require extensions or modifications to this model. Typically, these are multiband images (color, multispectral), and they can be modeled by a different I(r, c) function corresponding to each separate band of brightness information. The image types we will consider are: 1) binary, 2) gray- scale, 3) color,and 4) multispectral.
 image data, but we have other types of image data that require extensions or modifications to this model. Typically, these are multiband images (color, multispectral), and they can be modeled by a different I(r, c) function corresponding to each separate band of brightness information. The image types we will consider are: 1) binary, 2) gray- scale, 3) color,and 4) multispectral..")
23
Binary Images Binary images are the simplest type of images and can take on two values, typically black and white, or '0' and '1.' A binary image is referred to as a 1 bit/pixel image because it takes only 1 binary digit to represent each pixel. These types of images are most frequently used in computer vision applications where the only information required for the task is general shape, or outline, information. For example, to position a robotic gripper to grasp an object, to check a manufactured object for deformations, for facsimile (FAX)images, or in optical character recognition (OCR). often created from gray-scale images via a threshold operation, where every pixel above the threshold value is turned white ('1'), and those below it are turned black ('0').
images, or in optical character recognition (OCR). often created from gray-scale images via a threshold operation, where every pixel above the threshold value is turned white ( 1 ), and those below it are turned black ( 0 )..")
24
Gray-Scale Images Gray-scale images are referred to as monochrome, or one-color images. They contain brightness information only, no color information. The number of bits used for each pixel determines the number of different brightness levels available. The typical image contains 8 bits/pixel data, which allows us to have 256 (0-255) different brightness (gray) levels.
 different brightness (gray) levels..")
25
Color Images Color images can be modeled as three-band monochrome image data, where each band of data corresponds to a different color. The actual information stored in the digital image data is the brightness information in each spectral band. When the image is displayed, the corresponding brightness information is displayed on the screen by picture elements that emit light energy corresponding to that particular color. Typical color images are represented as red, green, and blue, or RGB images. Using the 8-bit monochrome standard as a model, the corresponding color image would have 24 bits/pixel - 8-bits for each of the three color bands (red, green, and blue). In Figure 2.4.2a we see a representation of a typical RGB color image. Figure 2.4.2b illustrates that, in addition to referring to a row or column as a vector, we can refer to a single pixel's red, green, and blue values as a color pixel vector – (R, G,B).
. In Figure 2.4.2a we see a representation of a typical RGB color image. Figure 2.4.2b illustrates that, in addition to referring to a row or column as a vector, we can refer to a single pixel s red, green, and blue values as a color pixel vector – (R, G,B)..")
27
For example, the hue/saturation/lightness (HSL) color transform allows us to describe colors in terms that we can more readily understand. The lightness is the brightness of the color, and the hue is what we normally think of as "color" (for example green, blue, or orange). The saturation is a measure of how much white is in the color (for example, pink is red with more white, so it is less saturated than a pure red). Most people can relate to this method of describing color. For example, "a deep, bright orange" would a have a large intensity (“bright”), a hue of "orange," and a high value of saturation ("deep"). We can picture this color in our minds, but if we defined this color in terms of Its RGB components, R == 245, G == 110, and B == 20, most people would have no idea how this color appears. Because the HSL color space was developed based on heuristics relating to human perception, various methods are available to transform RGB pixel values into the HSL COIOT space. Most of these are algorithmic in nature and are geometric approximations to mapping the RGB color cube into some HSL-type color space (see Figure 1.7-4).
. The saturation is a measure of how much white is in the color (for example, pink is red with more white, so it is less saturated than a pure red). Most people can relate to this method of describing color. For example, a deep, bright orange would a have a large intensity ( bright ), a hue of orange, and a high value of saturation ( deep ). We can picture this color in our minds, but if we defined this color in terms of Its RGB components, R == 245, G == 110, and B == 20, most people would have no idea how this color appears. Because the HSL color space was developed based on heuristics relating to human perception, various methods are available to transform RGB pixel values into the HSL COIOT space. Most of these are algorithmic in nature and are geometric approximations to mapping the RGB color cube into some HSL-type color space (see Figure 1.7-4)..")
28
RGB to HSL Mapping

29
Multispectral Images Multispectral images typically contain information outside the normal human perceptual range. This may include infrared, ultraviolet, X-ray, acoustic, or radar data. These are not images in the usual sense because the information represented is not directly visible by the human system. However, the information is often represented in visual form by mapping the different spectral bands to RGB components. If more than three bands of information are in the multispectral image, the dimensionality is reduced by applying a principal components transform.

30
Digital File Formats Many different types of images and applications with varying requirements. Types of image data are divided into two primary categories: bitmap and vector. Bitmap images (also called raster images) can be represented by our image model I(r, c), where we have pixel data and the corresponding brightness values stored in some file format. Vector images refer to methods of representing lines, curves, and shapes by storing only the key points. These key points are sufficient to define the shapes, and the process of turning these into an image is called rendering. After the image has been rendered, it can be thought of as being in bitmap format, where each pixel has specific values associated with it.
 can be represented by our image model I(r, c), where we have pixel data and the corresponding brightness values stored in some file format. Vector images refer to methods of representing lines, curves, and shapes by storing only the key points. These key points are sufficient to define the shapes, and the process of turning these into an image is called rendering. After the image has been rendered, it can be thought of as being in bitmap format, where each pixel has specific values associated with it..")
31
Most of the types of file formats discussed fall into the category of bitmap images, although some are compressed, so that the I(r, c) values are not directly available until the file is decompressed. In general, these types of images contain both header information and the raw pixel data. The header must contain information regarding: 1) the number of rows (height), 2) the number of columns (width), 3) the number of bands, 4) the number of bits per pixel, and 5) the file type. Additionally with some of the more complex file formats, the header may contain information about the type of compression used and any other necessary parameters to create the image, I(r, c).
 the number of rows (height), 2) the number of columns (width), 3) the number of bands, 4) the number of bits per pixel, and 5) the file type. Additionally with some of the more complex file formats, the header may contain information about the type of compression used and any other necessary parameters to create the image, I(r, c)..")
32
The simplest file formats are the BIN and the PPM file formats. The BIN format is simply the raw image data I(r, c). This file contains no header information, so the user must know the necessary parameters-size, number of bands, and bits per pixel-to use the file as an image. The PPM formats are widely used, and a set of conversion utilities are freely available (pbmplus). They basically contain raw image data with the simplest header possible. The PPM format includes PBM (binary), PGM (gray-scale), PPM (color), and PNM (handles any of the previous types). The headers for these image file formats contain a "magic number" that identifies the file type, the image width and height, the number of bands, and the maximum brightness value (which determines the required number of bits per pixel for each band).
. This file contains no header information, so the user must know the necessary parameters-size, number of bands, and bits per pixel-to use the file as an image. The PPM formats are widely used, and a set of conversion utilities are freely available (pbmplus). They basically contain raw image data with the simplest header possible. The PPM format includes PBM (binary), PGM (gray-scale), PPM (color), and PNM (handles any of the previous types). The headers for these image file formats contain a magic number that identifies the file type, the image width and height, the number of bands, and the maximum brightness value (which determines the required number of bits per pixel for each band)..")
33
Two image file formats commonly used on many different computer platforms, as well as on the World Wide Web, are the TIFF (Tagged Image File Format) and GIF (Graphics Interchange Format) file formats. GIF files are limited to a maximum of 8 bits/pixel and allow for a type of compression called LZW (Lempel-Ziv-Welch). The 8 bits/pixel limitation does not mean that it does not support color images, it simply means that no more than 256 colors (28) are allowed in an image. This is typically implemented by means of a lookup table (LUT), where the 256 colors are stored in a table, and 1 byte (8 bits) is used as an index (address) into that table for each pixel (see Figure 1.8-1). The GIF image header is 13 bytes long and contains the basic information required.
. The 8 bits/pixel limitation does not mean that it does not support color images, it simply means that no more than 256 colors (28) are allowed in an image. This is typically implemented by means of a lookup table (LUT), where the 256 colors are stored in a table, and 1 byte (8 bits) is used as an index (address) into that table for each pixel (see Figure 1.8-1). The GIF image header is 13 bytes long and contains the basic information required..")
34
The TIFF file format is more sophisticated than GIF and has many more options and capabilities. TIFF files allow a maximum of 24 bits/pixel and support five types of compression, including RLE (run-length encoding), LZW, and JPEG (Joint Photographic Experts Group). The TIFF header is of variable size and is arranged in a hierarchical manner. TIFF is one of the most comprehensive formats available and is designed to allow the user to customize it for specific applications.
, LZW, and JPEG (Joint Photographic Experts Group). The TIFF header is of variable size and is arranged in a hierarchical manner. TIFF is one of the most comprehensive formats available and is designed to allow the user to customize it for specific applications..")
35
JPEG File Interchange Format (JFIF) is rapidly becoming a standard that allows images compressed with the JPEG algorithm to be used in many different computer platforms. The JFIF files have a Start of Image (Sal) and an application (APPO) marker that serve as a file header. JPEG image compression is being used extensively on the WWW and is expected to become the de facto standard for many applications. The JPEG algorithm is very flexible, so it can create relatively large files with excellent image quality or very small files with relatively poor image quality. The user can define the amount of compression desired dependent on the needs of the application.
 and an application (APPO) marker that serve as a file header. JPEG image compression is being used extensively on the WWW and is expected to become the de facto standard for many applications. The JPEG algorithm is very flexible, so it can create relatively large files with excellent image quality or very small files with relatively poor image quality. The user can define the amount of compression desired dependent on the needs of the application..")
36
Two formats that were initially computer specific, but have become commonly used throughout the industry, are the Sun Raster and the SGI (Silicon Graphics, Inc.) file formats. The Sun Raster file format is much more ubiquitous than the SGI, but SGI has become the leader in state-of-the-art graphics computers. The SG format handles up to 16 million colors and supports RLE compression. The SGI image header is 512 bytes (with the majority of the bytes not used presumably for future extensions) followed by the image data. The Sun Raster format is defined to allow for any number of bits per pixel and also supports RLE compression and color LUTs. It has a 32-byte header, followed by the image data.
 followed by the image data. The Sun Raster format is defined to allow for any number of bits per pixel and also supports RLE compression and color LUTs. It has a 32-byte header, followed by the image data..")
37
EPS (encapsulated PostScript), is not of the bitmap variety. It is actually a language that supports more than images; it is commonly used in desktop publishing. EPS is directly supported by many printers (in the hardware itself), so it is commonly used for data interchange across hardware and software platforms. It is a commonly used standard that allows output devices, monitors, printers, and computer software to communicate regarding both graphics and text. The primary advantage of the EPS format is its wide acceptance. The disadvantage of using EPS is that the files are very big because it is a general-purpose language designed for much more than just images. In computer imaging, EPS is used primarily as a means to generate printed images. The EPS files actually contain text and can be created by any text editor but are typically generated by applications software. The language itself is very complex and continually evolving.
, so it is commonly used for data interchange across hardware and software platforms. It is a commonly used standard that allows output devices, monitors, printers, and computer software to communicate regarding both graphics and text. The primary advantage of the EPS format is its wide acceptance. The disadvantage of using EPS is that the files are very big because it is a general-purpose language designed for much more than just images. In computer imaging, EPS is used primarily as a means to generate printed images. The EPS files actually contain text and can be created by any text editor but are typically generated by applications software. The language itself is very complex and continually evolving..")
38
VIP (Visualization in Image Processing) format, developed specifically for the CVIPtools software. When performing computer imaging tasks, temporary images are often created that use floating point representations that are beyond the standard 8 bits/pixel capabilities of most display devices. The process of representing this type of data as an image is referred to as data visualization and can be achieved by remapping the data 0 the 8-bit range, 0 to 255. Remapping is the process of taking the original data and defining an equation to translate the original data to the output data range, typically 0 to 255 for 8-bit display. The two most commonly used methods in computer imaging are linear and logarithmic mapping.

Similar presentations