Download presentation
Presentation is loading. Please wait.

1
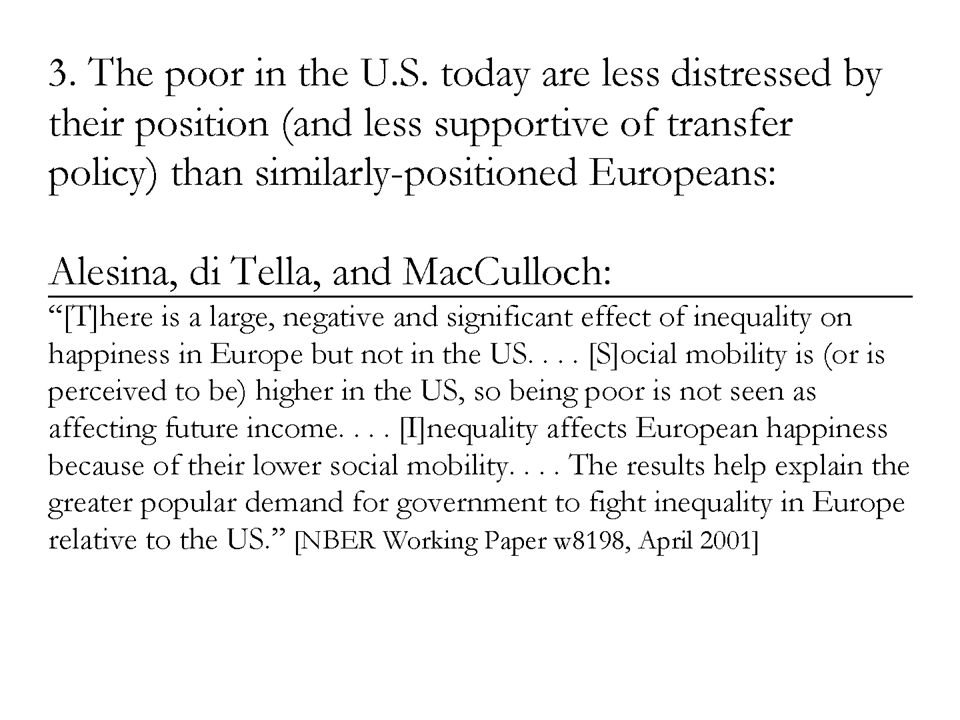
“‘ Everything in Common... But the Language’? Mobility in Britain and the U.S. Since 1850” Joseph P. Ferrie Department of Economics and Institute for Policy Research Northwestern University and NBER Jason Long Department of Economics Colby College

2
“Indeed, in many respects, she was quite English, and was an excellent example of the fact that we have really everything in common with America nowadays, except, of course, language.” Oscar Wilde, The Canterville Ghost [1891] A century later, a modern Wilde could say much the same: Britain and the U.S. have much [if not “everything”] in common: legal and political heritage economic system culture technology and [contra Wilde] language
![Indeed, in many respects, she was quite English, and was an excellent example of the fact that we have really everything in common with America nowadays, except, of course, language. Oscar Wilde, The Canterville Ghost [1891] A century later, a modern Wilde could say much the same: Britain and the U.S.](http://images.slideplayer.com/16/4947043/slides/slide_2.jpg "have much [if not everything ] in common: legal and political heritage economic system culture technology and [contra Wilde] language.")
3
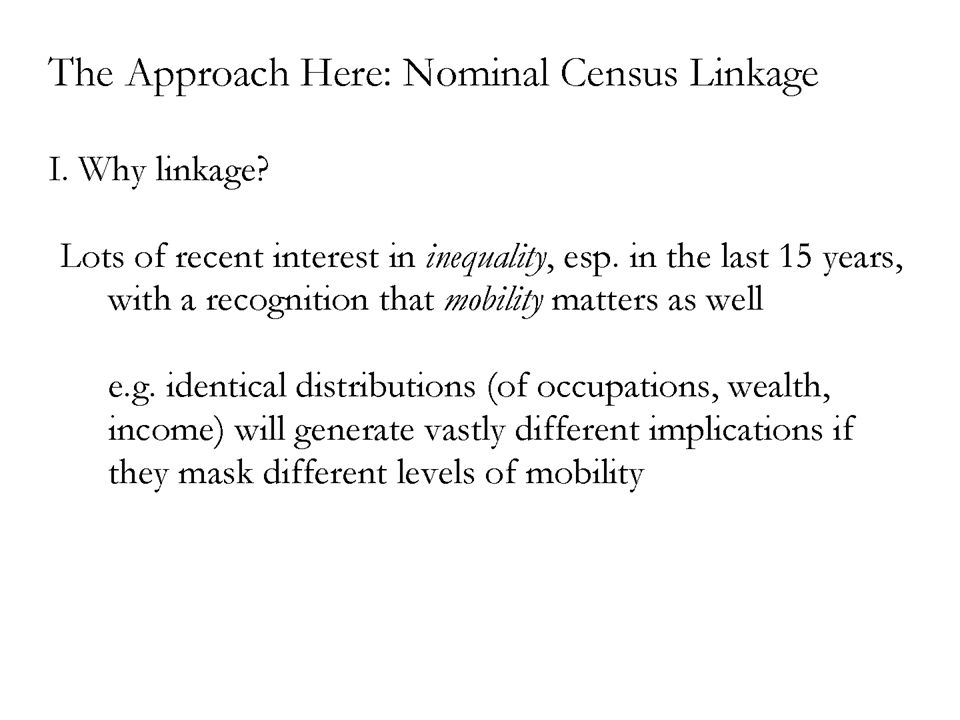
But two things they do not share are 1. their belief in the prospects for economic and social mobility (either within or across generations) and 2. their attitudes toward an active state that taxes from the successful and transfers to the unsuccessful (though this difference has narrowed since the 1980s) The U.S. also differs from a number of otherwise similar countries (France, Germany, Canada) in these respects. What are the origins of these differences?
 and 2. their attitudes toward an active state that taxes from the successful and transfers to the unsuccessful (though this difference has narrowed since the 1980s) The U.S. also differs from a number of otherwise similar countries (France, Germany, Canada) in these respects. What are the origins of these differences .")
18
II. What’s different now? Three things have made linkage easier in just the last several years: –Better indexes to and availability of US/British censuses from 1850-1901 –Complete transcription of 1880/81 censuses –Public use samples from IPUMS for US, 1850-70 and 1900- 20; for Britain for 1851

19
Studying Mobility in the 19 th Century Linked Census Data 2% Sample of 1851 Census Complete-Count 1881 Census 168,130 men in England and Wales All 12,640,000 men in the census 28,474 men in 1851 and 1881 16,829 sons in 1851 9,477 HH heads in 1851 20,269 sons in 1881 + Complete-Count 1901 Census + 8,677 sons in 1901

20
Match Criteria 1.First, last name phonetic match (e.g. “John”/“Jon”; “Aitken”/“Aitkin”). Middle initial match. 2.| Reported Age1881 – (Reported Age1851 + 30) | 5 3.Birth county and parish match. ◦Approx 16,000 parishes in England and Wales ◦Size: Median = 405, Mean = 1,842 High-resolution information 4.No duplicate matches. 5.No missing information.
. Middle initial match. 2.| Reported Age1881 – (Reported Age ) | 5 3.Birth county and parish match. ◦Approx 16,000 parishes in England and Wales ◦Size: Median = 405, Mean = 1,842 High-resolution information 4.No duplicate matches. 5.No missing information..")
21
Expected Attrition: 1851 to 1881 Linkage From Death: approx 85,000 From Emigration: approx 13,500 Expect to match 69,630 (41%) Actual match rate = 17% Matched 23% before discarding duplicates Difference due to enumeration/transcription error (age, name, birthplace; missed)
 Actual match rate = 17% Matched 23% before discarding duplicates Difference due to enumeration/transcription error (age, name, birthplace; missed)")
22
Example: John Jowitt in 1851 in Fairburn, Yorkshire Born 1844, Brotherton, Yorkshire

23
Example: John Jowitt in 1851 Born 1844, Brotherton, Yorkshire

24
Example: John Jowitt in 1881 in Hornby, Lancashire Born 1844, Brotherton, Yorkshire

25
Example: John Jowitt in 1881 Born 1844, Brotherton, Yorkshire

26
Example: John Jowitt

27
Another Example: Alfred H King and Occupational Mobility

29
Long-term goals of the project: Comparisons of intergenerational mobility between historical (c. 1880-1900) and modern (c. 1950-70) populations are possible for 5 countries U.S. Britain France Norway Canada
 and modern (c ) populations are possible for 5 countries U.S. Britain France Norway Canada.")
35
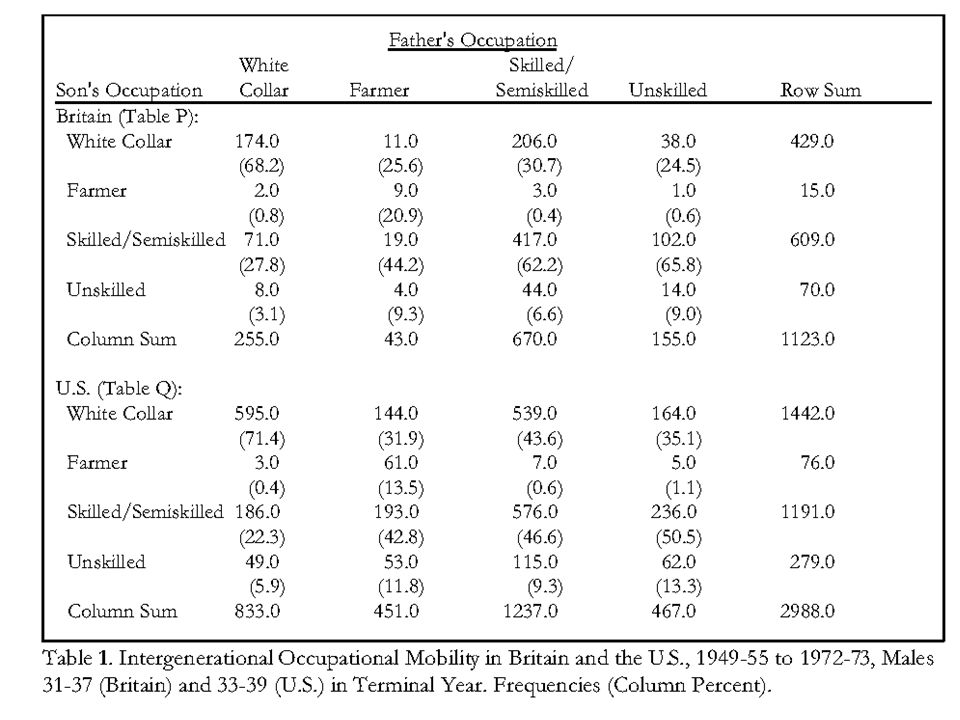
To comprehensively compare mobility between two tables, we need A single metric to summarize mobility In measuring intergenerational income mobility, this is straightforward: a regression is estimated relating son’s income to father’s income: log(Y i son )=α+ δX i +β log(Y i father )+ε i
=α+ δX i +β log(Y i father )+ε i")
36
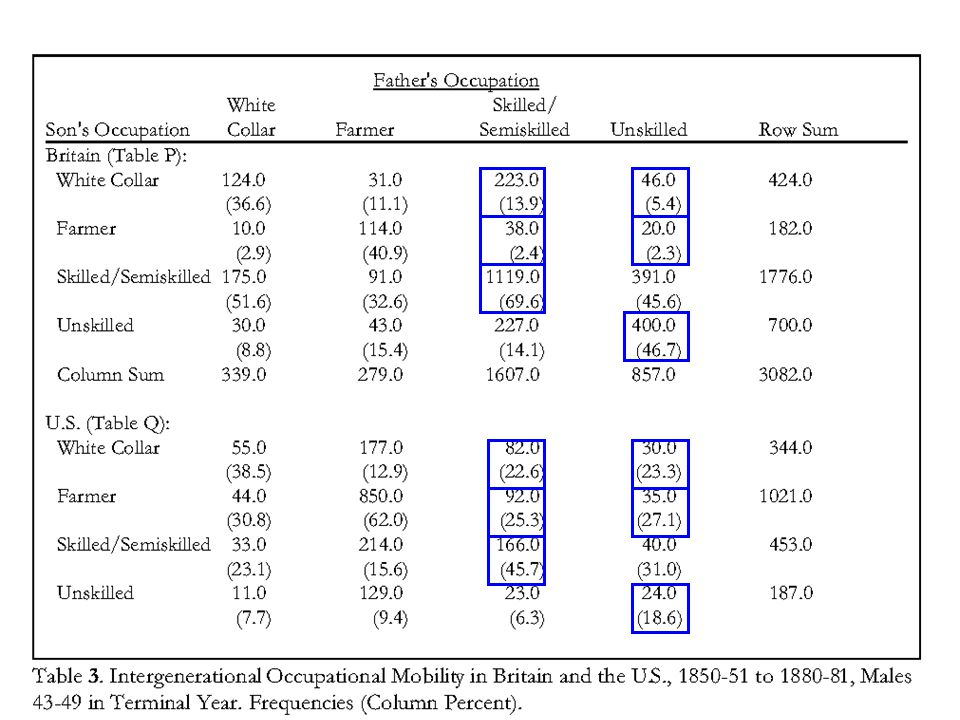
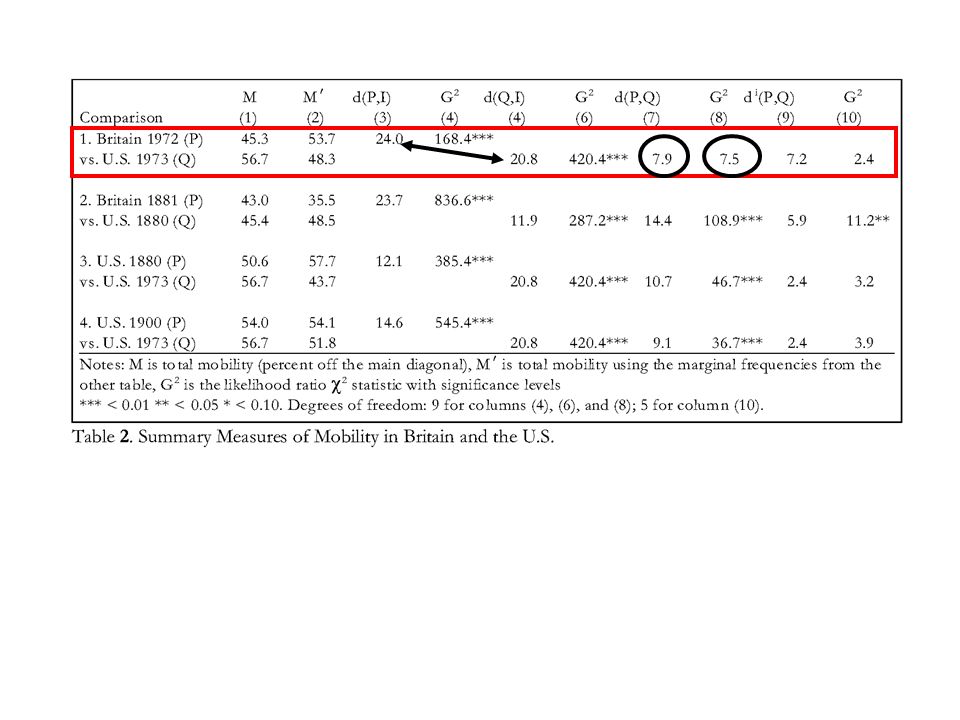
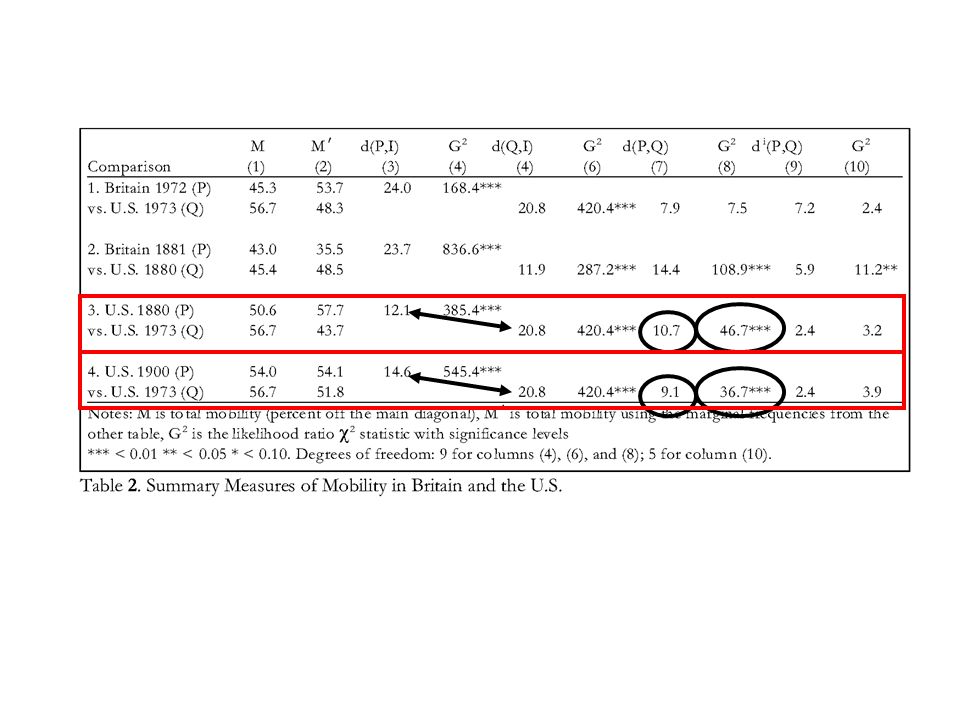
Test for statistical significance Control for different occupational structures –Do this by adjusting marginal frequencies in two tables being compared to a common margin

44
Father Skilled/ SonWhite Collar FarmerSemi Unskilled White CollarX X X X FarmerX X X X Skilled/SemiX X X X UnskilledX X X X [(Farm-Farm)/(Farm-Unsk)]/[(Unsk-Farm)/(Unsk-Unsk)] 11.6% [(Farm-Farm)/(Farm-Unsk)]/[(Skilled-Farm)/(Skilled-Unsk)] 9.8% [(WhCol-WhCol)/(WhCol-Unsk)]/[(Unsk-Whcol)/(Unsk-Unsk)] 9.3%
![Father Skilled/ SonWhite Collar FarmerSemi Unskilled White CollarX X X X FarmerX X X X Skilled/SemiX X X X UnskilledX X X X [(Farm-Farm)/(Farm-Unsk)]/[(Unsk-Farm)/(Unsk-Unsk)] 11.6% [(Farm-Farm)/(Farm-Unsk)]/[(Skilled-Farm)/(Skilled-Unsk)] 9.8% [(WhCol-WhCol)/(WhCol-Unsk)]/[(Unsk-Whcol)/(Unsk-Unsk)] 9.3%](http://images.slideplayer.com/16/4947043/slides/slide_44.jpg "Father Skilled/ SonWhite Collar FarmerSemi Unskilled White CollarX X X X FarmerX X X X Skilled/SemiX X X X UnskilledX X X X [(Farm-Farm)/(Farm-Unsk)]/[(Unsk-Farm)/(Unsk-Unsk)] 11.6% [(Farm-Farm)/(Farm-Unsk)]/[(Skilled-Farm)/(Skilled-Unsk)] 9.8% [(WhCol-WhCol)/(WhCol-Unsk)]/[(Unsk-Whcol)/(Unsk-Unsk)] 9.3%")
48
Model

52
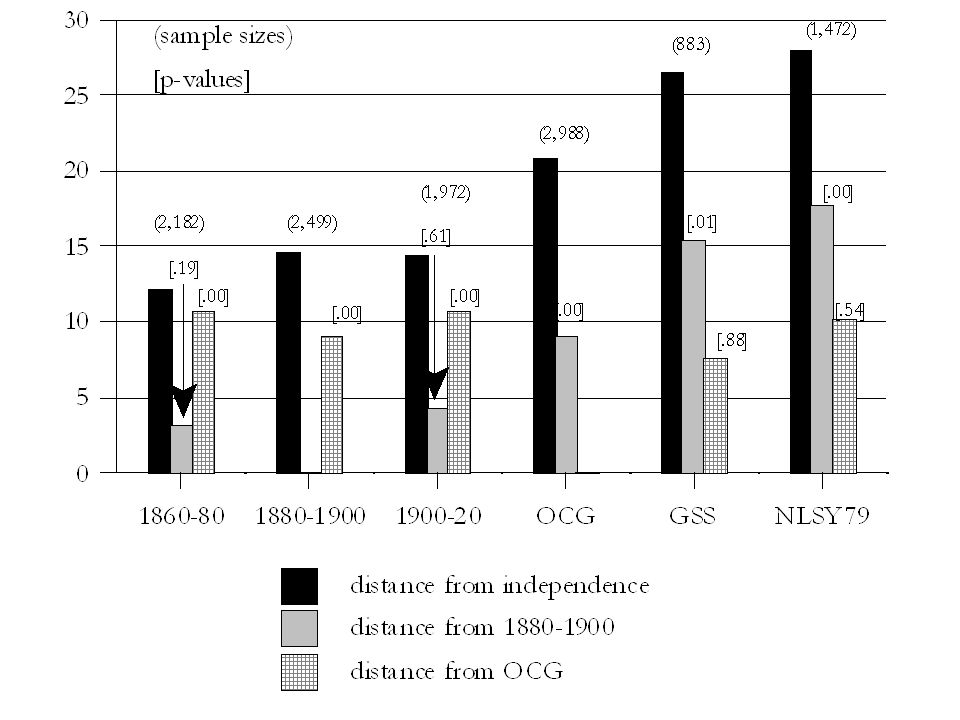
In 1870, 1890 England lags behind US Catches up in the 20 th century

58
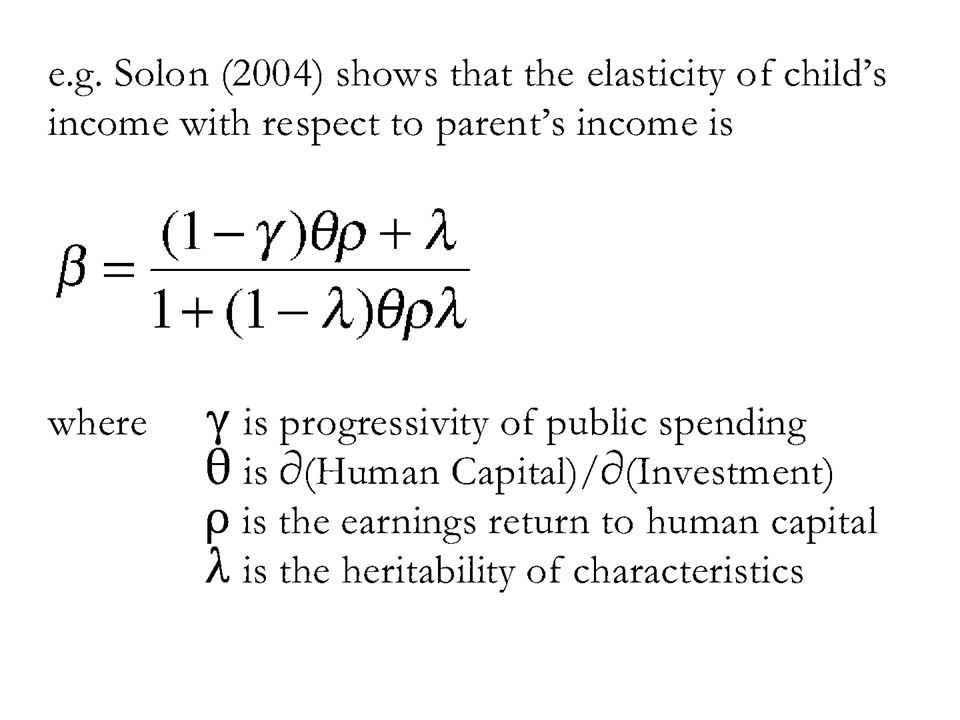
Comparing Mobility in Two Economies Simple two-generation human capital model generates clear predictions. Solon (1999, 2004), Becker and Tomes (1979, 1986): with the standard earnings elasticity regression function: the model above implies Back
, Becker and Tomes (1979, 1986): with the standard earnings elasticity regression function: the model above implies Back.")
Similar presentations


>")


