Download presentation
Presentation is loading. Please wait.

1
MODELING CLIMATE AND VEGETATIONAL CHANGE SINCE THE LAST GLACIAL MAXIMUM USING STABLE ISOTOPES AND DIGITAL ANALYSIS Pennilyn Higgins Florida Museum of Natural History Gainesville, FL loligo@earth.rochester.edu

2
Isotopes as environmental proxy C – Dietary proxy C3 vs C4 plants in herbivores C3 13 C lower than C4 13 C O – Climatic proxy 18 O increases with warmer temperatures 18 O decreases with high rainfall in warm weather

3
Outline An overabundance of data Geographical data Using the computer to sort it out Visualizing large data sets Making it look nice Real applications

4
Outline An overabundance of data Geographical data Using the computer to sort it out Visualizing large data sets Making it look nice Real applications

5
Data generation

6
One tooth; how many data points?

7
Database

8
Outline An overabundance of data Geographical data Using the computer to sort it out Visualizing large data sets Making it look nice Real applications

9
Plotting isotopic values against geographical information

10
Localities sampled

11
Stacked plots

12
Outline An overabundance of data Geographical data Using the computer to sort it out Visualizing large data sets Making it look nice Real applications

13
Database query

14
Plot and contour the data

15
Change your data and color scheme.

16
Look at a specific part of the fauna

17
…and compare with other species

18
Liven it up with color

19
…and get a closer look

20
Outline An overabundance of data Geographical data Using the computer to sort it out Visualizing large data sets Making it look nice Real applications

21
Exporting to other formats

22
Initial diagrams can be pretty ugly…

23
…but are easy enough to sharpen with other software

24
Plotting oxygen and carbon

25
Outline An overabundance of data Geographical data Using the computer to sort it out Visualizing large data sets Making it look nice A real applications

26
Full Glacial + Glacial Carbon

27
FG + G Bison and Camelops

28
FG + G Equus

29
Full Glacial + Glacial Carbon

30
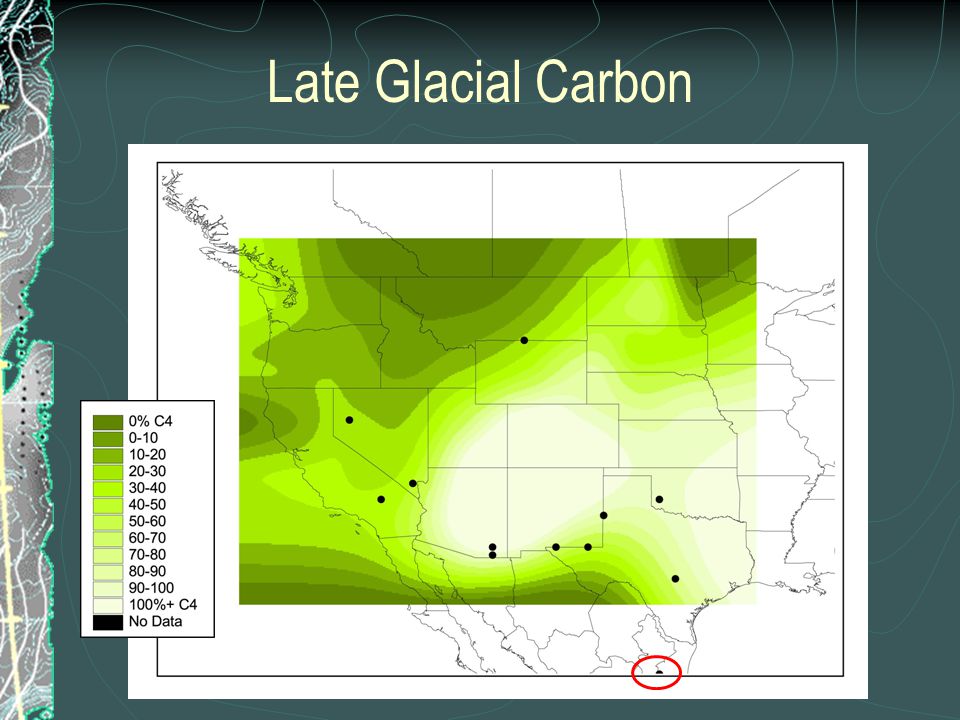
Late Glacial Carbon

32
Outline An overabundance of data Geographical data Using the computer to sort it out Visualizing large data sets Making it look nice Real applications

Similar presentations


![Earth System History GEOL 1020 [15] Announcements More about global geochemical cycles September 30, 2013.](/13/4150330/big_thumb.jpg "Earth System History GEOL 1020 [15] Announcements More about global geochemical cycles September 30, 2013.>")
>")


