Download presentation
Presentation is loading. Please wait.

2
Diagram of Colloid Particle and Its Surface Electrical Potentials

3
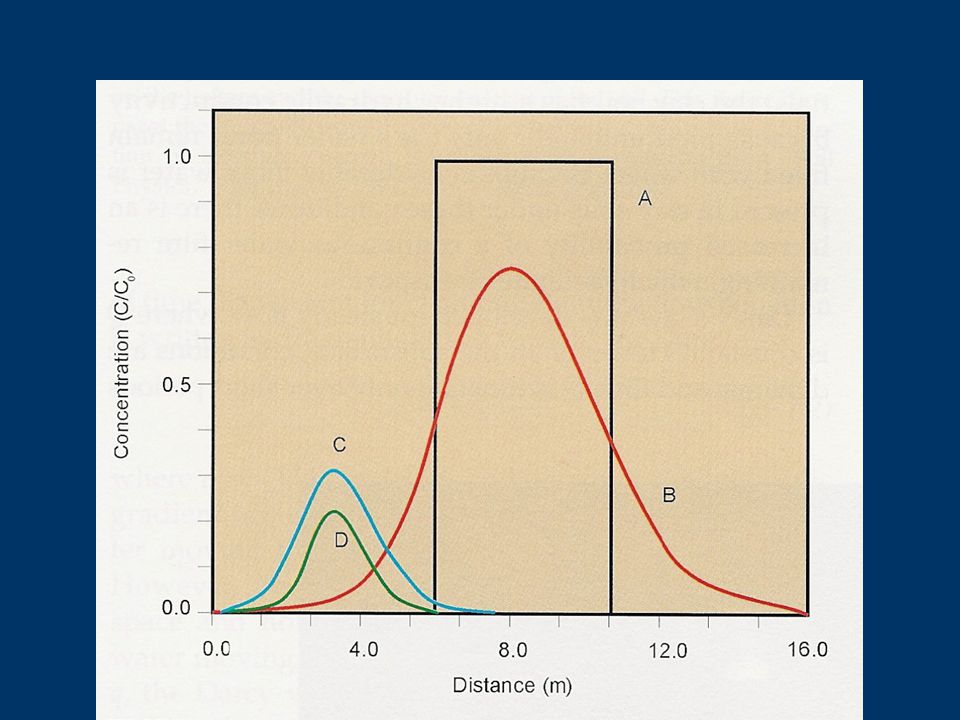
Colloidal Particles and their Charge Properties Colloids: small charged, suspended particles –Abiotic and biotic particles –Most microbes are colloids Particle surface has its own charge and a strongly bound layer of opposite charged counterions, called the Stern layer Positive ions are still attracted by a negative colloid and vice-versa Stern layer: the layer of the actual particle and its immediately bound counter ions. Beyond the Stern layer is a diffuse layer of ions that moves with the particle when it is in motion Zeta potential : the potential at the shear plane; the layer of bound ions that moves with the particle

6
Electrophoretic mobility of rNV particles (circles) and MS2 (squares) as a function of solution pH in the presence of 0.01 M NaCl.
 and MS2 (squares) as a function of solution pH in the presence of 0.01 M NaCl.")
8
Microbes on Surfaces: Fomitic Transmission John Scott Meschke Office: Suite 2338, 4225 Roosevelt Phone: 206-221-5470 Email: jmeschke@u.washington.edu

9
Myths STDS can be caught from Toilet seats –False: likely to catch diarrhea not gonorrhea Ammonia and vinegar kill germs –False: work on dirt, but not bacteria or viruses Telephones and doorknobs spread viruses –Maybe: not enough research for good conclusion; staph ear infections have been shown in teenagers Plastic cutting boards are better than wood; or vice versa –False: Actually a toss up, either should be disinfected after use

10
USEPA Default Exposure Factors Water~2L/day Soil/Dust200mg/day (child <6) 100mg/day (adult) Air15-20 m 3 /day 600 L/hr USEPA, 1997
 100mg/day (adult) Air15-20 m 3 /day 600 L/hr USEPA, 1997")
11
Shedding and Infectious Dose OrganismShedding Infectious Rate (per gram) Dose HAV 10 6 <100 Norovirus 10 5 -10 9 10-100 Rotavirus10 6 -10 10 <100 Salmonella10 4 -10 11 10 4 -10 6 Shigella10 5 -10 9 10 2 -10 4 Giardia 10 5 ~100
 Dose HAV 10 6 <100 Norovirus Rotavirus <100 Salmonella Shigella Giardia 10 5 ~100")
12
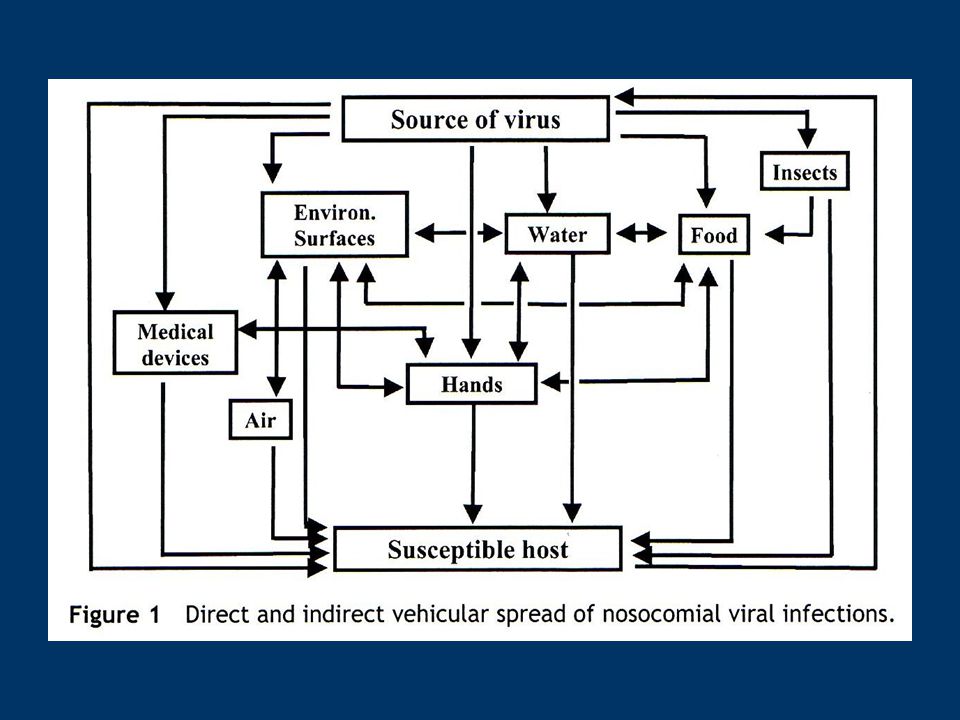
Surface Transmission Mechanical Vector –E.g. hands Fomites –Inanimate surfaces Food??

14
What surfaces can transmit pathogens?

15
Pathogen Survival on Surfaces What does it mean? What are the important things to know in order to understand it? Why is it important?

16
e.g. Virus Survival on Surfaces Non-Enveloped Viruses –Poliovirus has been shown to survive for up to 20 weeks on wool blanket fabric (Dixon, 1966) –HAV has been recovered from stainless steel surfaces after 96 hours; and from plastic surfaces after 1 month (Mbithi, 1991) –Rotavirus may persist for up to 10 days (Sattar, 1986) Enveloped Viruses –Influenza may persist for several days to weeks on dust, cotton sheets, and glass slides (Edward, 1941); 24-48 hours on other hard surfaces (Bean et al, 1982) –RSV was reduced by 2 log 10 after 24 hours (Kingston, 1968) –Parainfluenza virus may persist up to 12 days on plastic surfaces (Parkinson, 1983) –Human Coronavirus has been shown to persist up to 6 hours with 1-2 log 10 reduction
 –HAV has been recovered from stainless steel surfaces after 96 hours; and from plastic surfaces after 1 month (Mbithi, 1991) –Rotavirus may persist for up to 10 days (Sattar, 1986) Enveloped Viruses –Influenza may persist for several days to weeks on dust, cotton sheets, and glass slides (Edward, 1941); hours on other hard surfaces (Bean et al, 1982) –RSV was reduced by 2 log 10 after 24 hours (Kingston, 1968) –Parainfluenza virus may persist up to 12 days on plastic surfaces (Parkinson, 1983) –Human Coronavirus has been shown to persist up to 6 hours with 1-2 log 10 reduction.")
17
Surface Sampling Current Methods (5-90% recoveries, generally poorly characterized) –Swabs (better for gram negatives?) Cotton Dacron Calcium Alginate (may inhibit PCR and be toxic to cell culture) Sponge (Polyurethane and Cellulose) –Swipes/Wipes Cotton Nitrocellulose membranes Polyester bonded cloth Velvet or Velveteen –Vacuum Filtration Hepa bag vac Wet Vac –Rinse/Elute –Contact Plates and Paddles (RODAC) (better for gram positives?) New Methods –Adhesive Strips and Paddles –Scraping/Aspiration Yamaguchi, et al. 2003; Cloud, et al. 2002; Lemmen, et al, 2001; Poletti, 1999; Craythorn, et al. 1980; Osterblad, et al. 2003; Taku, et al. 2003

18
Recovery from Surfaces Factors that may affect the recovery of microbes from surfaces: –Method selection Particle size bias –Surface composition –Surface topography/roughness –Organism type and Distribution –Sample size –Target of detection method to be utilized

19
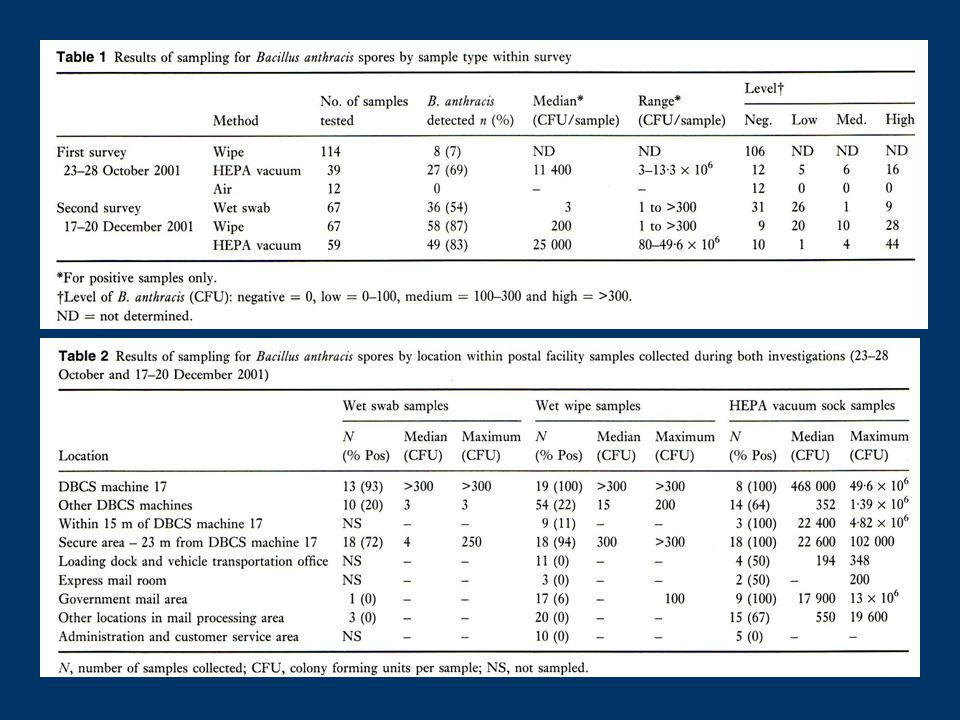
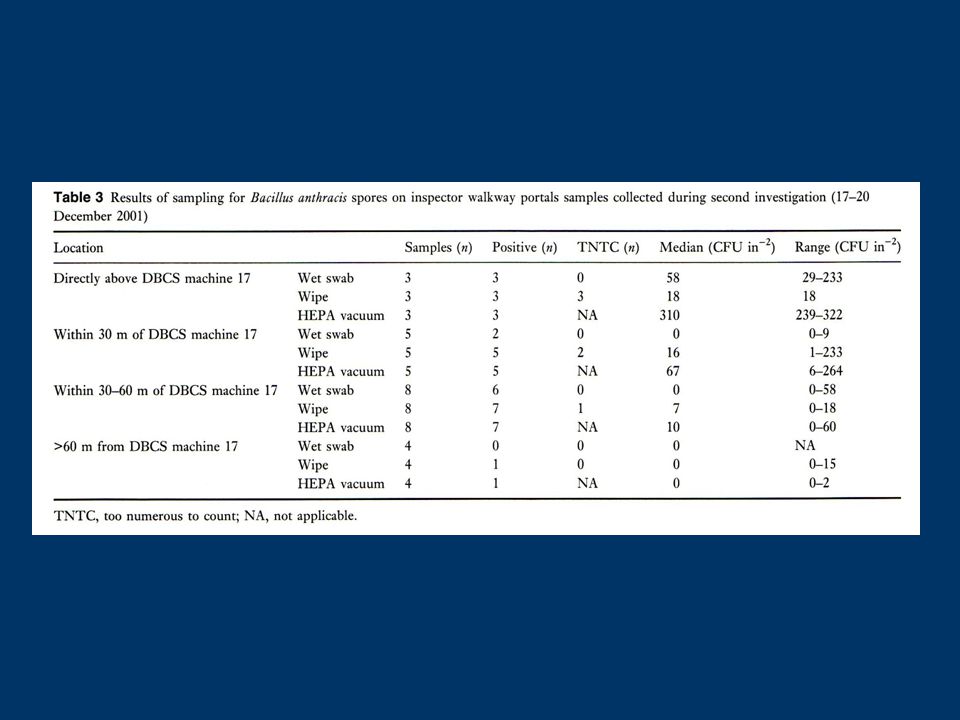
Sanderson et al –Methods Survey 1 –surface wipe, HEPA vacuum, air filters Survey 2 –surfaces swabs incorporated –Reported separately

20
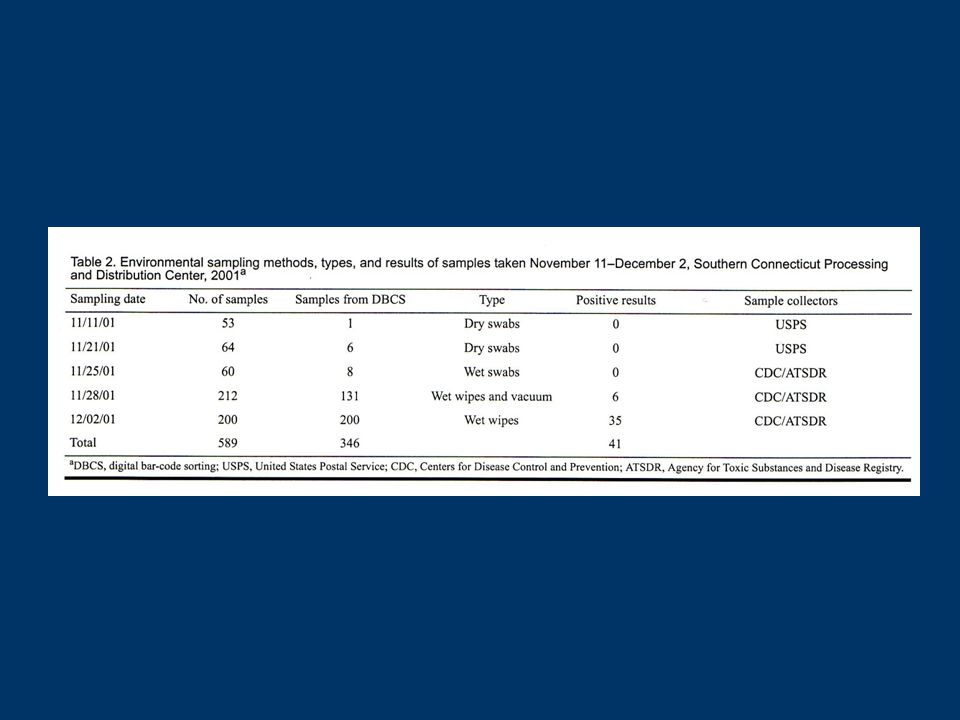
Surface Sampling From anthrax investigations, methods performed in parallel Dry Swabs(<25%) Wet Swabs (~50%) Hepa Vac(~80%) Wipe(~85%) Teshale, et al. 2002; Sanderson, et al. 2002.

23
Teshale et al--Methods Nov 11 –Dry synthetic swabs by contractor Nov 21 –Dry swabs by 2 nd contractor Nov 25 –Wet synthetic swabs investigation team Nov 28 –Wet synthetic wipes and HEPA vacuum samples Dec 2 –Additional wet wipe samples

26
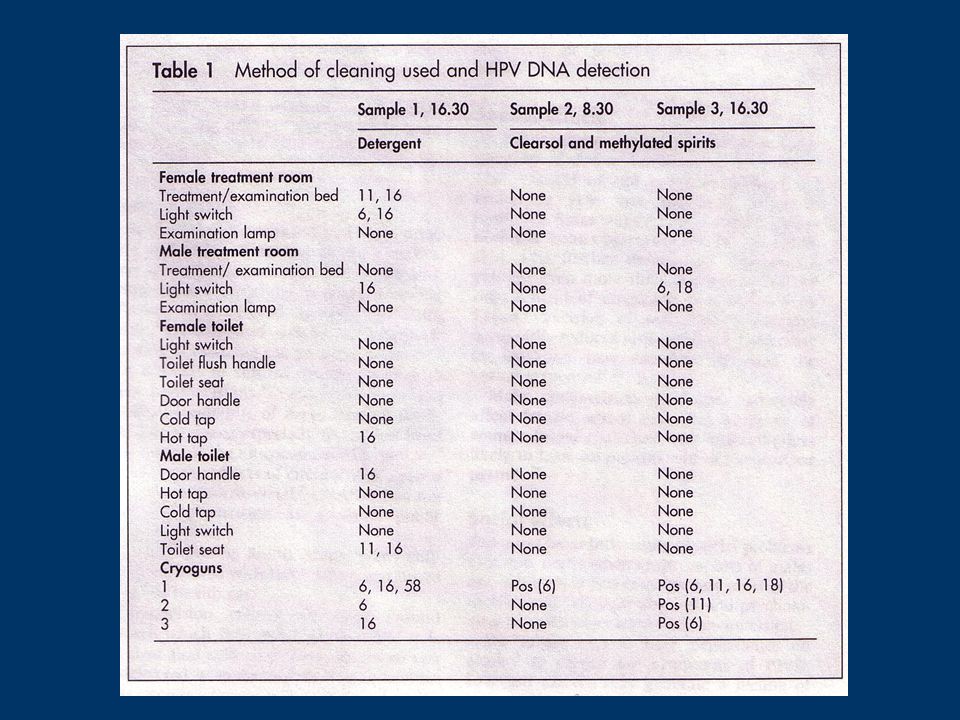
Contamination of Clinic Surfaces with HPV Treatment rooms, toilets and cryoguns tested for accumulation of HPV after 1 day Decontamination day 1 with detergent and water (50% reduction in quantity, 73% reduction in type) Decontamination day 2 with detergent in alcohol
 Decontamination day 2 with detergent in alcohol")
28
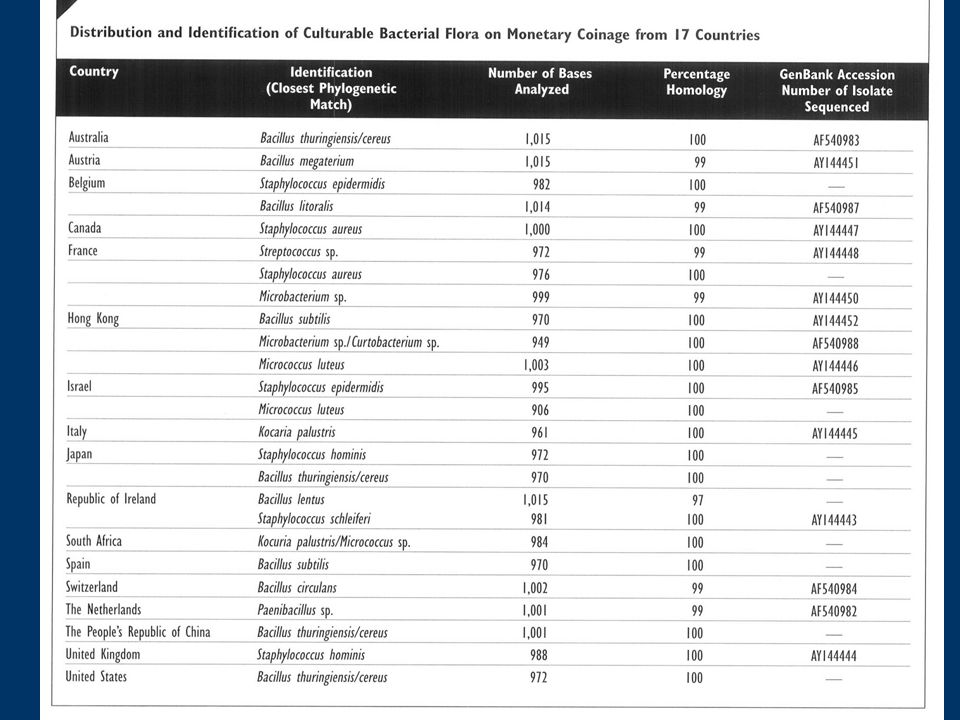
Microbes on Currency HSV –Little or no loss in 30 minutes –2-3 log loss between 30-60 minutes –On penny some viable virus detected at 2 hours Fecal Bacteria (in Rangoon) –0-10 7 cfu of TC or FC /sq cm –E.coli, Vibrio and Salmonella Pathogens isolated from money received from butchers and fish mongers.
 – cfu of TC or FC /sq cm –E.coli, Vibrio and Salmonella Pathogens isolated from money received from butchers and fish mongers.")
30
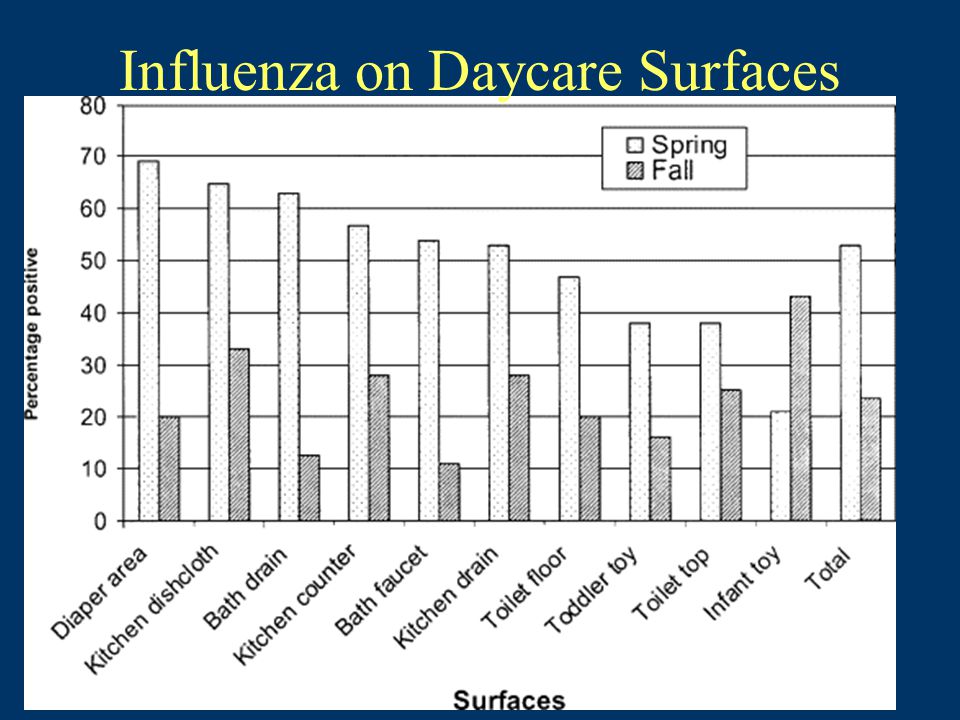
The Occurrence of Influenza A Virus on Household and Day Care Center Fomites S.A. Boone and C.P. Gerba

31
Influenza on Daycare Surfaces

33
Influenza Positive Surfaces in Daycare

34
Moist vs. Dry Surfaces

35
In the Home

36
Safe at Home? 2/3 of all viruses caught at home; more if young children present –At a day care center upto 50% of toys are contaminated with rotavirus 50-80% of foodborne illness caught at home Typical kitchen sink contains more fecal bacteria than typical flush toilet

37
Most Contaminated Areas Common Characteristics –Moist environments –Frequently touched 5 Worst Hot Zones –Sponges and Dishclothes (7 billion bacteria/sponge) –Sink Drain Areas –Sink Faucet Handles (229,000 bacteria/square inch) –Cutting Boards (wood or plastic ~62,000 bacteria/square inch –Refrigerator Handles Of 14 studied areas, Toilet seat was dead last for contamination
 –Sink Drain Areas –Sink Faucet Handles (229,000 bacteria/square inch) –Cutting Boards (wood or plastic ~62,000 bacteria/square inch –Refrigerator Handles Of 14 studied areas, Toilet seat was dead last for contamination")
38
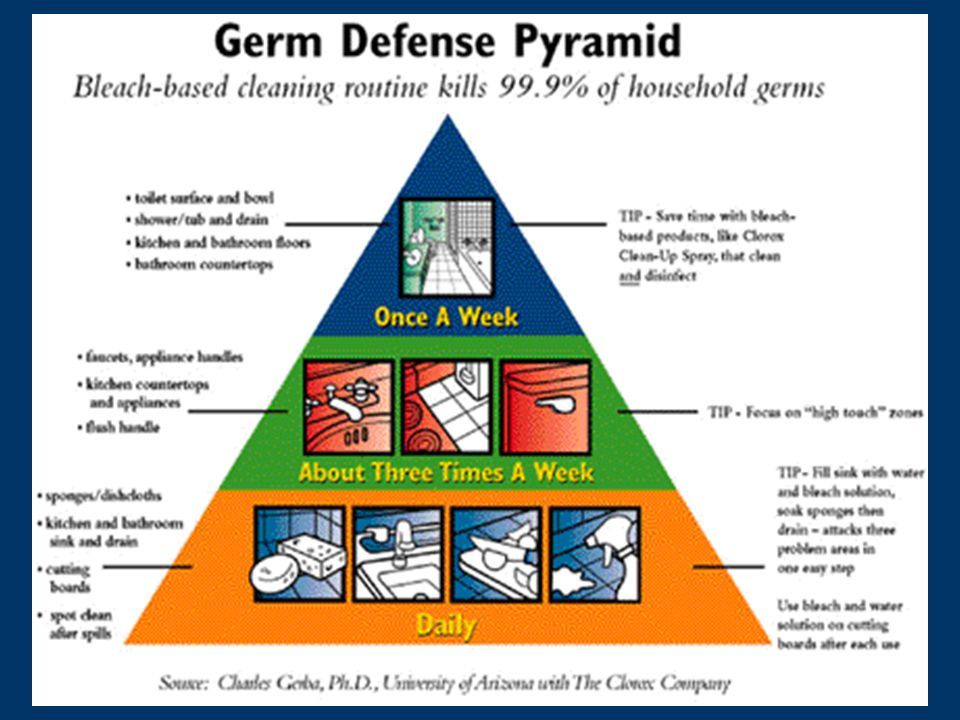
Germ Defense Pyramid Daily: –Sponges, dishclothes, sink and drain areas –Cutting boards after each use (esp. after meat) –Spills as they occur Several times per week: –High touch zones in kitchen and bathroom, e.g. toilet flush handles, faucet handles, high traffic zones on floors of kitchen and bath Weekly –Toilets, countertops, showers, tubs and drains –Entire kitchen and bath floors
 –Spills as they occur Several times per week: –High touch zones in kitchen and bathroom, e.g. toilet flush handles, faucet handles, high traffic zones on floors of kitchen and bath Weekly –Toilets, countertops, showers, tubs and drains –Entire kitchen and bath floors.")
40
Pathogens in Laundry E. coli and Salmonella Enterococci Streptococci and Staphylococci Acinetobacter

41
In Household Study: 100 homes 60% had fecal coliforms 10% had E.coli 40% of sterile cloths washed in unbleached laundry picked up fecal bacteria At high temperatures (131F) some bacteria (E.coli) killed, however some Salmonella survived –As did HAV, Rotavirus and Adenovirus
 some bacteria (E.coli) killed, however some Salmonella survived –As did HAV, Rotavirus and Adenovirus")
42
Poor Laundry Practices Most people use cold water or at best warm to wash –5% of Americans still use hot People mix their loads People don’t use much bleach –15% of all wash loads use bleach (50% of white loads) Wash cycles are becoming shorter –12 min wash, 28 min dry
 Wash cycles are becoming shorter –12 min wash, 28 min dry")
43
Recommended Practices Pre-sort laundry into separate bags to limit contact (esp. in hosptials) Use bleach whenever possible Wash in hot water when possible Run empty bleach load after contaminated load
 Use bleach whenever possible Wash in hot water when possible Run empty bleach load after contaminated load.")
44
Toilet Trivia Cloacina- Roman Goddess of the Sewer Thomas Crapper- Inventor of the Flush Toilet Toilet paper usage –Men 2 squares/dispense –Women 7 squares/dispense –Men fold, Women crumple Women have the dirtiest bathrooms by far –Hot Zones: under sanitary napkin disposals, floor and sink; Door knobs surprisingly clean Average Employee uses Bathroom 3.3 times/day (women spend twice as long as men) Toilet stall nearest the door is the cleanest Best Bathrooms: Hospital Emergency Room and Fast Food Restaurants; Worst: Airports, Bus Stations More stalls generally = cleaner
 Toilet stall nearest the door is the cleanest Best Bathrooms: Hospital Emergency Room and Fast Food Restaurants; Worst: Airports, Bus Stations More stalls generally = cleaner")
Similar presentations


 2.>")


