Download presentation
Presentation is loading. Please wait.

1
Welcome to Survey of Research Methods and Statistics! PS 510

2
Why are you taking this course? “It’s required for my major and I need it to graduate.” “I don’t know…I will never conduct research after this course.” “My advisor told me to take it.” This class is important for your life beyond Caldwell College!

3
Goal of this Course To help you think like a scientist about behavior. To help you evaluate the results of psychological research.

4
Why Conduct Research? Progress in science: based on new facts that lead to new theories. Research advances our scientific understanding about a problem.

5
Why Conduct Research? Progress in science: based on new facts that lead to new theories. Research advances our scientific understanding about a problem. –Ex: Tells us that reading is an automatic process –Allows us to make predictions - good readers may have more difficulty when 2 processes are combined compared to not good readers. Research allows for practical applications: –What reading methods work to improve reading?

6
How do we evaluate research? Become a critical thinker Experiment –attempt to determine cause-effect relations in the world. –Ex: the effects of inhibiting reading on the time it takes to count digits Composed of: –Independent variable (IV) –Dependent variable (DV) –Control variables
 –Dependent variable (DV) –Control variables.")
7
Independent Variable A factor the experimenter directly manipulates – “cause” part of cause-effect relation –must have at least 2 values or levels Ex:1 IV – lighting 2 levels: normal lighting vs. bright lighting 2- IV – type of music 3 levels: Rock vs. classical vs. no music

8
Dependent Variable -The response or behavior being measured. -The results that depend on the manipulation of the IV -“effect” part of cause-effect relation Ex 1: measuring productivity of workers Ex 2: number of math problems solved correctly

9
Control Variables Variables that are held constant throughout the experiment. Reduce the chances that differences between conditions are caused by something other than the effects of your IV. Ex: 1: the duration of the time the workers worked. All workers worked 8 hour shift in each condition. Ex 2: the type of math problems students completed. All students completed problems of medium difficulty in each condition.

10
Confounding Variables Undesirable variable that may influence the DV and change results. Confound is present when 2 factors are varying together in the experiment. Important to avoid to be clear of cause-effect relations.

11
Trial 2 Trial 1 Trial 3 Ex: Coke vs. Root Beer vs. Pepsi Challenge

12
General Steps in Research 1.Get an idea 2.Review the literature 3.Prepare a testable hypothesis 4.Research Design 5.Conduct pilot research 6.Conduct research 7.Analyze results 8.Interpret the results 9.Prepare manuscript or presentation

13
Research Ideas Find a gap in current knowledge Good ideas are: 1) testable 2) approximate reality
 testable 2) approximate reality")
14
Sources of Knowledge Psychologists seek new knowledge. Validity – degree to which a knowledge claim is accurate. 4 sources of beliefs: tenacity, authority, rationalism, scientific method (empirical) 1- Tenacity – acceptance due to repetition of information. – sometimes the information may not be true.
 1- Tenacity – acceptance due to repetition of information. – sometimes the information may not be true..")
15
Sources of Knowledge 2- Authority acceptance of knowledge from “authorities” ex- pharmacist, TV star, lawyers, teachers

16
Sources of Knowledge 3- Rationalism –belief is based on a reasonable assumption –lacks proof or study to support the claim –deals with form of reasoning and not its content Ex: “The world is flat.”

17
Sources of Knowledge 4- Scientific Method empiricism: fixing beliefs based on experience and objective observations. Scientific data is comes from observations that can be repeatedly obtained by others. Self-correcting: new beliefs are compared to old beliefs. Old beliefs are discarded if they do not fit the data.

18
Scientific Approach Advantages –Objectivity –Open to public scrutiny and ability to verify results –Self-correction of errors –Use of control variables to rule out unwanted factors or to manipulate a factor of importance to research

19
DATA (empirical observations) SCIENCE data THEORY
 SCIENCE data THEORY")
20
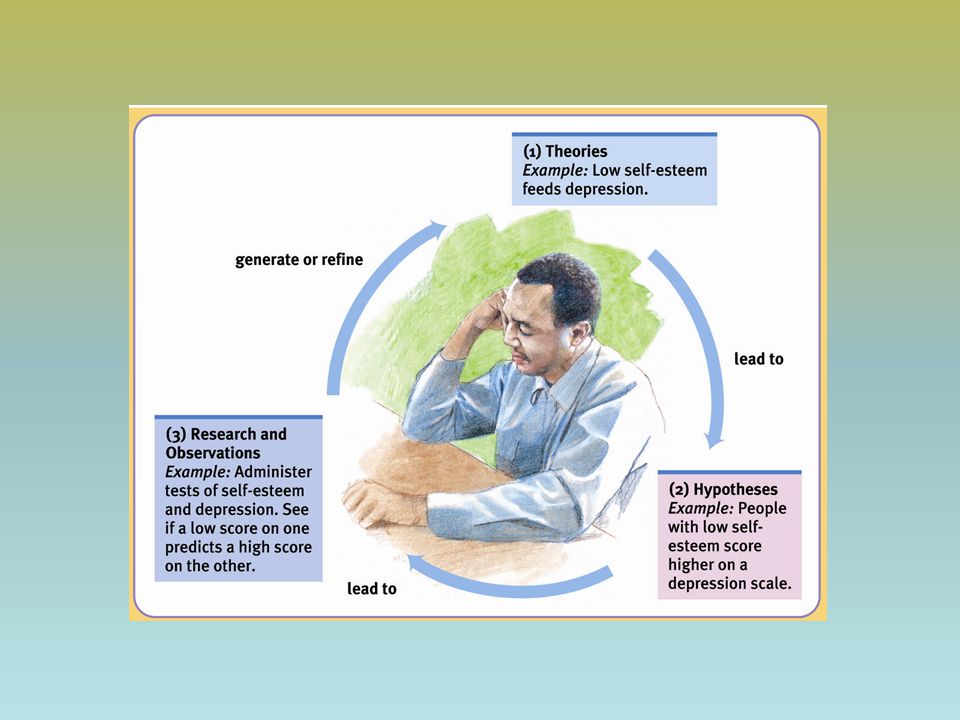
Research Process Theory –Organizes and explains data –Offer predictions when no new data is available –Characteristics: –1. testable –2. parsimonious- short, concise and to the point –3. precise

21
Research Process Hypothesis –Specific statement about relations between IVs and DVs –How variables will be measured? –How variables will be related? –Research or experimental hypothesis: the experimenter’s predicted outcome of a study. Must indicate the IV and DVs in the statement students who are paid based on their reaction time during a group activity are less likely to show social loafing than students who are not paid to perform a task. IV: payment (Yes vs. No $) DV: reaction time
 DV: reaction time.")
22
Directional vs. Nondirectional Hypotheses Directional hypothesis: makes specific prediction about the direction of the outcome. –Ex: reaction time will be faster for group A than group B. Nondirectional hypothesis: does not predict direction of outcome; predicts that groups will differ. –Ex: reaction time will differ between group A and group B.

23
Testable Hypotheses 1) consuming sugar and violent behavior Children who consume 15 grams of sugar per day report higher levels of violence (times they hit a bobo doll) than children who do not consume 15 grams of sugar per day. 2) Listening to loud music using headphones and hearing ability. Individuals who listen to music above 60 decibels using headphones for 20 minutes per day show decreased ability to detect sounds below 40 decibels. Operational definitions: the definition of a variable in terms of the operations (activities) a researcher uses to measure or manipulate it. allows other researchers to study the topic in a similar way.
 Listening to loud music using headphones and hearing ability. Individuals who listen to music above 60 decibels using headphones for 20 minutes per day show decreased ability to detect sounds below 40 decibels. Operational definitions: the definition of a variable in terms of the operations (activities) a researcher uses to measure or manipulate it. allows other researchers to study the topic in a similar way..")
24
Research Process THEORY DATA Hypotheses

25
Principle of Falsifiability A scientific theory or hypothesis must be stated in a way that it is possible to disconfirm it. –must predict what will happen and what will not happen. It cannot “cover all the bases.” If sufficient evidence is obtained that falsifies a theory, then the theory must be modified (or discarded). If the theory survives many tests that try to falsify it, then the theory has more evidence to organize information and make predictions.
. If the theory survives many tests that try to falsify it, then the theory has more evidence to organize information and make predictions..")
Similar presentations