Download presentation
Presentation is loading. Please wait.

1
Wind Resource Estimation Using Data in the Public Domain Group 3 Alex Thomson Arnaud Eté Isabel Reig Montané Stratos Papamichales

2
Academic Supervisor: - Dr Nick Kelly Contacts at SgurrEnergy: - Richard Boddington - Neil Doherty - Jenny Longworth

3
Plan for the Presentation 1.Brief description of key background points. 2.Processing of the raw data. 3.Description of the methodology. 4.Description of the modelling software WAsP. 5.Application in Scotland / Validation of the results. 6.Case studies in India / Results. 7.Uncertainty of the wind resource prediction. 8.Conclusion.

4
Novelty of our Project Current method of wind estimation: Site survey. Meteorological mast erected for at least 12 months (between £15,000 and £22,000 in the UK). Correlation with long term data from a nearby meteorological station. It’s not always possible to set up a mast and have a nearby weather station. Novelty of our project: create a model to predict wind resource in any given location by using reanalysis data, topographic maps and Google Earth (all freely available on Internet),
. Correlation with long term data from a nearby meteorological station. It’s not always possible to set up a mast and have a nearby weather station. Novelty of our project: create a model to predict wind resource in any given location by using reanalysis data, topographic maps and Google Earth (all freely available on Internet),.")
5
Aims of our Project Establish a methodology to estimate the wind resource of any site. Test the compatibility between the reanalysis data and the modelling tool WAsP. Verify the accuracy of this methodology by applying it to well- known sites in the UK before using it to identify a few good sites in India. Determine whether the methodology is suitable to estimate the wind resource of a site as a substitute to site survey and erection of meterological mast.

6
The Reanalysis Project Joint project between the NCEP and the NCAR. Project created to reanalyse historical atmospheric data. Aim was to build a Climate Data Assimilation System. The observations include: Balloon soundings, Surface marine data, Aircraft data, Satellite measurements. These are all real observations, not output from a numerical model. Data available from 1948 to the present. Second improved version from 1979 onwards. Use of 27 years of reanalysis data in this project.

7
The Shuttle Radar Topography Mission Joint project between the National Geospatial Intelligence and the National Aeronautics and Space Administration (NASA). Produced digital topographic data of the Earth’s land surface (between 60ºN and 56ºS latitude). Data points located every 3-arc-second on a latitude/longitude grid. Format incompatible with WAsP. Required some modifications.
. Data points located every 3-arc-second on a latitude/longitude grid. Format incompatible with WAsP. Required some modifications..")
8
Google Earth Provides high quality satellite imagery. Covers the entire globe. Used in this project to identify terrain characteristics.

9
Data Processing

10
Reanalysis Data Processing West to East and South to North components of the wind collected every 6 hours (4x daily)
")
11
Topographical Maps: from SRTM Data to WAsP Maps SRTM data obtained from the NASA Website incompatible with WAsP and cannot be directly used: coordinates transformed from latitude/longitude grid to UTM coordinates. raw data processed into a contour map.

12
Simulation with WAsP

13
How WAsP Works WAsP calculates a Wind Atlas (geostrophic wind) using the wind data of a reference site and considering the terrain roughness, contours and obstacles of the site. The Wind Atlas is transferred to the potential turbine site (considered as representative for both sites). WAsP generates the wind climate of the potential site taking into account the terrain conditions at the site. Diagram taken from WAsP website
. WAsP generates the wind climate of the potential site taking into account the terrain conditions at the site. Diagram taken from WAsP website.")
14
The Methodology

15
Case Sites in the UK

16
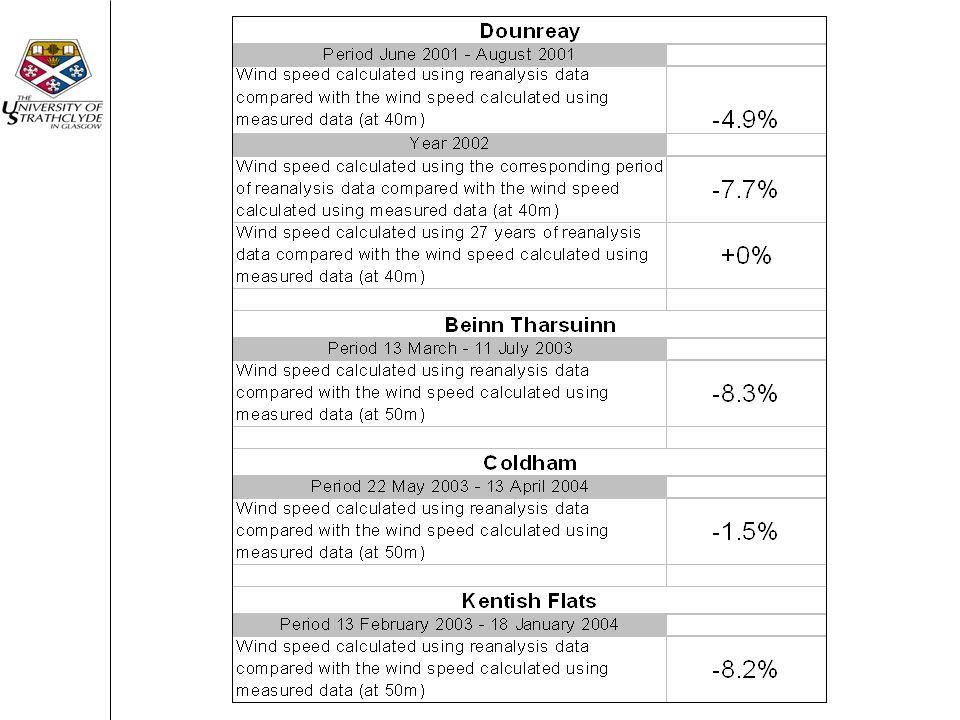
3 wind farms: – Dun Law – Hagshaw – Elliots Hill 6 meteorological masts: – Dounreay – Beinn Tharsuinn (3) – Coldham – Kentish Flats
 – Coldham – Kentish Flats")
17
Correlation between Measured and Reanalysis Data

18
Example of Dun Law

19
Results

22
Additional Errors to Consider The turbine availability: nominal loss of 3%. Power curve density correction: – Dun Law: - 2% – Hagshaw: - 2% – Elliots Hill: - 1% Power curve performance: nominal loss of 0.83%. Wind hysteresis: loss of 0% - 0.5%. Blade contamination: nominal loss of 0.5%. Total additional losses ≈ 7%

23
Discussion It is clear that the introduction of the roughness estimate has a significant effect on the model. Roughness estimate (from Google Earth) gives a more accurate prediction. Results for the wind farms are within 15% of the actual power produced (within 10% using 27 years of reanalysis data). The results appear good enough to justify an application of the methodology in India in order to get a first approximation of the wind resource of the sites.
 gives a more accurate prediction. Results for the wind farms are within 15% of the actual power produced (within 10% using 27 years of reanalysis data). The results appear good enough to justify an application of the methodology in India in order to get a first approximation of the wind resource of the sites..")
24
Case Sites in India

25
Gujarat Tamil-Nadu

26
Elements to Consider in Locating the Turbines The power density map. The «isoslope maps»: the maximum slope to build a turbine is 10°. The capacity factor of the farm. Gujarat 1

27
Results and Performance of the Wind Farms > 30%: good > 25%: ok < 25%: poor SiteCapacity Factor in % UK Dun Law27.3 Hagshaw27.5 Elliots Hill35.2 India Gujarat 125.3 Gujarat 221.3 Tamil Nadu19.5

28
Estimation of the Energy Production

29
Uncertainty of the Wind Prediction

30
Reanalysis data Topographical maps Prediction by WAsP Sources of Error in the Wind Prediction

31
Accuracy of WAsP Prediction The conditions to fulfil to obtain an accurate predictions using WAsP are: – The whole area is clearly subject to the same weather regime. – The prevailing weather conditions are close to being neutrally stable. – The surrounding topography is sufficiently gentle and smooth to ensure that flows stay attached and that large-scale terrain effects such as channelling are minimal. – A good quality of data. – A proper use of the WAsP program.

32
Factors Affecting the Prediction Process Atmospheric Conditions Orography Weibull Frequency Distribution Wind Direction

33
Project Outputs General methodology: use of publicly available data with computer modelling tool. Algorithm for transforming reanalysis data into WAsP format. Configuration of WAsP to use reanalysis data. Methodology validation process. Error estimation of the methodology. Site selection process.

34
The Methodology Summed Up

35
Conclusion After processing, reanalysis and SRTM data can be used with WAsP. The reanalysis data appears to be suitable to estimate the wind resource of any given site. The results for our case sites in the UK stay within 10% of the actual energy produced using 27 years of reanalysis data. However, the methodology was only validated on 2 sites. Further studies at different sites should be carried out to confirm the suitability of the methodology.

36
Questions ?

Similar presentations


 by direct comparison of.>")


