Download presentation
Presentation is loading. Please wait.

1
An Introduction to GIS & the Role of Spatial Data CVEN 2012 – Geomatics University of Colorado – Boulder April 2006 Alyssa McCluskey Sources: Briggs (U of Texas – Dallas), Engel et al. (Purdue University), Martin (CEE), ESRI, ETH
, Martin (CEE), ESRI, ETH.")
2
Next 3 Weeks Week 1 Intro to GIS Learning ArcGIS Module 1 Week 2 Spatial Analyst Module 1 Survey Data Week 3 Other GIS techniques Review

3
Today’s Topics What is GIS? What is a GIS analysis? What can GIS do? Data Sources Data Representation Example GIS Analyses GIS Software ESRI On-Line Courses Labs

4
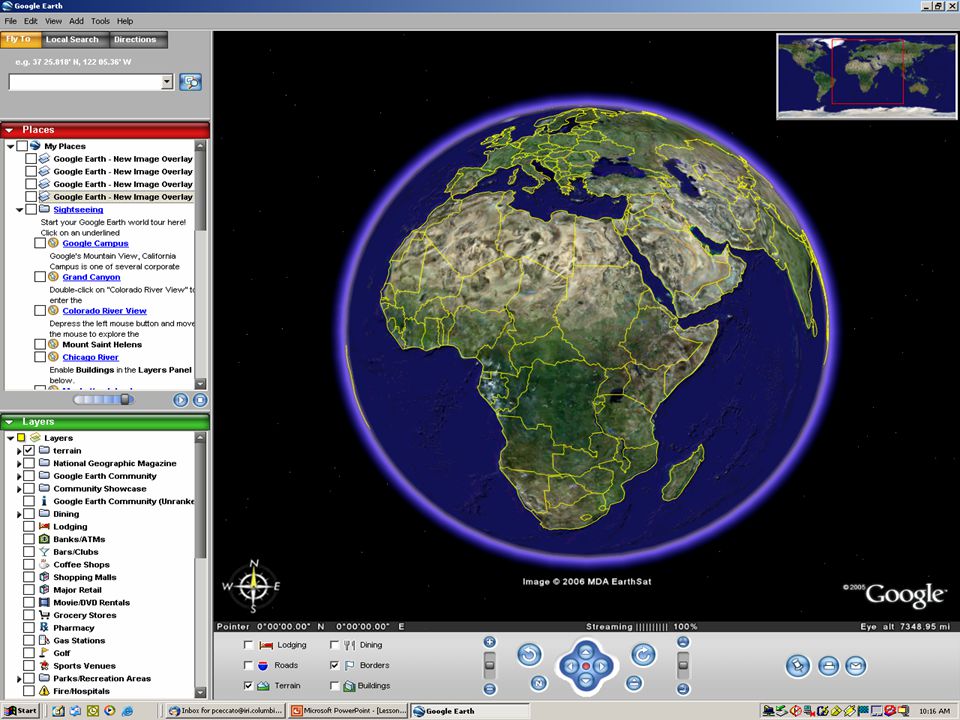
What is GIS? Geographic/Geospatial Information Science/System –information about places on the earth’s surface –knowledge about “what is where when” Began in mid-1960’s a computerized data management system designed to capture, store, retrieve, analyze and report geographic and demographic information (Siemens) an organized collection of computer hardware, software, geographic data, and personnel designed to efficiently capture, store, update, manipulate, analyze, and display all forms of geographically referenced information (ESRI- Environmental Systems Research Institute)
 an organized collection of computer hardware, software, geographic data, and personnel designed to efficiently capture, store, update, manipulate, analyze, and display all forms of geographically referenced information (ESRI- Environmental Systems Research Institute).")
5
GIS Analysis A process for looking at geographic patterns in data and at relationships between features May be simple (making a map) May be complex, using models that combine many data layers
 May be complex, using models that combine many data layers")
6
What can GIS do? It allows users to quickly: –Search –Display –Analyze –Model (spatially and temporally) information. A good GIS should be able to answer the following questions: –Location, conditions, trends, patterns, modeling
 information. A good GIS should be able to answer the following questions: –Location, conditions, trends, patterns, modeling.")
7
What can GIS do? Location: What is at…? 10 km N

8
What can GIS do? Condition: Where is it…?

9
What can GIS do? Trends: What has changed since…?

10
What can GIS do? Modeling: What if…?

11
Data Sources

12
Satellites: Satellites: Configuration of Global Observing System -Geostationary (equator) -Polar-orbiting
 -Polar-orbiting")
13
Terms Spatial resolution refers to the area on the ground that an imaging system, such as a satellite sensor, can distinguish. (e.g. datasets 30m, 1m) Orthophotography: Digital imagery in which distortion from the camera angle and topography have been removed, thus equalizing the distances represented on the image.
 Orthophotography: Digital imagery in which distortion from the camera angle and topography have been removed, thus equalizing the distances represented on the image..")
14
LANDSAT 30 m Spatial Resolution

15
1 m Spatial Resolution

17
Example On-Line Data Sources U.S. Bureau of the Census www.census.gov www.census.gov –Demographic data, socioeconomic, agricultural summaries U.S. Geological Survey (USGS) www.usgs.gov www.usgs.gov FGDC Clearinghouse (Federal Geographic Data Center)www.fgdc.govwww.fgdc.gov –Access to state and national agency datasets
 FGDC Clearinghouse (Federal Geographic Data Center) –Access to state and national agency datasets.")
18
Data Representation Maps: 2-dimensional representation of 2-dimensional world Tables: 2-dimensional representation of information

19
Data Representation Multiple maps (or layers) may be analyzed simultaneously Digital Orthophoto Streets Hydrography Parcels Buildings Zoning Utilities Administrative Boundaries
 may be analyzed simultaneously Digital Orthophoto Streets Hydrography Parcels Buildings Zoning Utilities Administrative Boundaries")
20
Data Representation Data is Geo-referenced Different Map Projections (Mercator, Lambert, Albers Equal Area, etc.)
")
21
Data Representation Multiple maps (or layers) may be analyzed simultaneously
 may be analyzed simultaneously")
22
Data Representation roads hydrology topography longitude latitude Layers are comprised of two data types Spatial data which describes location (where) Attribute data specifying what, how much,when Layers may be represented in two ways: in vector format as points and lines in raster (or grid) format as pixels latitude
 Attribute data specifying what, how much,when Layers may be represented in two ways: in vector format as points and lines in raster (or grid) format as pixels latitude")
23
Spatial Data - Vector Point Point - a pair of x and y coordinates (x 1,y 1 ) Line Line - a sequence of points Polygon Polygon - a closed set of lines Node vertex Vector data are defined spatially:
 Line Line - a sequence of points Polygon Polygon - a closed set of lines Node vertex Vector data are defined spatially:")
24
Spatial Data – Raster (Grid)
")
25
Grided Data Grids or pixels

26
Grided Data Grids or pixels

27
Grided Data Grids or pixels

28
Spatial Data – Raster (Grid)
")
29
Spatial Data – Vector & Raster Point Line Polygon VectorRaster Zone of cells Raster data are described by a cell grid, one value per cell

30
Spatial Data – Vector & Raster Real World Raster Representation line polygon point Vector Representation

31
Spatial Data – Vector & Raster

32
Spatial Data – Vector & Raster Mix

33
Spatial Data – Vector & Raster Which Type is Better? It depends on –The application –The data available –The analysis being conducted Take advantage of strengths of each. Converting between representations is easy.

34
Example Analysis: Hydrologic Cycle

35
Hydrologic Data

36
GIS Analysis Frame the question –What areas of the country receive the most precipitation? –How much of the county is suitable for growing maize? –Where is the best location for a landfill so as to minimize potential groundwater contamination? Understand your data Choose a method Process the data Look at the results

37
GIS Advantages Ability to create and display geo-referenced data Ability to query or model and display the results Visual and tabular representations (spatial, temporal) Represents the real world Connections to other modeling tools
 Represents the real world Connections to other modeling tools")
38
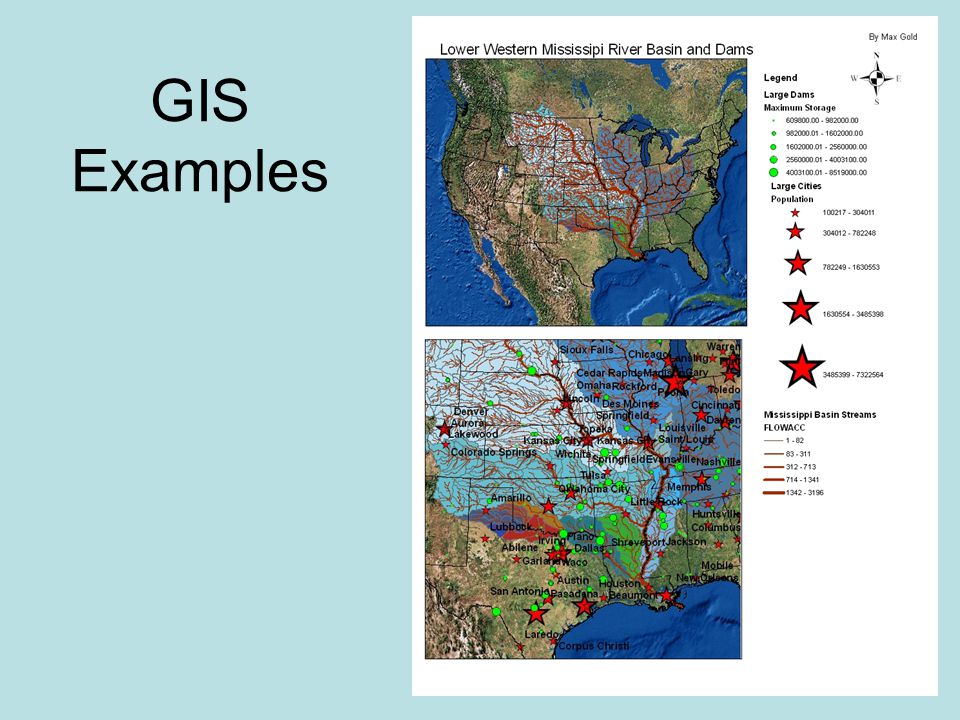
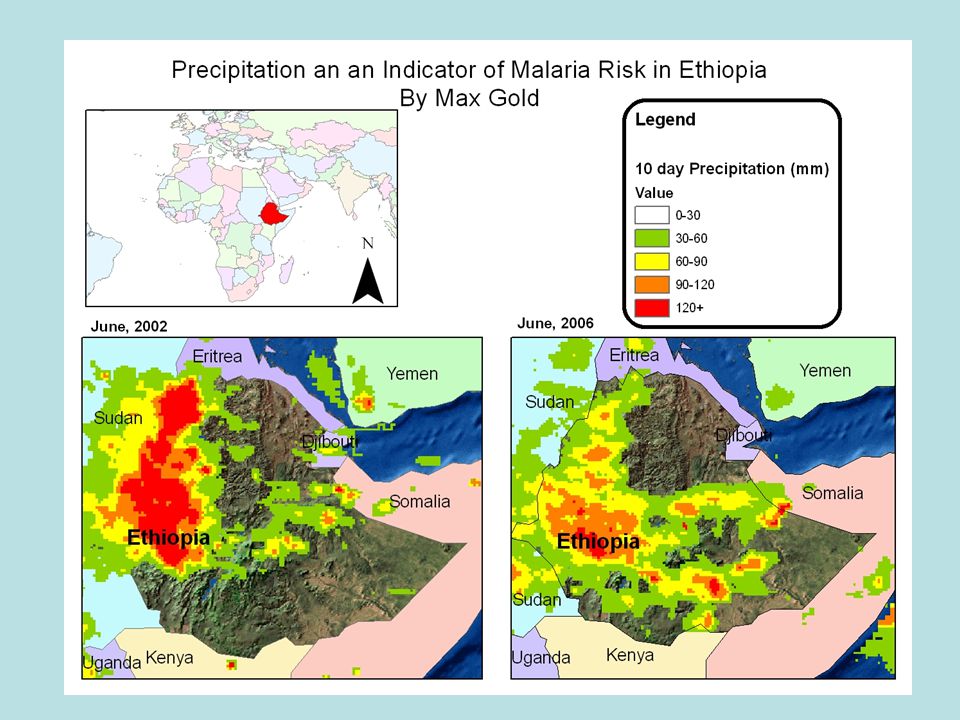
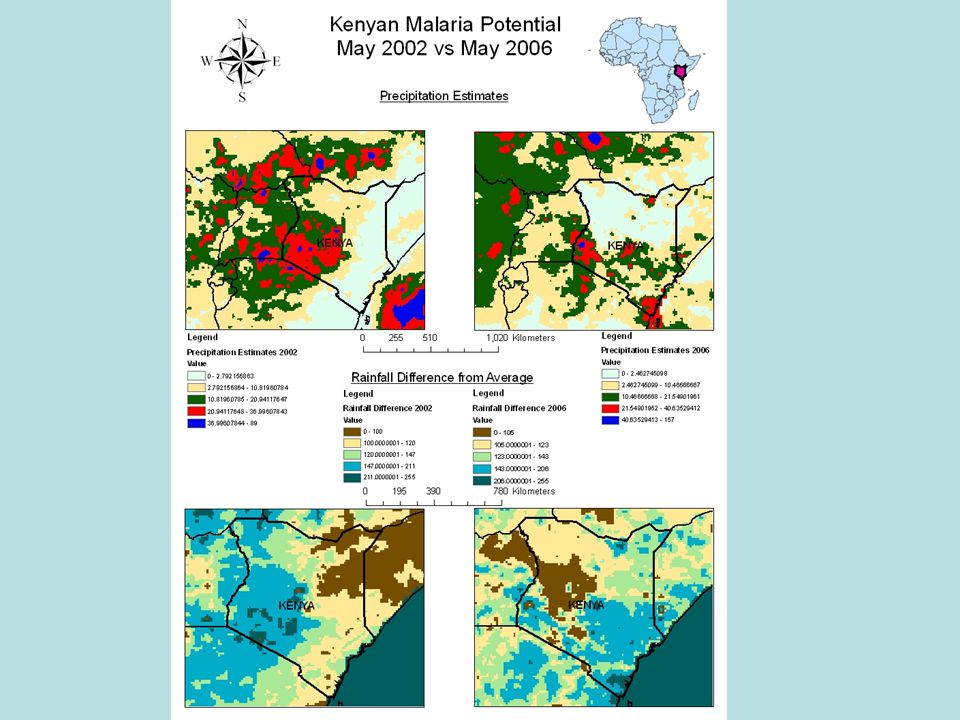
GIS Examples

43
GIS Software ESRI – ArcGIS Desktop –(ArcGIS, ArcInfo, ArcMap, ArcCatalog) (ArcView) Open Source Software – GRASS Clark Labs - IDRISI USING ESRI On-Line Courses
 (ArcView) Open Source Software – GRASS Clark Labs - IDRISI USING ESRI On-Line Courses")
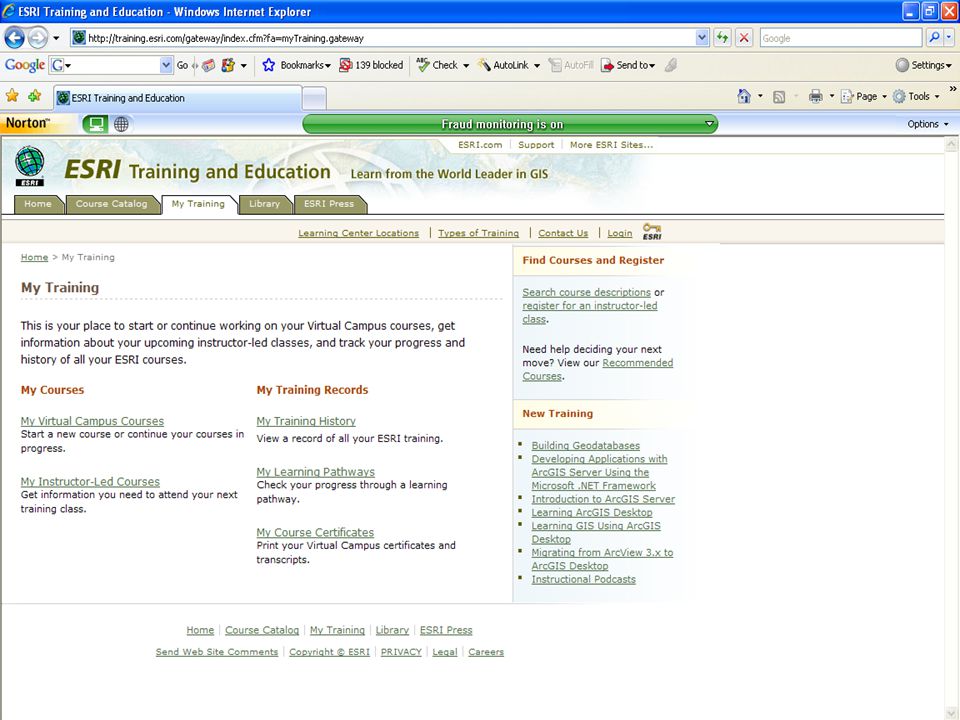
47
Fill out this form, ESRI will send you an email for conformation.

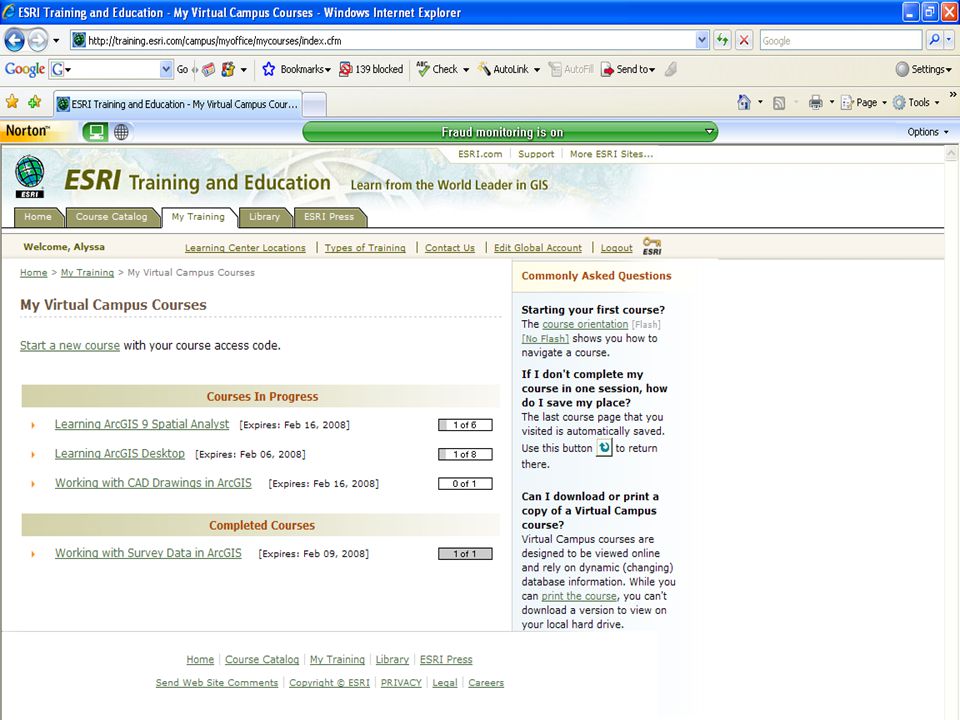
50
Learning ArcGIS Desktop

51
Complete Module 1

52
Completing Labs Very limited computers West side of Bechtel Lab and in the TA offices Your responsibility to complete the labs (don’t wait until last minute) Work together 2-3 people per assignment Delete the data you downloaded before logging off Email me or print certificates and certain maps from exercises
 Work together 2-3 people per assignment Delete the data you downloaded before logging off me or print certificates and certain maps from exercises")
53
Some Tips Easiest to save data under C:\Temp Otherwise click on data and point to location (Rt-Click, Properties, Data Source)
")
54
Problems? Contact TA if during lab times Contact me via email… alyssa.mccluskey@colorado.edu dralyssamccluskey@yahoo.com We’ll address common problems in class lecture or an email to the class.

55
Lab 1: GIS Learning ArcGIS Desktop –Module1 Create a map showing the potential youth center locations without using the map template. Save this as a jpeg and either email to me or print and hand in. Spend some time making it nice! Turn in Module1 Completion Certificate (email or print and turn in) Due Monday April 16 th
 Due Monday April 16 th.")
56
Next Class Go over Lab 1: Learning ArcGIS Desktop

Similar presentations