Download presentation
Presentation is loading. Please wait.

1
Section 12.2: Statistics and Parameters

2
You analyzed data collection techniques. Identify sample statistics and population parameters. Analyze data sets using statistics.

3
Statistical inference- when the statistics of a sample are used to draw conclusion about the entire population Statistic- a measure that describes a characteristic of a sample Parameter- a measure that describes a characteristic of a population (typically estimated based on the statistics of a carefully chosen random sample)
")
4
Statistics can and usually change from sample to sample. ◦ Ex: The number of girls to boys in any given classroom at McKinley Parameters will not change. ◦ Ex: The number of girls to boys in McKinley

5
Statistics and Parameters A. Identify the sample and the population for each situation. Then describe the sample statistic and the population parameter. A movie rental business selects a random sample of 50 orders in one day. The mean number of rentals per order is calculated. Answer:sample: 50 movie orders; population: all movie orders for the day of the sample; sample statistic: mean number of rentals per order in the sample; population parameter: mean number of rentals per order for all rentals the day of the sample

6
Statistics and Parameters B. Identify the sample and the population for each situation. Then describe the sample statistic and the population parameter. A stratified random sample of 2 trees of each species is selected from all trees at a nursery. The mean height of trees in the sample is calculated. Answer:sample: 2 trees of each species found at the nursery; population: all trees at the nursery; sample statistic: mean height of trees in the sample; population parameter: mean height of all trees at the nursery

7
Means, Medians, and Modes are measures of central tendency that represent data. Measures of variation that assess the variability of the data can also represent the data. ◦ Examples: Range, Quartiles, Interquartile Range, Mean Absolute Deviation, and Standard Deviation

8
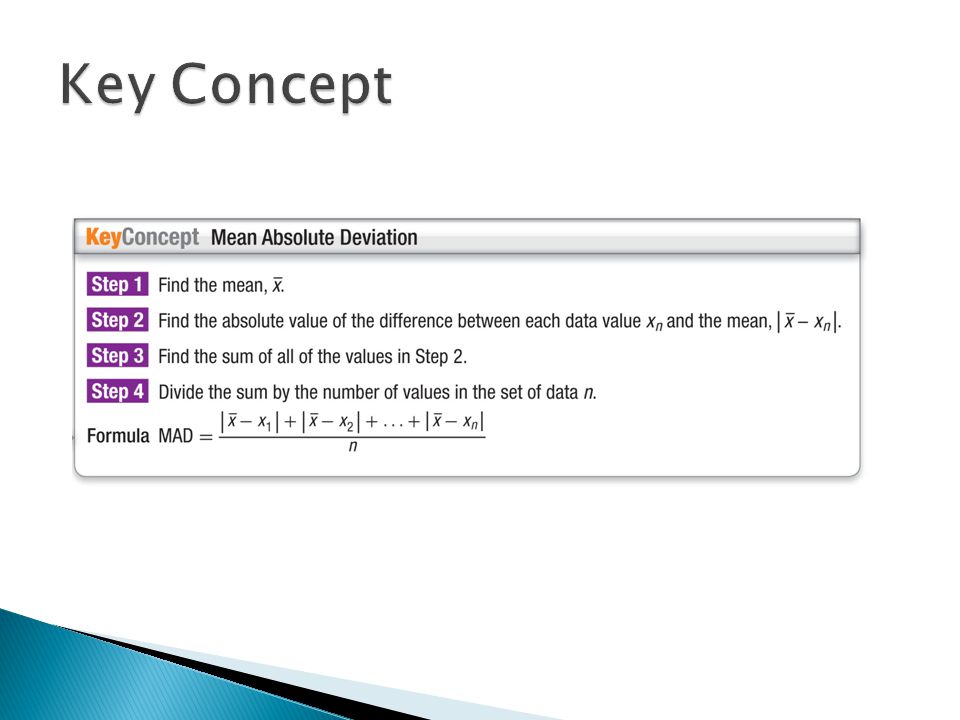
(MAD) is the average of the absolute values of the differences between the mean and each value in the data set. The ‘MAD’ is used to predict errors and judge how well the mean represents the data.

10
Mean Absolute Deviation PETS A rescue agency records the number of pets adopted each month: {14, 18, 12, 17, 15, 20}. Find and interpret the mean absolute deviation. Step 1 Find the mean. Step 2 Find the absolute values of the differences.

11
Mean Absolute Deviation Step 2 Find the absolute values of the differences.

12
Mean Absolute Deviation Step 3 Find the sum. 2 + 2 + 4 + 1 + 1 + 4 = 14 Step 4 Find the mean absolute deviation. Formula for Mean Absolute Deviation The sum is 14 and n = 6.

13
Mean Absolute Deviation Answer:A mean absolute deviation of 2.3 indicates that, on average, the monthly number of pets adopted each month is about 2.3 pets from the mean of 16 pets.

16
Variance and Standard Deviation SCORES Leo tracked his homework scores for the past week: {100, 0, 100, 50, 0}. Find and interpret the standard deviation of the data set. Step 1 Find the mean.

17
Variance and Standard Deviation Step 2 Find the square of the differences,. Step 3 Find the sum. 2500 + 2500 + 2500 + 0 + 2500 = 10,000

18
Step 4 Find the variance. Variance and Standard Deviation Formula for Variance The sum is 10,000 and n = 5.

19
Step 5 Find the standard deviation. Answer:A standard deviation very close to the mean suggests that the data deviate quite a bit. Most of Leo’s scores are far away from the mean of 50. Variance and Standard Deviation Square Root of the Variance

Similar presentations


 Then/Now New Vocabulary Example 1:Identify Statistics and Parameters Concept Summary:>")


 Variance Standard Deviation.>")


