Download presentation
Presentation is loading. Please wait.

1
Workforce HAS 4320

2
Money in Charges Fee for service Fee schedule UCR

3
Money in RBRVS Capitation Salary

4
Co-payments

6
Managed Care Negotiated fees Discounted fees Capitation Salary

7
Incentives Fee-for-service Negotiated/discounted fee Capitation

8
MD Characteristics Average 56.7 hours worked/week Average 107.6 visits/week Average 4.4 hours of charity care/week

9
Physician Income IncomeSpecialty% of total $121,200Family prac15% $174,900Internal Med28% $200,400OB/GYN6% $255,200Surgery14%

10
Physician Income IncomePractice type% of total $158,400Employee33% $210,200Self-employed67% $178,900Solo49% $267,5009+ group11%

11
Physician Salaries Link

12
Practice Costs - Expenses $183,100Average expenses 35%Employee wages 26%Office rent 8%Medical supplies 12%Liability insurance 3%Equipment 16%Other

13
The Hospital Nearly all MDs use a hospital MDs don’t pay for hospital or staff Anesthesiologists/Radiologists/ Pathologists

14
Malpractice About 3% of gross revenues Very few actual negligence cases result in compensation

15
Uncertainty “…the special economics problems of medical care can be explained as adaptations to the existence of uncertainty in the incidence of disease and in the efficacy of treatment.” Uncertainty In incidence In outcomeAgency Insurance

16
Information Asymmetry

17
Nursing Shortage Vacancy rate Economic theory –Hospitals will compete –Wages will be higher –Employment will increase

18
Shortages in practice Hospital reimbursement Wages Schools

19
Recent Trends Short LOS More RNs/patient Outpatient/non-hospital settings Wages slow to respond Federal support

20
Background Some data on nursing shortage, very little on allied health Survey of Utah health care providers Sought after data

21
Response Pretty good from clinics and hospitals Pretty poor from the others

22
Hospitals Responding Alta View American Fork Ashley Valley Bear River Valley Brigham City Cottonwood Davis Delta Community Dixie Regional Fillmore Community Garfield Memorial Gunnison Valley Heber Valley Kane County Lakeview LDS

23
Hospitals Responding Logan McKay-Dee Mountain View Ogden Regional Orem Community Primary Children’s Sanpete Valley Sevier Valley Shriner’s St. Mark’s Timpanogos Regional Uintah Basin Utah Valley Regional Valley View Veterans Admin

24
Specifics Clinics = 143 Hospitals = 31 Long-term care = 9 Home health = 8 Medical labs = 4 Others = 34 Total = 229

25
Other information Data based on size of hospital Data based on rural vs urban hospital

26
Some results…

27
Turnover - Hospitals Overall = 17.58 % Turnover by age –29 or younger =23.50 % –30-39 =13.96 % –40-49 =11.46 % –50 and older = 6.86 %

28
Turnover – Hospitals by size and type 0 - 100 beds = 16.97 % 101 - 200 beds =17.22 % 201 - 300 beds =20.61 % Urban =18.93 % Rural =16.99 %

29
The personnel…

30
Nursing Assistants Tenure = 3.06 years Openings = 2.45 Age =31.81 18-24 =26.27 individuals 50+ = 0.50 individuals

31
LPNs Tenure = 5.59 years Openings = 3.82 Age =38.62 18-24 = 6.77 individuals 50+ = 4.23 individuals

32
RNs Tenure = 9.00 years Openings =23.12 Age =40.26 18-24 =29.00 individuals 50+ =52.67 individuals

33
Respiratory Therapists Tenure = 8.56 years Openings = 1.64 Age =42.54 18-24 = 1.20 individuals 50+ = 4.60 individuals

34
Radiologic Technologists Tenure = 7.31 Openings = 1.40 Age =35.66 18-24 = 2.42 50+ = 1.92

35
Clinical Lab Technologists Tenure = 7.49 years Openings = 0.54 Age =43.06 18-24 = 4.85 individuals 50+ = 6.38 individuals

36
Physical Therapists Tenure = 5.09 years Openings = 0.33 Age =35.44 18-24 = 0.23 individuals 50+ = 0.62 individuals

37
Pharmacists Tenure = 9.10 years Openings = 0.86 Age =39.11 18-24 = 0.40 individuals 50+ = 2.20 individuals

38
Some significant data Urban versus Rural

39
Tenure NAs –Urban = 2.7 years –Rural = 5.5 years CL Technologists –Urban = 8.2 years –Rural = 6.8 years CL Technicians –Urban = 5.2 years –Rural = 10.2 years

40
Openings RNs –Urban = 32.4 –Rural = 3.3

41
Age NAs –Urban = 28.5 –Rural = 34.0 Respiratory Therapists –Urban = 40.5 –Rural = 44.2

42
The Demand…

43
RNs 23 per Utah hospital = 1,000 or so Nurse executives report similar numbers Utah Health Care Association reports a 24% vacancy in LTC 75% of hospitals nationwide report difficulty hiring RNs (AHA TrendWatch, June 2001)
")
44
Radiologic Technologists 1.4 + 1.8 advanced RTs per Utah hospital = 130 or so 18% vacancy rate nationwide (AHA Special Workforce Survey, June 2001) 63% of hospitals nationwide report difficulty hiring RTs (AHA TrendWatch, June 2001)
 63% of hospitals nationwide report difficulty hiring RTs (AHA TrendWatch, June 2001)")
45
Laboratory Technologists 75-100 openings right now (hospitals and clinics) 12% vacancy rate nationwide (AHA Special Workforce Survey, June 2001) 43% of hospitals nationwide report difficulty hiring lab techs (AHA TrendWatch, June 2001)
 12% vacancy rate nationwide (AHA Special Workforce Survey, June 2001) 43% of hospitals nationwide report difficulty hiring lab techs (AHA TrendWatch, June 2001)")
46
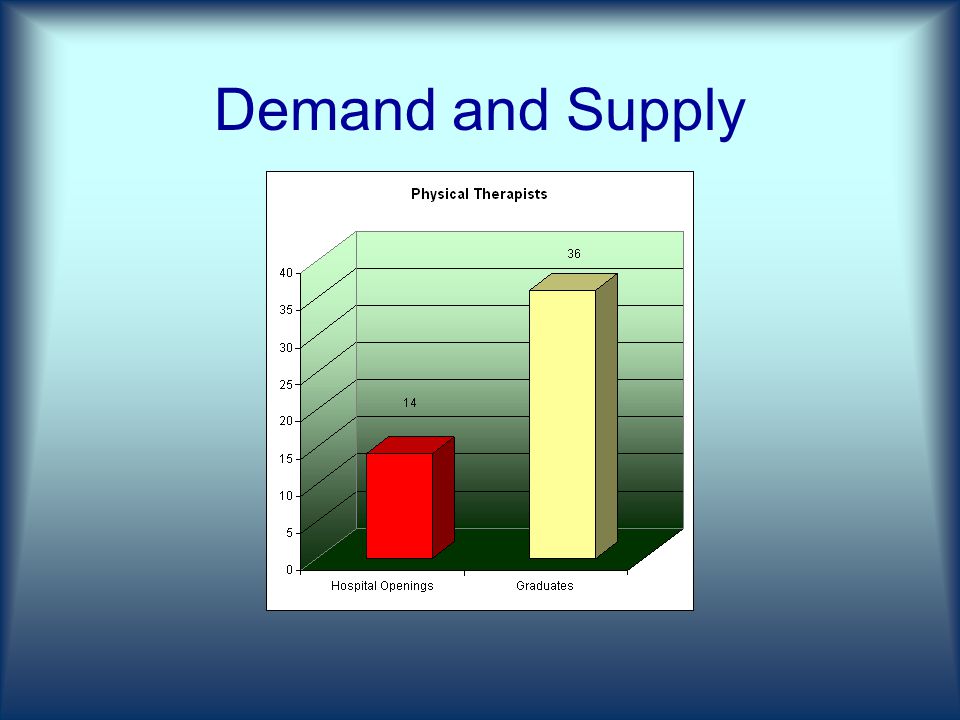
Physical Therapists 15-20 openings right now (hospitals and clinics)
")
47
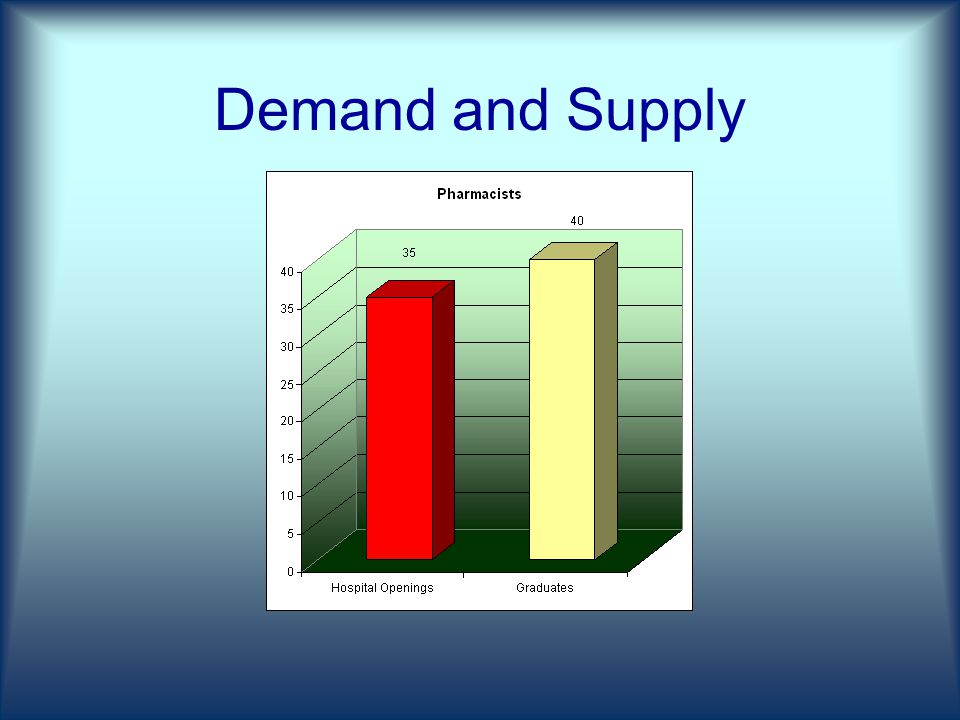
Pharmacists 40 openings right now in hospitals. Consider retail pharmacy 21% vacancy rate nationwide (AHA Special Workforce Survey, June 2001) 50% of hospitals nationwide report difficulty hiring pharmacists (AHA TrendWatch, June 2001)
 50% of hospitals nationwide report difficulty hiring pharmacists (AHA TrendWatch, June 2001).")
48
The Supply…

49
Current Numbers (RNs) Total licensed RNs =17,566 Total Working =13,257 Difference = 4,309 (Utah Medical Education Council, Feb 2002)
 Total licensed RNs =17,566 Total Working =13,257 Difference = 4,309 (Utah Medical Education Council, Feb 2002)")
50
Higher Education (RNs) Undergrad applicants = 1,400 Undergrad admissions = 760 Undergrad graduates = 615 (2000-01 academic year)
 Undergrad applicants = 1,400 Undergrad admissions = 760 Undergrad graduates = 615 ( academic year)")
51
Higher Education Annual Utah Graduates Respiratory Therapists = 50 Clinical Laboratory = 35 Radiologic Technologists = 85 Physical Therapists = 36 Pharmacists = 40

52
Demand and Supply

58
Discussion…

59
Concerns Aging workforce Aging population = more services Aging faculty

60
Concerns 2% of freshmen nationwide indicate nursing as a major Number of pharmacy graduates has decreased Enrollment and graduates do not keep pace with demand

61
Licensure and Profits Fixed supply, no substitutes Monopoly Rules

62
Supply School Controls Legislature

63
Licensure PAs Physicians Nurses

Similar presentations


 2011 Calendar Year Data.>")


