Download presentation
Presentation is loading. Please wait.

1
Predicting indices of climate extremes using eigenvectors of SST and MSLP Malcolm Haylock, CRU

2
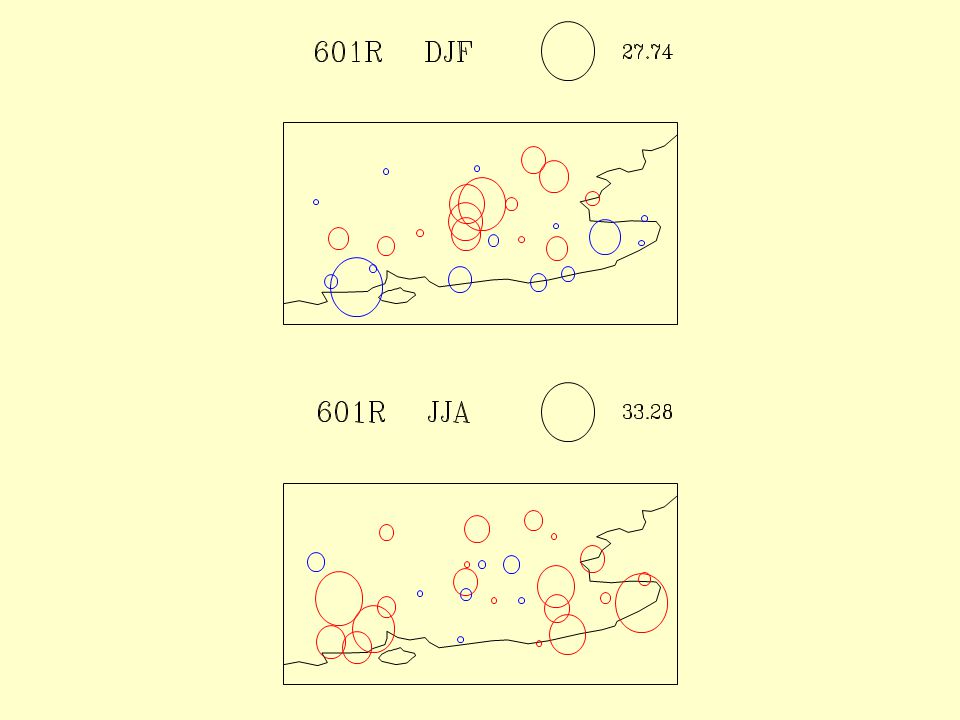
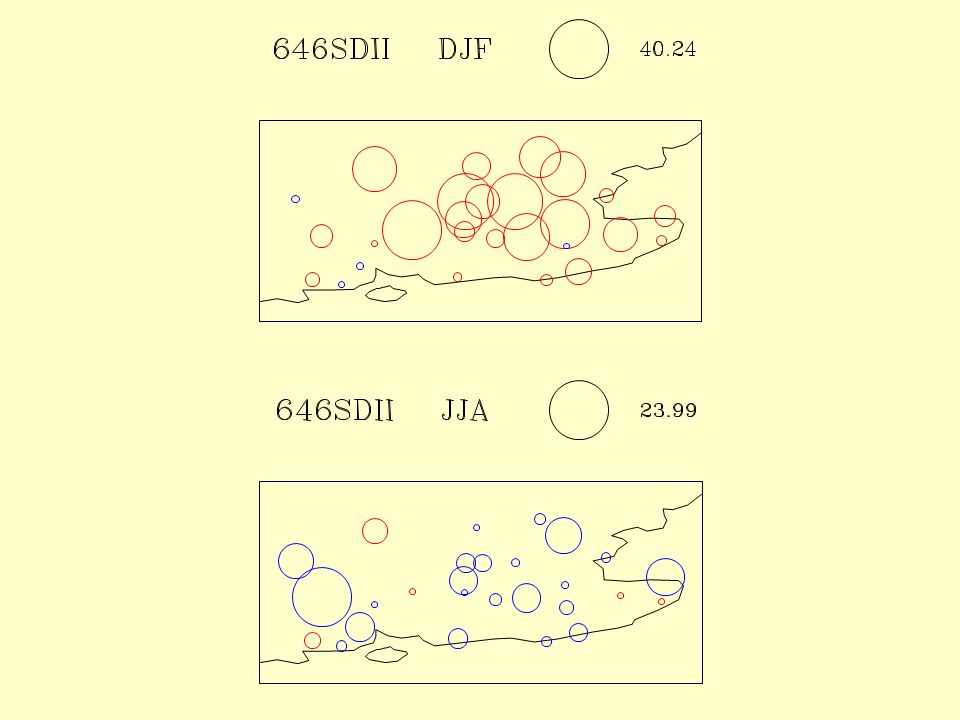
Predictands 601R Mean climatological precipitation (mm/day) precXXp XXth percentile of rainday amounts (mm/day) fracXXp Fraction of total precipitation above annual XXth percentile 606R10 No. of days precip >= 10mm 641CDD Max no. consecutive dry days 642CWD Max no. consecutive wet days pww Mean wet-day persistence persist_dd Mean dry-day persistence persist_corr Correlation for spell lengths wet_spell_mean mean wet spell lengths (days) wet_spell_perc median wet spell lengths (days) wet_spell_sd standard deviation wet spell lengths (days) dry_spell_mean mean dry spell lengths (days) dry_spell_perc median dry spell lengths (days) dry_spell_sd standard deviation dry spell lengths (days) 643R3d Greatest 3-day total rainfall 644R5d Greatest 5-day total rainfall 645R10d Greatest 10-day total rainfall 646SDII Simple Daily Intensity (rain per rainday) 691R90N No. of events > long-term 90th percentile 692R90T % of total rainfall from events > long-term 90th percentile 33 rainfall indices calculated seasonally for 27 stations in SE England
 wet_spell_perc median wet spell lengths (days) wet_spell_sd standard deviation wet spell lengths (days) dry_spell_mean mean dry spell lengths (days) dry_spell_perc median dry spell lengths (days) dry_spell_sd standard deviation dry spell lengths (days) 643R3d Greatest 3-day total rainfall 644R5d Greatest 5-day total rainfall 645R10d Greatest 10-day total rainfall 646SDII Simple Daily Intensity (rain per rainday) 691R90N No. of events > long-term 90th percentile 692R90T % of total rainfall from events > long-term 90th percentile 33 rainfall indices calculated seasonally for 27 stations in SE England.")
3
Predictors Eigenvectors of Nth Atlantic SST and MSLP Calculated using all months together with seasonal cycle removed Significant components rotated (VARIMAX) 9 SST 9 MSLP
 9 SST 9 MSLP")
4
19601970198019902000 2010 -3 -2 0 1 2 3 4 SST Scores PC: 1

5
196019701980199020002010 -6 -4 -2 0 2 4 6 SST Scores PC: 2

6
196019701980199020002010 -4 -3 -2 0 1 2 3 SST Scores PC: 3

7
196019701980199020002010 -4 -3 -2 0 1 2 3 4 SST Scores PC: 1

8
196019701980199020002010 -4 -3 -2 0 1 2 3 4 SST Scores PC: 2

9
196019701980199020002010 -4 -3 -2 0 1 2 3 4 SST Scores PC: 3

10
The Model 1960-2000 Multiple linear regression using singular value decomposition Best predictors selected using cross-validation For each combination of predictors (2 n ): Remove a year Find MLR coefficients Hindcast missing year Assess skill using all hindcasts
: Remove a year Find MLR coefficients Hindcast missing year Assess skill using all hindcasts")
11
Skill of model Build model using all years except 1979-93 then hindcast these years and compare Double cross-validation For each year in 1960-2000: Remove a year Use cross-validation to find best model Hindcast missing year Assess skill using all hindcasts

12
Obs. Forecast abs(p f - p v ) LEPS=1- abs(p f - p v ) 1 is perfect forecast 0 is worst possible forecast pfpf pvpv
 LEPS=1- abs(p f - p v ) 1 is perfect forecast 0 is worst possible forecast pfpf pvpv.")
13
…LEPS For single forecast LEPS' = LEPS - LEPS(climatology) = abs(p v - 0.5) - abs(p f - p v ) For set of forecasts If= LEPS'(perfect forecast) If= LEPS'(worst case) 100 = all perfect forecasts 0 = all climatology -100 = all worst case forecasts
 = abs(p v - 0.5) - abs(p f - p v ) For set of forecasts If= LEPS (perfect forecast) If= LEPS (worst case) 100 = all perfect forecasts 0 = all climatology -100 = all worst case forecasts")
14
SST only. LEPS(hindcast) vs LEPS(dx-val)
 vs LEPS(dx-val)")
18
Hindcast LEPS(MSLP) vs LEPS(SST)
 vs LEPS(SST)")
19
Where to... NW England Other European stations Combined SST and MSLP (trim predictors) Other predictors?
 Other predictors .")
Similar presentations


 Sigmond, M., J. Fyfe, G. Flato, V. Kharin,>")


 CPC/NCEP/NOAA Jan 2011.>")


