Download presentation
Presentation is loading. Please wait.

1
Biosciences: Audiology Lecture 3 Adam Beckman Head of Audiology Services, Plymouth Hospitals NHS Trust With thanks to: Lizanne Steenkamp, Queen Margaret University; & to Newborn Hearing Screening Programme

2
Introduction Physics of sound ✔ The ear – anatomy and physiology Hearing –How it works ✔ Introduction – function ✔ –Pathology - today –How we measure it - today The vestibular system

3
Introduction The Ear with reference to acoustics, anatomy and physiology –What goes wrong – pathology –How we test hearing and function Year 2 –More detail in paediatrics Year 3 –Adult acquired loss and its amelioration

4
Hearing Loss Statistics There are more than 10 million people in the UK with some form of hearing loss, or one in six of the population. From the total 3.7 million are of working age (16 – 64) and 6.3 million are of retirement age (65+). By 2031, it is estimated that there will be 14.5 million people with hearing loss in the UK. More than 800,000 people in the UK are severely or profoundly deaf.
 and 6.3 million are of retirement age (65+). By 2031, it is estimated that there will be 14.5 million people with hearing loss in the UK. More than 800,000 people in the UK are severely or profoundly deaf..")
5
Hearing Loss Statistics About two million people in the UK have hearing aids, but only 1.4 million use them regularly. At least four million people who don't have hearing aids would benefit from using them. On average it takes ten years for people to address their hearing loss. About one in ten adults in the UK have mild tinnitus and up to 1% have tinnitus that affects their quality of life.

6
Hearing Loss Statistics There are more than 45,000 deaf children in the UK, plus many more who experience temporary hearing loss. More than 70% of over 70 year-olds and 40% of over 50 year-olds have some form of hearing loss. There are approximately 356,000 people with combined visual and hearing impairment in the UK. statistics available from Action on Hearing Loss http://www.actiononhearingloss.org.uk/your- hearing/about-deafness-and-hearing- loss/statistics.aspx

7
The Ear and Hearing The ear and hearing

8
Key Terminology Degree of hearing loss –How bad is it? Site of hearing loss –Where in the system is it?

9
Features of sound - speech High pitched speech sounds? –Consonants “s”, “t” etc Low pitched speech sounds? –Vowels “oo”, “aa”

10
Sound intensity http://www.nottinghamcity.gov.uk/cdpc_decibel_chart.gif

11
Assessment of hearing Aim –to measure the quietest sound that person can hear at different frequencies and plot an audiogram for each ear And –to establish where in the auditory pathway the problem lies i.e. type of hearing loss

12
Hearing within normal limits The shaded area represents speech sounds at normal conversational level This slide shows normal hearing, well above the speech area so no difficulties hearing normal conversational speech. Normal conversational speech

13
Moderate hearing loss This slide shows a mild to moderate hearing loss Line now in speech area so some of speech cannot be heard

14
Severe hearing loss This slide shows a severe hearing loss This person will not hear normal conversational speech without help.

15
Profound hearing loss This individual has a profound hearing loss. Not much room to move speech sounds below the line as starts to distort so hearing aids of limited value - access only to environmental sounds such as traffic or door slamming.

16
Types of Hearing Loss Conductive –outer ear –middle ear Sensori-neural –cochlea (sensory) –auditory nerve (neural) Mixed Central –Not considered today
 –auditory nerve (neural) Mixed Central –Not considered today")
17
Causes of Hearing Loss Conductive hearing loss Mixed hearing loss Sensorineural hearing loss

18
Conductive hearing loss Outer ear –Congenital malformation e.g. atresia, microtia Gain none of the benefits of –Pinna, ear canal, ear drum Sound transmitted via bone conduction only to inner ear

19
Conductive hearing loss Outer ear –Blockage Wax Infection Foreign body Sound transmission attenuated by blockage

20
Conductive hearing loss Outer ear –Exostosis “Surfer’s ear” –Mild Little effect on hearing But trapped water and wax more prone to infection –Severe Lose benefits of ear canal resonance Attenuates sound

21
Conductive hearing loss Outer ear –Perforation Small – mild hearing loss –Ear drum still works »Vibrates sounds, passes to ossicles »Smaller surface area »Less elastic –More prone to infections Large – moderate hearing loss –Greater reduction in surface area –Does not vibrate ossicles well

22
Conductive hearing loss Middle ear –Eustachian tube dysfunction Blocked Eustachian tube Negative pressure in middle ear TM “sucked in” –Less mobile –Sound not transmitted through as well

23
Conductive hearing loss Middle ear –Otitis media with effusion/glue ear Eustachian tube blocked Build up of fluid in middle ear Sound not transmitted though well Normally mild hearing loss –Can be moderate

24
Conductive hearing loss Middle ear –Infection Fluid in middle ear Acute infection –Build up of pressure –Painful +++ Discharge if ear drum perforates

25
Conductive hearing loss Middle ear –Cholesteatoma Build up of debris in middle ear –Grows slowly Can be dangerous –Erodes ossicles, skull –Needs to be surgically removed –Otosclerosis Bony growth on ossicles –Normally footplate of stapes Reduces movement of ossicles –Sound transmission to cochlea reduced

26
Conductive hearing loss Middle ear –Tympanosclerosis Scarring on ear drum Ear drum becomes “floppier” –Does not transmit sound as well –Ossicular malformation Congenital Ossicles do not transmit sound through as well –Ossicular fracture or discontinuity –Ossicles do not transmit sound through as well

27
Sensori-neural hearing loss Inner ear/nerve What can go wrong? –Outer hair cells –Inner hair cells –Cochlear fluids –Neural transmission

28
Sensori-neural hearing loss What are the causes? –Congenital Syndromic Non-syndromic –Infections Prenatal Postnatal –Trauma –Ototoxicity –Noise induced –Ageing

29
Examples of syndromic causes Can effect different parts of the inner ear Over 3000 – many rare problems can now be identified via genetic testing Recessive syndromes Dominant syndromes X-linked syndromes Chromosomal disorders Usher’s Syndrome Pendred’s Syndrome Waardenburg Syndrome Treacher Collins Syndrome Alport’s Syndrome Hunter Syndrome Down Syndrome Turner Syndrome

30
Non-syndromic Genetic sensorineural hearing loss –Connexin 26 Most common –Mitochondrial

31
Prenatal Infections STORCH –Syphilis –Toxoplasmosis –Rubella –Cytomegalovirus –Herpes

32
Perinatal problems –Anoxia at birth –Assisted ventilation –Jaundice –Low birth weight –Mainly hair cell damage, but can effect other parts of the system as well Including neural problems

33
Postnatal Infections –Bacterial Meningitis –Meningococcal septicaemia –Mumps –Measles –Scarlet fever –Mainly hair cell damage

34
Traumatic Skull fracture (temporal bone) –Can cause loss of fluids from cochlea Acoustic trauma –explosions, fireworks, gunfire, rock concerts, and earphones –Can cause damage to: Ear drum, hair cells, cochlear fluids Barotrauma (differences in pressure) –Diving
 –Can cause loss of fluids from cochlea Acoustic trauma –explosions, fireworks, gunfire, rock concerts, and earphones –Can cause damage to: Ear drum, hair cells, cochlear fluids Barotrauma (differences in pressure) –Diving")
35
Ototoxicity Aminoglycoside antibiotics –Gentamicin etc Aspirin –large doses Chloroquine –Quinine and derivatives Chemotherapy –E.g. cistplatin Mainly hair cell damage

36
Noise induced - prolonged exposure Leisure noise –Increasing Increased levels at concerts/clubs Personal listening devices Industrial noise –Reducing Noise at work regulations Mainly outer hair cell damage

37
Sensorineural losses - other causes Age-related hearing loss –Most common –Variety of potential changes with time Outer hair cell Inner hair cell Electrolyte imbalance Neural conduction

38
Sensorineural losses - other causes Meniere’s disease –Associated with dizziness and tinnitus –Fluctuating symptoms –Problem with cochlear fluids Infection –Inner ear Ischaemia –Loss of blood supply –Hair cell damage

39
Neural hearing losses Acoustic Neuroma –Growth on the VIII Nerve Multiple Sclerosis Neurodegenerative disorders

40
Some facts about Hearing Loss Bilateral or Unilateral Symmetrical or Asymmetrical Can affect both ears in varying degrees Hearing results (Audiogram) does not indicate degree of disability Patient can have more than one type of hearing problem Hearing results can change
 does not indicate degree of disability Patient can have more than one type of hearing problem Hearing results can change")
41
Measuring Function Two basic tests –Pure tone audiometry –Tympanometry

42
Measuring hearing Measuring hearing - go to 2.5 mins

43
Pure Tone Audiometry What is it? –Measure of hearing threshold, using air or bone conduction (across the normal speech frequencies) How is threshold defined? –Psychometrically, based on method
 How is threshold defined. –Psychometrically, based on method.")
44
Pure Tone Audiometry Method –Instruct patient –Remove obstructions Examples… –Estimate hearing How? –Ask for better hearing ear –Place headphones

45
Pure Tone Audiometry Method –Start with better ear 1 kHz, 1-3 sec 30dBHL above ‘threshold’ Reduce intensity by 10dBHL –Until no response Increase by 5dBHL –Until response Reduce by 10, increase by 5 Until: –2 responses out of 2, 3 or 4 ascending presentations

46
Pure Tone Audiometry Method –i.e. Threshold is defined as level at which patent responds at least 50% of time on ascending presentations (for clinical purposes)
.")
47
Pure Tone Audiometry Method –Repeat at 2, 4, 8, 0.5 & 0.25 kHz –Repeat 1 kHz –Test other ear

48
Pure Tone Audiometry Presentation – beware –Rhythm –Visual cues –Auditory cues –Unreliable responses Non-organic Tinnitus –Fatigue

49
Pure Tone Audiometry Method –Test bone conduction Remove obstructions Order: 1, 2, 4, 0.5 kHz Why not 8 kHz? Why not 0.25 kHz? –Any exceptions? Special considerations for 3 & 4 kHz –Prevent air conducted sound

50
Pure Tone Audiometry Masking –Why? –When? –How?

51
Pure Tone Audiometry Masking –Why? Sound can cross over to other cochlea –Ensure know which ear is hearing –When? 40dB or greater difference in AC thresholds 10dB or more air-bone gap 40dB or greater gap between AC test ear and BC non-test ear –How? Narrow band noise applied to the other ear

52
Pure tone audiometry Build up picture –Hearing in each ear –Degree of loss –Conductive, sensorinueral or mixed loss

53
Degree of hearing loss Basic classification –Mild >20 and ≤40dBHL –Moderate >40 and ≤60dBHL –Severe >60 and ≤90dBHL –Profound >90dBHL

54
Unilateral hearing loss

55
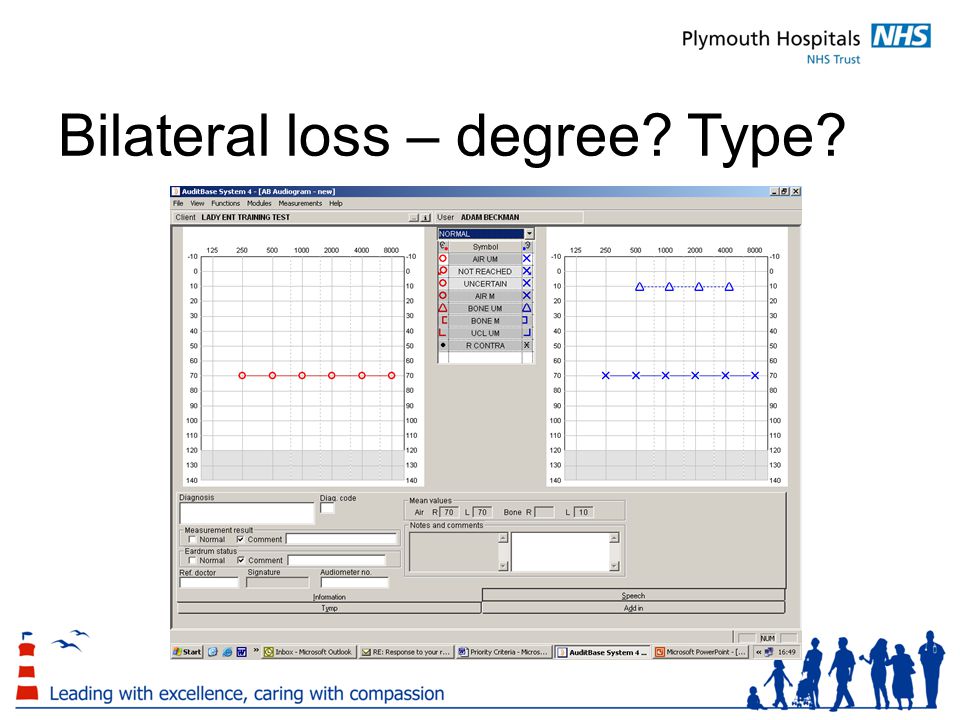
Bilateral loss – degree? Type?

57
Tympanometry Tympanometry - 1 min

58
Tympanometry How? –TM most flaccid when pressure in EAM equals pressure in ME –Most sound transmitted when TM is most flaccid –Apply sound of known level –85dBSPL Measure reflected sound At different pressures

59
Tympanometry Sound in Pump Microphone Adapted from: http://www.audstudent.com/tutorials/tymp1/Tympanometry.htm

60
Tympanometry Measures three factors –Size of ear canal cm 3 –Middle ear pressure daPa –Maximum compliance cm 3

61
Normal Tympanogram c c c c

62
Glue Ear c c c c

63
Wax c c c c

64
Eustachian tube dysfunction c c c c 0.5cm 3 -275daPa

65
Effect of hearing loss Depends on –Age of onset –Degree of loss Will be covered in years 2 and 3

66
Summary Many conditions can effect hearing –Outer, middle or inner ear –VIII nerve Basic tests will identify –If hearing loss is conductive or sensorineural –Likely cause of conductive losses These provide that start of developing the appropriate management

67
References Gelfand (2004) Hearing. An introduction to psychological and physiological acoustics (4th Ed) Chapter 4. Cochlear mechanisms and processes (p121-177) Katz (2002) Handbook of Clinical Audiology (5th Ed) Moore (2003) An introduction to the psychology of hearing (5th Ed). Chapter 1: The nature of sound and the structure and function of the auditory system (p 1-54) Lectures compiled from lectures provided by the Audiology team at QMU
 Chapter 4. Cochlear mechanisms and processes (p ) Katz (2002) Handbook of Clinical Audiology (5th Ed) Moore (2003) An introduction to the psychology of hearing (5th Ed). Chapter 1: The nature of sound and the structure and function of the auditory system (p 1-54) Lectures compiled from lectures provided by the Audiology team at QMU.")
Similar presentations