Download presentation
Presentation is loading. Please wait.

1
Six Sigma and Statistical Quality Control

2
Outline Quality and Six Sigma: Basic ideas and history Juran Trilogy –Control –Improvement –Planning Quality Strategy Focus on Statistical Methods –Process Capability ideas and metrics –Control charts for attributes and variables

3
A Brief History The Craft System Taylorism (Scientific Management) Statistical Quality Control –Pearson, Shewhart, Dodge Human Relations School –Mayo, Maslow, Simon, Herzberg, Likert The Japanese Revolution (1950) –Ishikawa, Taguchi, Deming, Juran, Feigenbaum The USA Wakes Up (1980) –Crosby 1990s: Six Sigma The Need for Organizational Change
 Statistical Quality Control –Pearson, Shewhart, Dodge Human Relations School –Mayo, Maslow, Simon, Herzberg, Likert The Japanese Revolution (1950) –Ishikawa, Taguchi, Deming, Juran, Feigenbaum The USA Wakes Up (1980) –Crosby 1990s: Six Sigma The Need for Organizational Change")
4
Operations -- Prof. Juran4 JIT and TQM Walter Shewhart 1891 - 1967 W. Edwards Deming 1900 - 1993 Joseph M. Juran 1904 - 2008

5
What is Quality? Freedom from Defects –Quality Costs Less –Affects Costs Presence of Features –Quality Costs More –Affects Revenue

6
Juran Trilogy Planning, Control, Improvement

7
Chronic Waste Sporadic Spike PlanningControl Improvement

8
Quality Control Aimed at preventing unwanted changes Works best if deployed at the point of production or service delivery (Empowerment) Tools: –Established, measurable standards –Measurement and feedback –Control charts –Statistical inference
 Tools: –Established, measurable standards –Measurement and feedback –Control charts –Statistical inference")
9
Quality Control Operate Establish Standard Corrective Action Measure Performance Compare to Standard OK? Yes No

10
Quality Improvement Aimed at creating a desirable change Two distinct “journeys” –Diagnosis –Remedy Project team approach Tools –Process flow diagram –Pareto analysis –Cause-effect (Ishikawa, fishbone) diagram –Statistical tools
 diagram –Statistical tools")
11
Quality Improvement Identify problem Analyze symptoms Formulate theories Test theories - Identify root cause Identify remedy Address cultural resistance Establish control

12
Quality Planning Aimed at creating or redesigning (re- engineering) a process to satisfy a need Project team approach Tools –Market research –Failure analysis –Simulation –Quality function deployment –Benchmarking
 a process to satisfy a need Project team approach Tools –Market research –Failure analysis –Simulation –Quality function deployment –Benchmarking")
13
Quality Planning Verify goal Identify customers Determine customer needs Develop product Develop process Transfer to operations Establish control

14
Strategic Quality Planning Mission Vision Long-term objectives Annual goals Deployment of goals Assignment of resources Systematic measurement Connection to rewards and recognition

15
Strategic Quality Planning Aimed at establishing long-range quality objectives and creating an approach to meeting those objectives Top management’s job Integrated with other objectives –Operations –Finance –Marketing –Human Resources

17
Process Capability The Relationship between a Process and the Requirements of its Customer How Well Does the Process Meet Customer Needs?

18
Process Capability Specification Limits reflect what the customer needs Natural Tolerance Limits (a.k.a. Control Limits) reflect what the process is capable of actually delivering These look similar, but are not the same
 reflect what the process is capable of actually delivering These look similar, but are not the same.")
19
Specification Limits Determined by the Customer A Specific Quantitative Definition of “Fitness for Use” Not Necessarily Related to a Particular Production Process Not Represented on Control Charts

20
Tolerance (Control) Limits Determined by the inherent central tendency and dispersion of the production process Represented on Control Charts to help determine whether the process is “under control” A process under control may not deliver products that meet specifications A process may deliver acceptable products but still be out of control
 Limits Determined by the inherent central tendency and dispersion of the production process Represented on Control Charts to help determine whether the process is under control A process under control may not deliver products that meet specifications A process may deliver acceptable products but still be out of control")
21
Measures of Process Capability C p C pk Percent Defective Sigma Level

22
Example: Cappuccino Imagine that a franchise food service organization has determined that a critical quality feature of their world-famous cappuccino is the proportion of milk in the beverage, for which they have established specification limits of 54% and 64%. The corporate headquarters has procured a custom- designed, fully-automated cappuccino machine which has been installed in all the franchise locations. A sample of one hundred drinks prepared at the company’s Stamford store has a mean milk proportion of 61% and a standard deviation of 3%.

23
Example: Cappuccino Assuming that the process is in control and normally distributed, what proportion of cappuccino drinks at the Stamford store will be nonconforming with respect to milk content? Try to calculate the Cp, Cpk, and Parts per Million for this process. If you were the quality manager for this company, what would you say to the store manager and/or to the big boss back at headquarters? What possible actions can be taken at the store level, without changing the inherent variability of this process, to reduce the proportion of non-conforming drinks?

24
Lower Control Limit

25
Upper Control Limit

26
Nonconformance

28
0.00990 of the drinks will fall below the lower specification limit. 0.84134 of the drinks will fall below the upper limit. 0.84134 - 0.00990 = 0.83144 of the drinks will conform. Nonconforming: 1.0 - 0.83144 = 0.16856 (16.856%)
.")
29
C p Ratio

30
C pk Ratio

31
Parts per Million

32
Quality Improvement Two Approaches: –Center the Process between the Specification Limits –Reduce Variability

33
Approach 1: Center the Process

36
0.04746 of the drinks will fall below the lower specification limit. 0.95254 of the drinks will fall below the upper limit. 0.95254 - 0.04746 = 0.90508 of the drinks will conform. Nonconforming: 1.0 - 0.90508 = 0.09492 (9.492%)
.")
37
Approach 1: Center the Process Nonconformance decreased from 16.9% to 9.5%. The inherent variability of the process did not change. Likely to be within operator’s ability.

38
Approach 2: Reduce Variability The only way to reduce nonconformance below 9.5%. Requires managerial intervention.

39
Quality Control Operate Establish Standard Corrective Action Measure Performance Compare to Standard OK? Yes No

40
Quality Control Aimed at preventing and detecting unwanted changes An important consideration is to distinguish between Assignable Variation and Common Variation Assignable Variation is caused by factors that can clearly be identified and possibly managed Common Variation is inherent in the production process We need tools to help tell the difference

41
When is Corrective Action Required? Operator Must Know How They Are Doing Operator Must Be Able to Compare against the Standard Operator Must Know What to Do if the Standard Is Not Met

42
When is Corrective Action Required? Use a Chart with the Mean and 3-sigma Limits (Control Limits) Representing the Process Under Control Train the Operator to Maintain the Chart Train the Operator to Interpret the Chart
 Representing the Process Under Control Train the Operator to Maintain the Chart Train the Operator to Interpret the Chart.")
43
Example: Run Chart

44
When is Corrective Action Required? Here are four indications that a process is “out of control”. If any one of these things happens, you should stop the machine and call a quality engineer: One point falls outside the control limits. Seven points in a row all on one side of the center line. A run of seven points in a row going up, or a run of seven points in a row going down. Cycles or other non-random patterns.

45
Example: Run Chart

46
Type I and Type II Errors

47
When is Corrective Action Required? One point falls outside the control limits. 0.27% chance of Type I Error Seven points in a row all on one side of the center line. 0.78% chance of Type I Error A run of seven points in a row going up, or a run of seven points in a row going down. 0.78% chance of Type I Error

48
Basic Types of Control Charts Attributes (“Go – No Go” data) A simple yes-or-no issue, such as “defective or not” Data typically are “proportion defective” p -chart Variables (Continuous data) Physical measurements such as dimensions, weight, electrical properties, etc. Data are typically sample means and standard deviations X -bar and R chart

49
Statistical Symbols (Attributes)
")
50
p -chart Example

54
Note: If the LCL is negative, we round it up to zero.

56
Statistical Symbols (Variables)
")
57
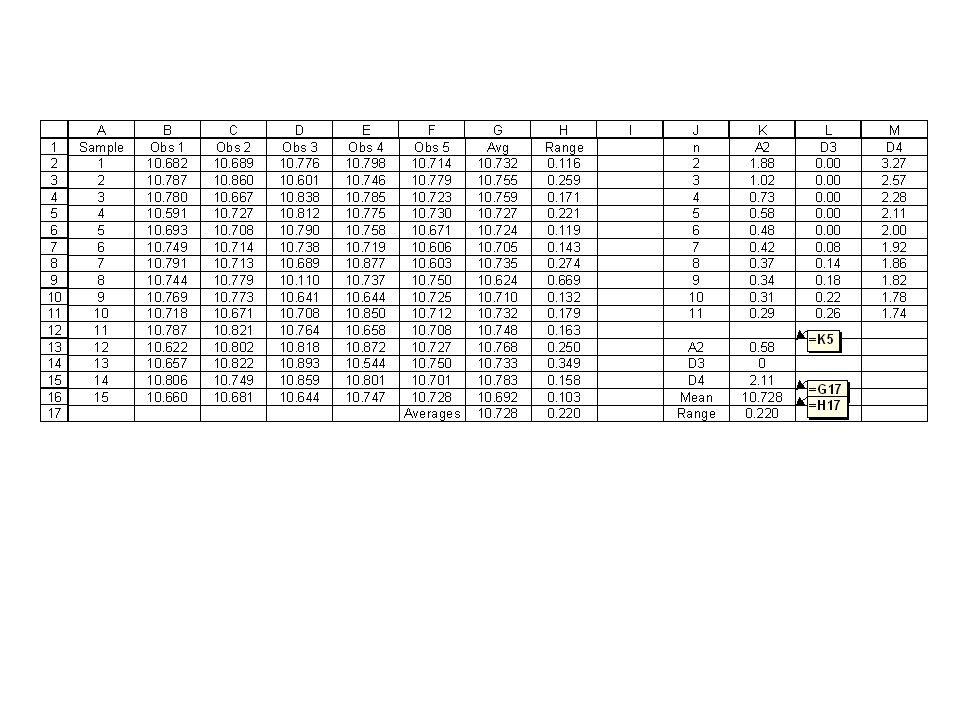
X -bar, R chart Example

59
From Exhibit TN7.7

63
X-bar Chart

64
R chart

65
Interpretation Does any point fall outside the control limits? Are there seven points in a row all on one side of the center line? Is there a run of seven points in a row going up, or a run of seven points in a row going down? Are there cycles or other non-random patterns?

66
A Process in which the Specification Limits are Six Standard Deviations above and below the Process Mean Two Approaches: Move the Specification Limits Farther Apart Reduce the Standard Deviation Six Sigma Defined (Low-Level)
")
67
Approach #1 Ask the Customer to Move the Specification Limits Farther Apart.

73
Approach #2 Reduce the Standard Deviation.

79
Process Drift What Happens when the Process Mean Is Not Centered between the Specification Limits?

84
Six Sigma: Many Meanings A Symbol A Measure A Benchmark or Goal A Philosophy A Method

85
Six Sigma: A Symbol is a Statistical Symbol for Standard Deviation Standard Deviation is a Measure of Dispersion, Volatility, or Variability

86
Six Sigma: A Measure The “Sigma Level” of a process can be used to express its capability — how well it performs with respect to customer requirements. Percent Defects, C p, C pk, PPM

87
Six Sigma: A Benchmark or Goal The specific value of 6 Sigma (as opposed to 5 or 4 Sigma) is a benchmark for process excellence. Adopted by leading organizations as a goal for process capability.

88
Six Sigma: A Philosophy A vision of process performance Tantamount to “zero defects” A “Management Mantra”

89
Six Sigma: A Method Really a Collection of Methods: –Product/Service Design –Quality Control –Quality Improvement –Strategic Planning

90
Where Does “3.4 PPM” Come From? Six Sigma is commonly defined to be equivalent to 3.4 defective parts per million. Juran says that a Six Sigma process will produce only 0.002 defective parts per million. What gives?

91
Normal Curve Probabilities

93
Process Centered between Spec Limits

94
Process Shifted by 1.5 Standard Deviations

95
Where Does “3.4 PPM” Come From? The 3.4 defective parts per million definition of Six Sigma includes a “worst case” scenario of a 1.5 standard deviation shift in the process. It is assumed that there is a very high probability that such a shift would be detected by SPC methods (low probability of Type II error).
..")
96
Six Sigma in Context Is Six Sigma dramatically different from old-fashioned quality control? Is Six Sigma a departure from 1980’s- style TQM?

97
Six Sigma in Context What Is New? –Focus on Quantitative Methods –Focus On Control –A Higher Standard –A New Metric for Defects (PPM) –Lots of training –Linkage between quality goals and employee incentives?
 –Lots of training –Linkage between quality goals and employee incentives .")
98
Using Six Sigma A New Standard; Not Adopted Uniformly across Industries Beyond Generalities, Need to Develop Organization-Specific Methods Hard Work, Not Magic “A Direction Not a Place”

99
Summary Quality and Six Sigma: Basic ideas and history Juran Trilogy –Control –Improvement –Planning Quality Strategy Focus on Statistical Methods –Process Capability ideas and metrics –Control charts for attributes and variables

Similar presentations


 –Continuous improvement tools Quality assurance.>")

. Quality of Manufacturing Process depends on Entry Criteria.>")


 2009 John Wiley & Sons, Inc.>")


>")


