Download presentation
Presentation is loading. Please wait.

1
Yellowstone-Grand Teton Loop Bicycle Pathway Estimated Economic Impact

2
Acknowledgements Funding provided by: USDA Rural Development Match funding provided by: ECIPDA, City of Victor, ID Grantee: East-Central Idaho Planning & Development Association Research conducted by: Eastern Idaho Entrepreneurial Center

3
Project Description An impact study was performed to estimate the economic benefits of a 262 mile non-motorized pathway connecting Victor, Idaho with the greater Yellowstone and Grand Teton areas.

4
Study Area Counties Idaho –Teton –Fremont Wyoming –Teton –Park Montana –Gallatin

5
Results Summary 1,540 jobs created or sustained $48 million in labor income $131.8 million increase in gross regional output

6
Survey Responses 514 Pathway users during collection period –40.1% response rate –206 total responses 59% (122) Visitors (>25 min from survey location) 41% (88) Local Residents Surveys collected Aug – Sept 2014
 Visitors (>25 min from survey location) 41% (88) Local Residents Surveys collected Aug – Sept 2014")
7
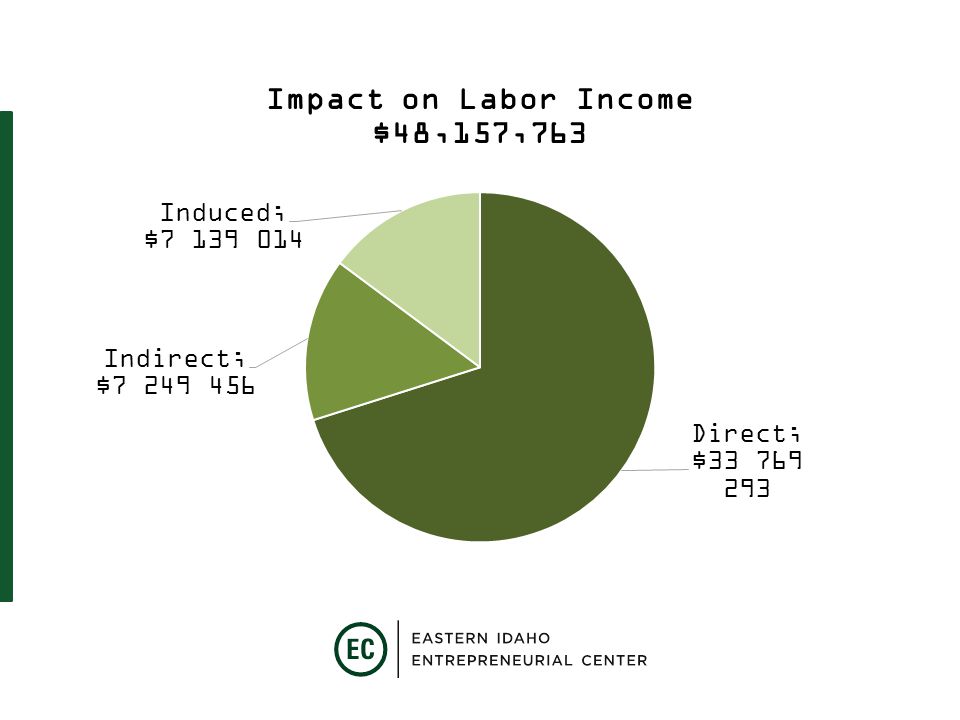
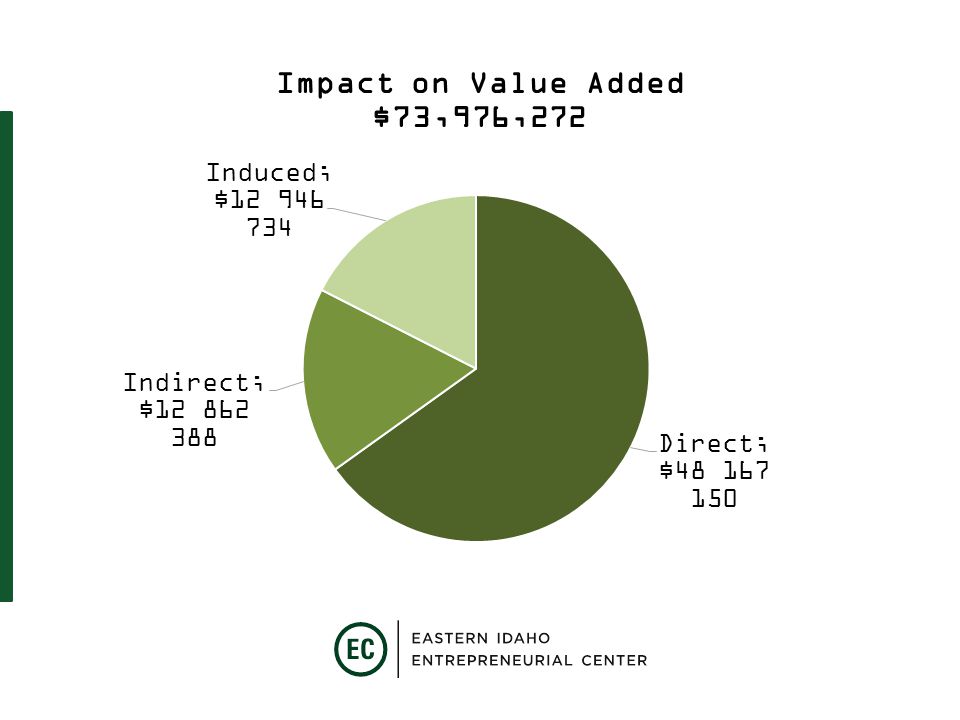
Economic Impact Summary Impact Type EmploymentLabor IncomeValue AddedOutput Direct1,154 $33,769,29 3 $48,167,15 0 $84,412,40 6 Indirect193$7,249,456 $12,862,38 8 $24,591,40 6 Induced194$7,139,014 $12,946,73 4 $22,777,40 9 Total1,541 $48,157,76 3 $73,976,27 2 $131,781,2 21 Multipli er 1.31.41.51.6 % Share of Total Impact Visitor97.0%96.7%97.0%97.2% Local3.0%3.3%3.0%2.8% [1] [1] Employment – The number of jobs created or sustained. [2] [2] Labor Income – The amount of income including employee compensation (wages and benefits) and proprietor income. [3] [3] Value Added – The value of a combination of innovation and improvement made as basic resources and intermediate goods are processed into final goods. [4] [4] Output – The value of industry output or contributions to regional gross domestic output.
![Economic Impact Summary Impact Type EmploymentLabor IncomeValue AddedOutput Direct1,154 $33,769,29 3 $48,167,15 0 $84,412,40 6 Indirect193$7,249,456 $12,862,38 8 $24,591,40 6 Induced194$7,139,014 $12,946,73 4 $22,777,40 9 Total1,541 $48,157,76 3 $73,976,27 2 $131,781,2 21 Multipli er % Share of Total Impact Visitor97.0%96.7%97.0%97.2% Local3.0%3.3%3.0%2.8% [1] [1] Employment – The number of jobs created or sustained.](http://images.slideplayer.com/16/4882596/slides/slide_7.jpg "[2] [2] Labor Income – The amount of income including employee compensation (wages and benefits) and proprietor income. [3] [3] Value Added – The value of a combination of innovation and improvement made as basic resources and intermediate goods are processed into final goods. [4] [4] Output – The value of industry output or contributions to regional gross domestic output..")
8
Visitor Profile Visitor Age Distribution Age: 0 - 121311% Age: 13-1865% Age: 19 - 3043% Age: 31 - 502823% Age: 51+7158% Distance of Travel From Home (Miles) 0-2554% 26-5022% 51-10022% 101-3001210% >30010183% Pathways part of original plans? Yes8368% No3932% Trails Primary Reason for Visit? Yes2319% No9981% First visit to Grand Teton Region Pathways? Yes4537% No7763%

9
Average Daily Visitor Expenditures Expenditure CategoryAmount Restaurants$57.13 Lodging$154.67 Historical sites, zoos, and parks$5.08 Retail stores$26.02 Museums & performing arts$1.25 Other amusement & recreational activities$13.85 Bicycle rental & equipment$19.34 Fuel$9.85 Total$287.20

10
Local Resident Expenditures Average Annual Local Expenditures Bike Equipment$1,090.65 Grocery$176.79 Medical$137.85 Other$143.33 Total$1,548.62

15
Top 10 Industries Impacted Industry DescriptionEmployment Labor Income Value Added Output Hotels and motels, including casino hotels 561$19,290,93 3 $30,527,32 5 $51,789,9 12 Full-service restaurants410$9,060,153$9,833,149$19,803,5 71 Retail - Sporting goods, hobby, musical instrument and book stores 78$1,931,456$2,720,608$4,392,33 2 Other amusement and recreation industries 62$1,693,934$2,902,304$4,658,29 4 Retail - General merchandise stores 44$1,384,485$1,943,807$3,093,08 2 Real estate39$664,758$4,773,559$6,274,36 0 All other food and drinking places 20$467,096$582,181$1,451,08 5 Museums, historical sites, zoos, and parks 18$694,739$781,195$1,641,75 1 Limited-service restaurants 13$335,756$468,523$738,167 Services to buildings11$224,329$313,017$524,587

Similar presentations


 Value-added outcomes (not outputs) Performance Measurement GPRA requires that each.>")


 tourism is the world’s largest industry According to World Tourism.>")


 Industry Employment Projection Report: 2010-2020 EmploymentProjected Change NAICS.>")
