Download presentation
Presentation is loading. Please wait.

1
Customer: Rosalva Gallardo Team members: Susan Lin Buda Chiou Jim Milewski Marcos Mercado November 23, 2010

2
Primary Purpose Method Overview Usability experiments Data Collection Preliminary Results Current Status and Updated Project Plan Q&A

3
Does the new “treatment” interface improve the usability of the metrics?

4
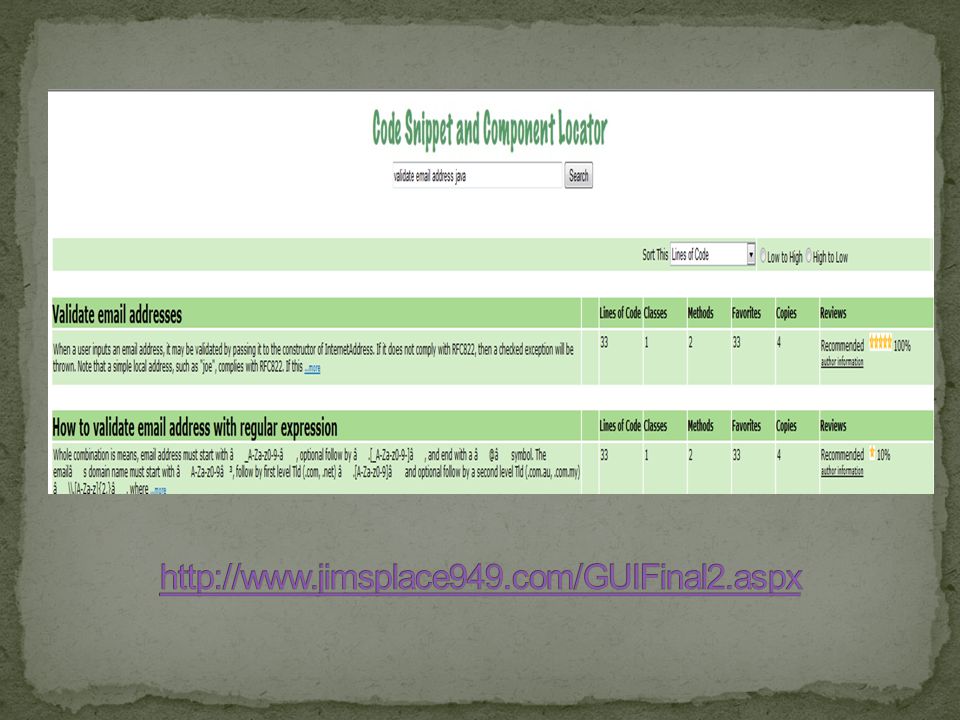
Does the new “treatment” interface improve the usability of the metrics? Introduced sort functionality for metrics

5
Does the new “treatment” interface improve the usability of the metrics? Changed the presentation of the metrics

6
Does the new “treatment” interface improve the usability of the metrics? Included a mix of graphics and text for the “Reviews” metric

7
Does the new “treatment” interface improve the usability of the metrics? Introduced Reviewer’s information

8
Pilot test plus 15 usability experiments performed in the Hana Lab Average experiment time 1.5 hours Some experiments ran in parallel. Monetary compensation and incentive provided to accomplish tasks.

9
Experiments were run according to client’s Handbook for Source Code Retrieval Experiment. Welcome and study information sheet/consent Instructions to subject and general scenario Practice task with scenario 4 Experiment Tasks with scenarios and post-task questionnaires Participant’s background questionnaire Debriefing Interview

10
Think aloud protocol Excel file filled in while participant performed the tasks Morae recording Questionnaire after each task Debriefing interview Subject background questionnaire

11
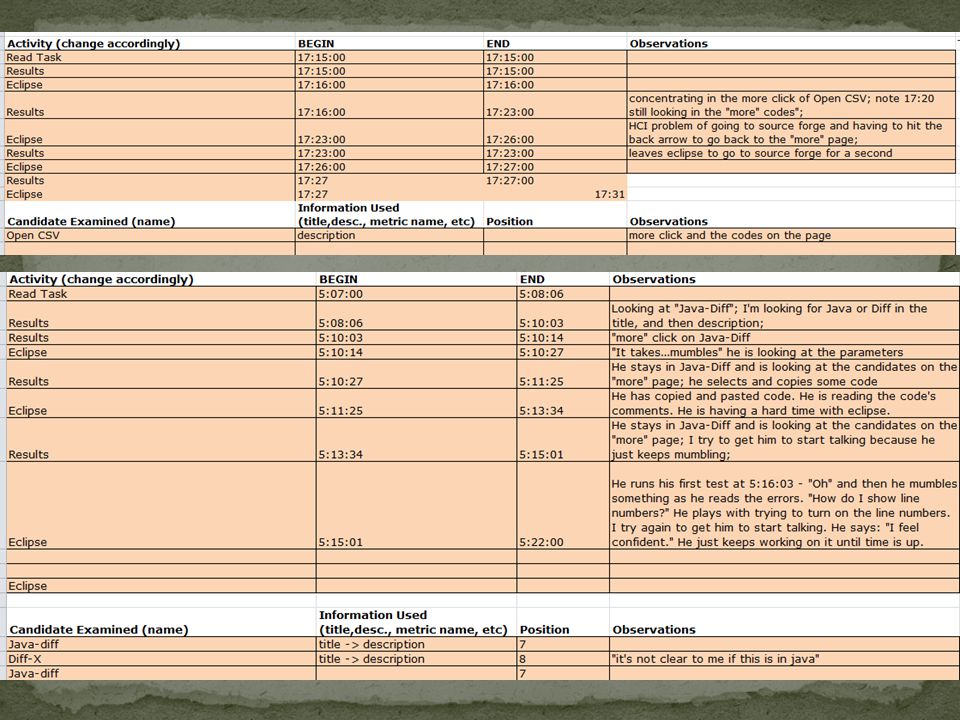
Video recordings analyzed (1 video = 5.5 hours) Before and after pages highlighting some of the changes e.g. you needed to capture the observations of the participants and couldn’t really focus on how quickly they were switching between screens Seconds, Observations, Candidates

18
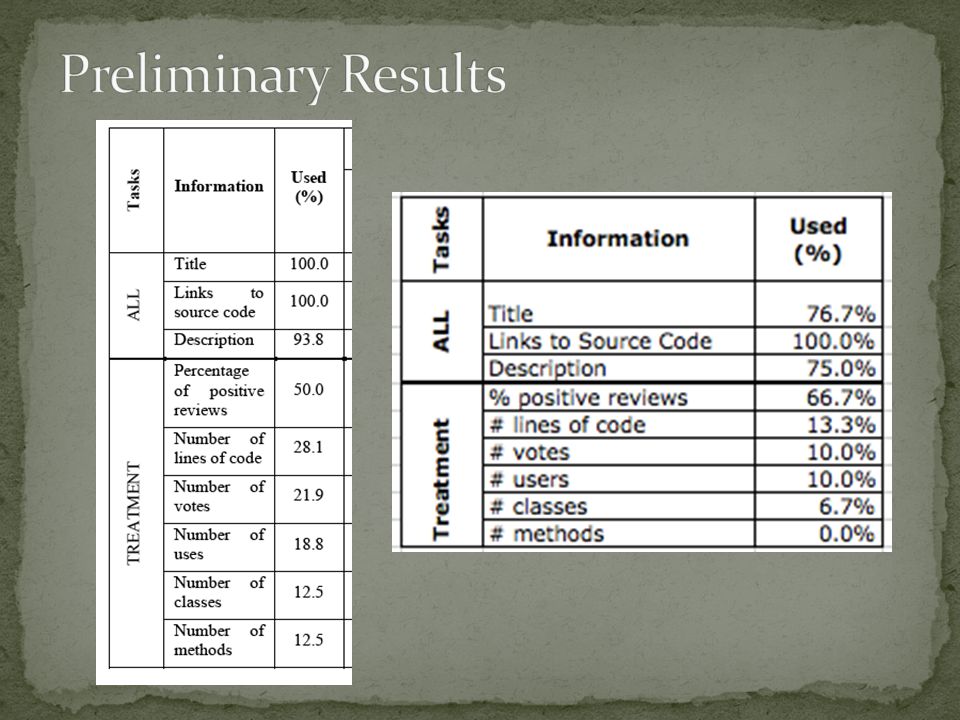
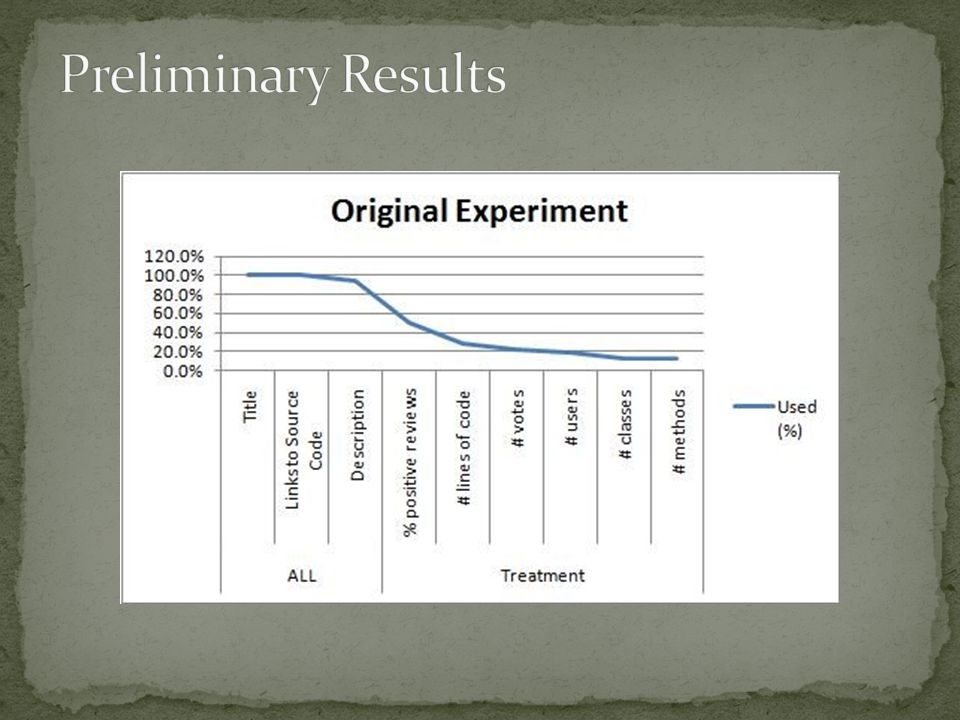
Similar trend is observed except for Reviews where we combined graphics and text Increase of Reviews usage New layout for metrics presented in text only did not alter the trend.

22
Original Experiment Customer goals were: Understand the strategies and information software developers use when they select a source code search result from the Web Identify the relationship among strategies, information used, and successful completion of the experiment’s tasks.

23
New Experiment Customer goals are: Same as in the original experiment Analyze how an enhanced GUI will influence users’ decisions on the information they use. Variants: New participants Use of an enhanced treatment GUI Use of a log mechanism to assist in the collection of experiment data related to GUI usage.

24
1. Implement user interface enhancements to experiment’s treatment GUI. 2. Implement an automated log mechanism to capture certain events during GUI usage. 3. Conduct new experiment 4. Analysis of results

25
Usability problemCustomer’s ViewTeam’s initial thoughts Users failed to quickly understand the information provided in the search results. “We argue that evaluation performance can be improved by increasing understanding of search results…” (Gallardo & Sim. “StrategiesInfoUsed_Paper _v10.pdf”, p.1. In submission to CHI’10) We believe that in order to increase understanding of search results, interface needs to be easy to understand at first glance. Sorting of results was not available to users. Allow users to sort by popularity and software quality metrics. This may help users choose the best candidate. Agree with customer
 We believe that in order to increase understanding of search results, interface needs to be easy to understand at first glance. Sorting of results was not available to users. Allow users to sort by popularity and software quality metrics. This may help users choose the best candidate. Agree with customer.")
26
Usability problemCustomer’s ViewTeam’s initial thoughts Additional information (popularity and technical metrics) was shown to assist users in choosing the best candidate. This information was ignored or not frequently used. Surprisingly, metrics were only used 12.5%-50% of the time. Change the presentation and location of these metrics to make them more eye catching. The additional information should mix graphics and text to make it more appealing. However, it should not give a cluttered feel to the interface. IdemPerhaps the additional information was ignored because seemed irrelevant to the user. Include information about people who wrote the reviews on each candidate (one of the popularity metrics). We will perform comparative analysis of similar web sites as well as brainstorming sessions to decide what information to include.
. We will perform comparative analysis of similar web sites as well as brainstorming sessions to decide what information to include..")
27
Google Code, Koders.com, Source Forge, Ohloh

28
Prototypes

30
Number & type of users: 16 ICS students with experience in Java (13 graduate-level and 3 undergraduate). Tasks for users and questions we will ask them: CSV task: Find the best source code to read a CSV file and place the data into a list of strings. DIFF task: Find the best source code to compare two text files and show the differences. EMAIL VALIDATION task: Find the best source code to validate email addresses. TIMEZONE task: Find the best source code to convert date & time between different time zones.

31
Strategies for involving users Recruitment email Use of incentives Where… Will meet them in the Hana Lab Each meeting will last 1.5-2 hrs

32
http://www.jimsplace949.com/ProjPlan_Project7_SrcCdSrchExperiment.ht ml

Similar presentations


 Soo-Yung Cho (sc444) Gregg Herlacher (gah24)>")


