Download presentation
Presentation is loading. Please wait.

1
Salary Findings April 25 th, 2011 Faculty Senate Budget Committee

2
Recommendations 1.The University of Wyoming should compare UW faculty salaries by rank and discipline to a set of institutions we compete with and aspire to. – Standard comparator data includes schools that are not relevant to our mission and aspirations. 2.The University of Wyoming should redefine the salary benchmark used in UP3 from 50th percentile to a percent of market. – Usual data is not defined by percentiles.

3
Background on comparisons OSU survey: 115 Association of Public and Land-Grant Universities and other public institutions To evaluate salaries UW uses – OSU average over all disciplines (at UW) vs. UW overall average. – by discipline at UW vs. department averages.

4
Is OSU Data out of date? OSU salaries used for analysis based on 2009- 2010 data. Likely not out of date. – Most public institutions are under wage freezes. Other non-OSU surveys show : – Median salary increase for public institutions: 0% for past two years Only new assistants at public institutions showed an increase in 2010 Private institutions: median increase 2%

5
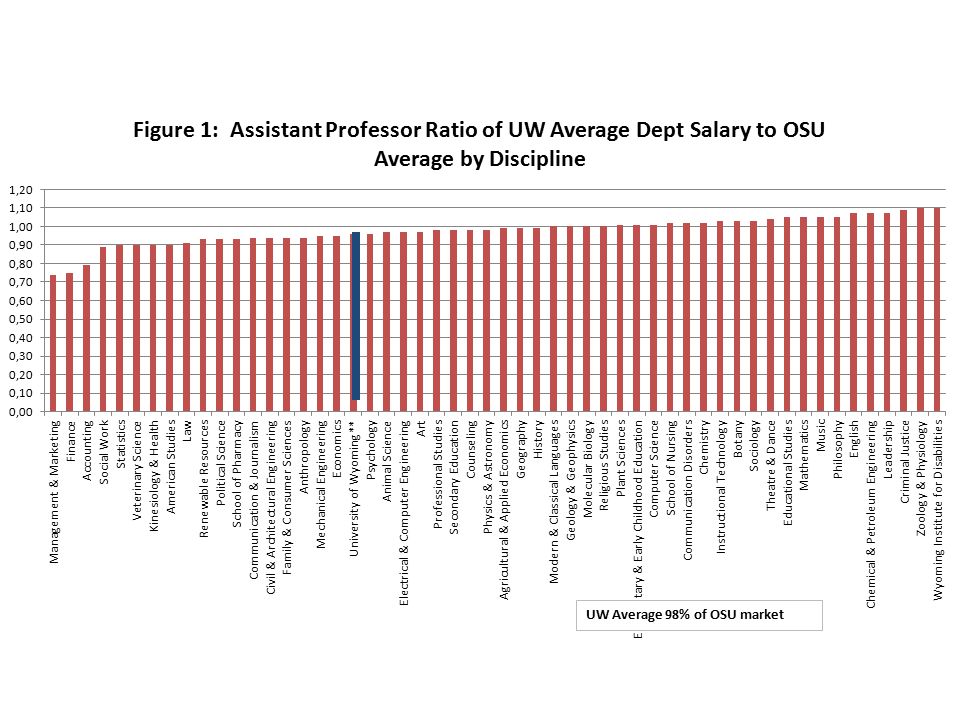
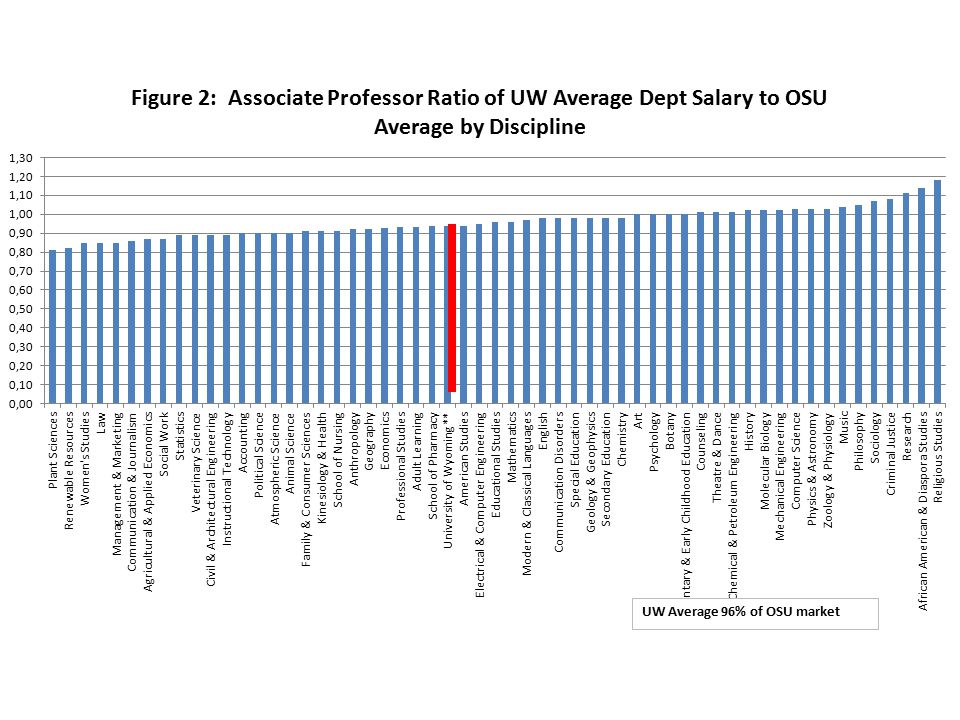
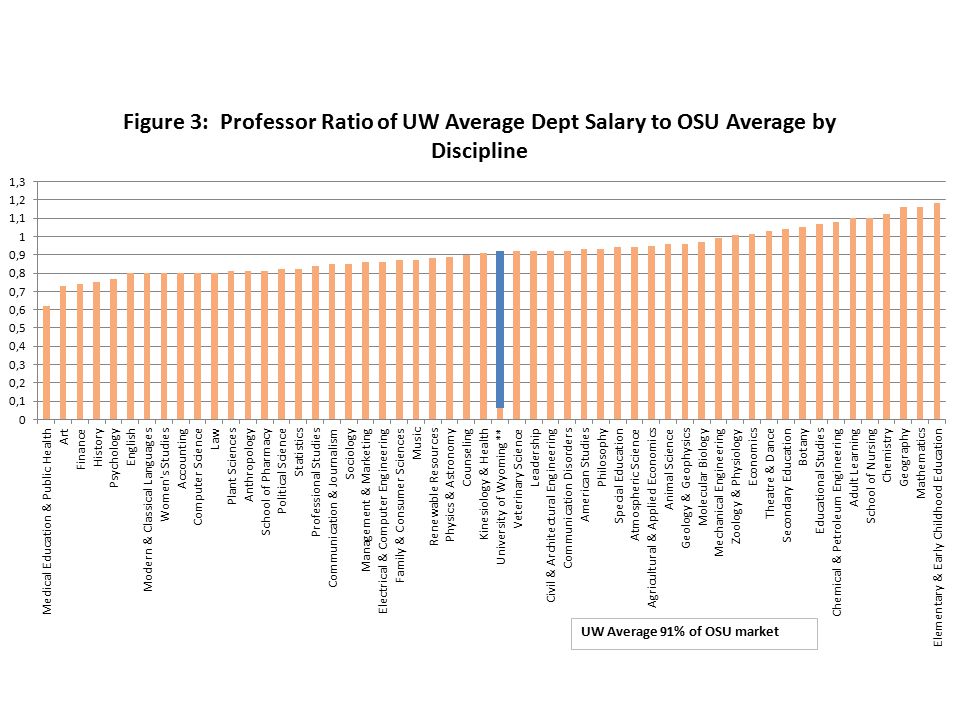
Data - Where are we? RankNumber of Faculty Number of Departments Average Salary (Average of Department Averages) OSU Average Salary across UW Disciplines UW% of Market* Professors 21353$104,290$114,021 91% (91%) Associate Professors 19656$75,980$81,103 96% (94%) Assistant Professors 17253$66,734$69,293 98% (96%) Total Faculty 581
 OSU Average Salary across UW Disciplines UW% of Market* Professors 21353$104,290$114,021 91% (91%) Associate Professors 19656$75,980$81,103 96% (94%) Assistant Professors 17253$66,734$69,293 98% (96%) Total Faculty 581.")
6
Source: OIA data and Annual Report on the Economic Status of the Profession

7
Salary Results By rank, UW average salaries vary with respect to market target levels – Assistants at market target (98%) – Associates near target (96%) – Full Professors above 90% (91%) Salary problems differ by college and discipline.
 – Associates near target (96%) – Full Professors above 90% (91%) Salary problems differ by college and discipline.")
11
College Results CollegeAverage % of Market Education100% Arts & Sciences97% Engineering95% Agriculture92% Health Sciences91% Business85% Law82% UW93% College results based on simple average of Department all-rank results. Department results use rank averages weighted by faculty number in each rank. to generate an all-rank % of market.

12
Compression Two types: – Rank-compression: when a senior rank is paid less than a lower rank in a department. No indication this occurring on campus systematically. On average full professors earn 29% more than Associates by department. Associates on average earn 10% more than assistants by department. – Market compression: when senior ranks are farther from market than more junior ranks. This exists as previously shown.

13
Faculty below 90% of market RankNumber of Departments* Number of Faculty in identified departments Full25 (47%)109 (19%) Associate12 (21%)36 (6%) Assistant4 (8%)18 (3%) UW reference60 departments581 Data based on dept. average salaries vs. OSU salary by discipline *53 departments have assistant and full professors, 56 include associates.

14
Future market compression Currently Full professors earn 29% more than associates – As current Full Professors retire and Associates are promoted with 10% increase, this differential will be eroded. Current Full Professors are paid lowest relative to market despite highest pay on campus. – This will worsen unless future Full Professors are made closer to market upon promotion.

15
Recommendations 3.UW should adopt the 20% compensation increase defined in Action Item 65 for promotion from Associate to Full as soon as possible. – Current differentials between Full and associate professor largely established with recent salary adjustments. – These will be eroded over time given current 10% promotion policy.

16
Recommendations 4.Future UW budget requests should seek two separate salary adjustment pools every biennium. – The “catch-up” pool (Administrative) for promotion, special individual and faculty market, gender inequality, and compression adjustments. – The “keep-up” pool for increases to maintain salary purchasing power eroded by inflation, and to remain competitive with the university benchmark salary levels.
 for promotion, special individual and faculty market, gender inequality, and compression adjustments. – The keep-up pool for increases to maintain salary purchasing power eroded by inflation, and to remain competitive with the university benchmark salary levels..")
17
Wyoming Cost of Living 2Q 2010 – Statewide: 1.9% – Southeast Region: 2.6% 2009 (average reading) – Statewide: 1.4% – Southeast Region: 1.8% 2008 (average reading) – Statewide: 5.3% – Southeast Region: 4.4% Source: Wyoming Economic Analysis Division
 – Statewide: 1.4% – Southeast Region: 1.8% 2008 (average reading) – Statewide: 5.3% – Southeast Region: 4.4% Source: Wyoming Economic Analysis Division")
18
Recommendations 5.The University of Wyoming should implement health insurance coverage to the domestic partners of UW faculty and staff beginning with the 2011-2012 academic year. – This maintains competitiveness with aspirational comparators.

19
Benefits Our benefits are very competitive with the schools we defined as regional competitors and aspirational comparators. UW retirement plan equivalent to a 3% salary advantage because of low employee contribution rate required. Domestic partner benefit has been approved but not implemented at UW. – This benefit is commonplace among relevant public institutions.

20
Diff to UW % Diff to UW Tax Adj % Diff to UW Tax+COL Adj % Diff to UW Tax+COL+Ben Adj % Diff to UW FICA % diff Univ. of Washington$96,500$17,60022.3%19.0%12.9%8.1% University of Utah$83,600$4,7006.0%-0.2%3.5%4.5% Univ. of Nebraska$87,300$8,40010.6%-0.9%7.4%4.3% UW$78,900$00.0% Colorado State Univ.$89,100$10,20012.9%6.3%2.6%-2.2%-11.9% Univ. of Arizona$89,000$10,10012.8%6.3%1.1%-2.8% Univ. of New Mexico$79,100$2000.3%-5.2%-5.4%-10.7% Utah State$70,800-$8,100-10.3%-15.7%-12.6%-11.7% Washington State$76,800-$2,100-2.7%-5.7%-10.6%-14.4% Univ. of Idaho$70,400-$8,500-10.8%-18.7%-13.7%-17.1% Univ. of Oregon$76,000-$2,900-3.7%-6.1%-16.1%-18.8% Oregon State$72,700-$6,200-7.9%-10.3%-19.9%-22.4% New Mexico State$63,100-$15,800-20.0%-24.7%-24.8%-29.0% Adjustments Make a difference… Source: OIA data and Various tax sources – author’s computations. COL = cost of living, benefits adjusted for favorable UW retirement contributions. Tax adjustments include property, income and sales taxes. Colorado State has withdrawn from Social Security.

21
Other Tables

22
Compression Dollars Needed (if all salaries below target were addressed) Market Target (% of OSU) Full ProfFull+30% benefits Assoc ProfAssoc+30% benefits Asst. ProfAsst. + 30% benefits Total (including benefits) 100%$2,671,637$3,473,128$885,567$1,151,237$775,088$1,007,614$5,631,979 95%$1,736,545$2,257,509$410,273$533,355$466,106$605,938$3,396,802 90%$985,465$1,281,105$204,176$265,429$303,932$395,112$1,941,646 Based on OSU tables 2009-2010 average salaries by discipline and rank, and 2010 UW salary data -Table computed using the difference between the OSU average and the reported average salary by rank, by department. This average difference was multiplied by the faculty in the associated department and these department totals were summed across departments whose average salaries were below the OSU target indicated. -Assistants are dominated by three departments (Management and Marketing, Finance and Accounting) below 90%, three of which include 15 professors. Cost to adjust just these faculty would be $301,554 before benefits adjustment. The fourth department is statistics below 90% but cost to adjust the three faculty in this department is $2,378 before benefits
 100%$2,671,637$3,473,128$885,567$1,151,237$775,088$1,007,614$5,631,979 95%$1,736,545$2,257,509$410,273$533,355$466,106$605,938$3,396,802 90%$985,465$1,281,105$204,176$265,429$303,932$395,112$1,941,646 Based on OSU tables average salaries by discipline and rank, and 2010 UW salary data -Table computed using the difference between the OSU average and the reported average salary by rank, by department. This average difference was multiplied by the faculty in the associated department and these department totals were summed across departments whose average salaries were below the OSU target indicated. -Assistants are dominated by three departments (Management and Marketing, Finance and Accounting) below 90%, three of which include 15 professors. Cost to adjust just these faculty would be $301,554 before benefits adjustment. The fourth department is statistics below 90% but cost to adjust the three faculty in this department is $2,378 before benefits.")
23
Faculties below 95% and 100% of market Departments100% of market95% of Market90% of Market Number of Departments below market average 29164 Number of Departments at or above market average 243749 Proportion of Total below55%30%8.1% Lowest vs. Market comparator*74% of market (1) 110% of market (2) Highest vs. Market comparator* Number of Departments at market 4 at 100%2 at 95%4 at 90% Assistant Professors data based on dept. average salaries vs. OSU salary by discipline * Number of departments reporting this average level to market
 110% of market (2) Highest vs. Market comparator* Number of Departments at market 4 at 100%2 at 95%4 at 90% Assistant Professors data based on dept. average salaries vs. OSU salary by discipline * Number of departments reporting this average level to market.")
24
Faculties below 95% and 100% of market Departments100% of market95% of Market90% of Market Number of Departments below market average 362612 Number of Departments at or above market average 203045 Proportion of Total below64%46%21% Lowest vs. Market comparator*81% of market (1) 118% of market (1) Highest vs. Market comparator* Number of Departments at market4 at 100%1 at 95%4 at 90% Associate Professors data based on dept average salaries vs. OSU salary by discipline * Number of departments reporting this average level to market
 118% of market (1) Highest vs. Market comparator* Number of Departments at market4 at 100%1 at 95%4 at 90% Associate Professors data based on dept average salaries vs. OSU salary by discipline * Number of departments reporting this average level to market.")
25
Faculties below 95% and 100% of market Departments100% of market95% of Market90% of Market Number of Departments below market average 403525 Number of Departments at or above market average 131828 Proportion of Total below75%66%47% Lowest vs. Market comparator*62% of market (1) 118% of market (1) Highest vs. Market comparator* Number of Departments at market2 at 101%1 at 95%1 at 90% Full Professors data based on dept average salaries vs. OSU salary by discipline * Number of departments reporting this average level to market
 118% of market (1) Highest vs. Market comparator* Number of Departments at market2 at 101%1 at 95%1 at 90% Full Professors data based on dept average salaries vs. OSU salary by discipline * Number of departments reporting this average level to market.")
26
Quartile Analysis by Department DepartmentsNumber of Faculty Average % of market Maximum % of market (number of faculty) Minimum % of market (number of faculty) Bottom quartile4777%81% (5)62% (1) 26%-50%6486%91% (1)81% (5) 51-75%5594%99% (4)92% (5) Top: 76%-100%50108%118% (3)101% (10) Full Professors data based on dept average salaries vs. OSU salary by discipline Quartiles defined by Department % of Market

27
Quartile Analysis by Department DepartmentsNumber of Faculty Average % of market Maximum % of market (number of faculty) Minimum % of market (number of faculty) Bottom quartile4187%90% (3)81% (2) 26%-50%5392%96% (4)90% (3) 51-75%6399%101% (1)96% (10) Top: 76%-100%44106%118% (2)101% (3) Associate Professors data based on dept average salaries vs. OSU salary by discipline Quartiles defined by Department % of Market

28
Quartile Analysis by Department DepartmentsNumber of Faculty Average % of market Maximum % of market (number of faculty) Minimum % of market (number of faculty) Bottom quartile3688%94% (1)74% (8) 26%-50%5496%99% (7)94% (5) 51-75%40101%103% (2)99% (3) Top: 76%-100%48106%110% (1)103% (3) Assistant Professors data based on dept average salaries vs. OSU salary by discipline Quartiles defined by Department % of Market

Similar presentations


 May 12 th, 2011 Rob Godby.>")
