Download presentation
Presentation is loading. Please wait.

1
By Jacob Opadeyi PhD, Gabrielle Thongs MSc, Leah Fouchong BSc, Roxann Smith BSc, Desiree Joseph Bsc, Shelly Bradshaw BSc Department of Geomatics Engineering and Land Management The University of the West Indies St. Augustine Trinidad

2
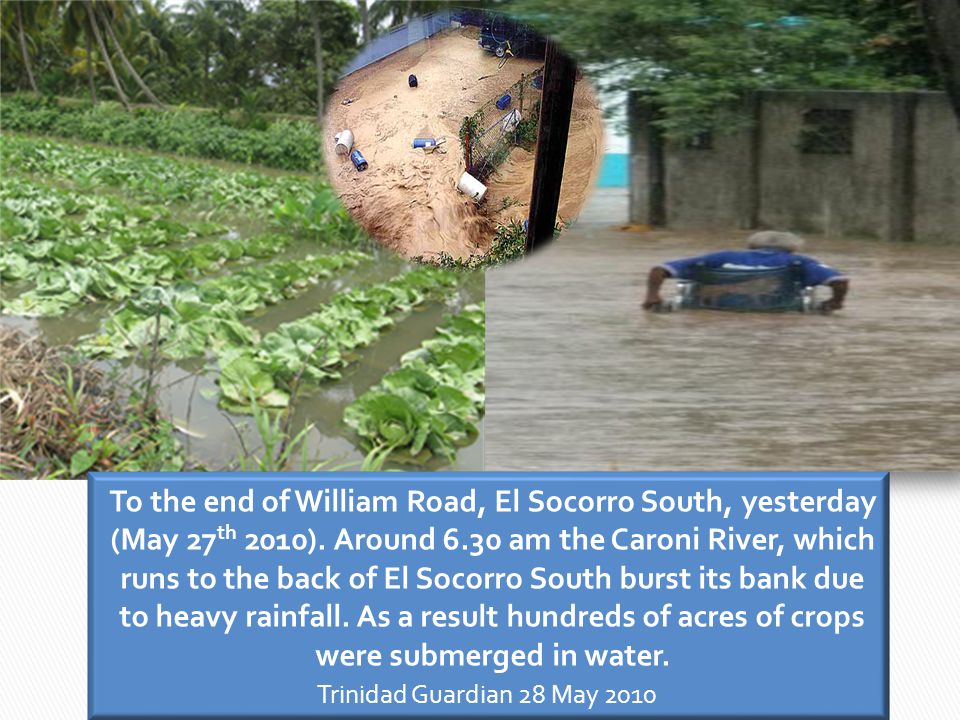
Background The location of the Trinidad in the extreme south of the Caribbean means the country experiences a tropical marine climate. Floods and landslides are annual events associated with the rainy season in Trinidad and Tobago. Flooding and landslides are the most common and significant localized hazard.

4
Geraldo Greene, a 76-year old pensioner suffered a cruel death on Friday when a landslide destroyed part of his Santa Cruz home killing him in the process. Trinidad Express - Aug 6, 2001

5
Background Trinidad and Tobago faces a number of natural disaster issues Vulnerability assessment and risk mapping are the important first steps for any initiative for disaster reduction. A risk assessment is not only to find out where risk related problems are located, but also to quantitatively or qualitatively determine the significance of risks (Smith 2001, Greiving et al 2006)
.")
6
Landslide and Flood Risk Mapping Objective To evaluate and rank the risk level to landslide of the resident population and the physical assets (buildings) of Trinidad. Input data Landslide susceptibility maps Population spatial distribution Building spatial distribution

7
Conceptual Design Areal Population Density Landslide Susceptibility Population Risk to Landslide Risk = Susceptibility + vulnerability (Population, Buildings) Areal Buildings Density Buildings Risk to Landslide Buildings & Population Risk to Landslide Inputs Results
 Areal Buildings Density Buildings Risk to Landslide Buildings & Population Risk to Landslide Inputs Results")
8
Landslide Susceptibility

9
Instability Factors Tectonic Features Lithological Formation Slope Angle Road Network Drainage Network Land Use Rainfall

10
Cartographic Model - Landslide Ranking Weighting

11
Landslide Factor Ranking Instability Factors Classification Susceptibility Level Rank Road NetworkProximity (m) 0-100mVery High 5 101-200mHigh 4 201-300mHigh 3 301-400mModerate 3 401-500mLow 2 501-600mLow 2 >600mVery Low1
 0-100mVery High mHigh mHigh mModerate mLow mLow 2 >600mVery Low1")
12
Landslide Factor Weighting: Scenario E Instability Factors Scenario E % Tectonic Features 20.20 Lithological Formation 20.20 Slope Angle 20.20 Land Use 10.10 Drainage Network 10.10 Road Network 10.10 Rainfall 10.10 Total 101

14
Landslide Susceptibility Map Summation of land areas in each susceptibility class ClassesCOUNTArea by cellArea (ha)% of total Very Low 6159,360 615936,000 61,59412.93 Low 15534,674 1553467,400 155,34732.62 Moderate 14014,869 1401486,900 140,14929.42 High 8397,885 839788,500 83,97917.63 Very High 3522,375 352237,500 35,2247.40 Total 4762916,300 476,292100.00
% of total Very Low 6159, ,000 61, Low 15534, , , Moderate 14014, , , High 8397, ,500 83, Very High 3522, ,500 35, Total , ,")
18
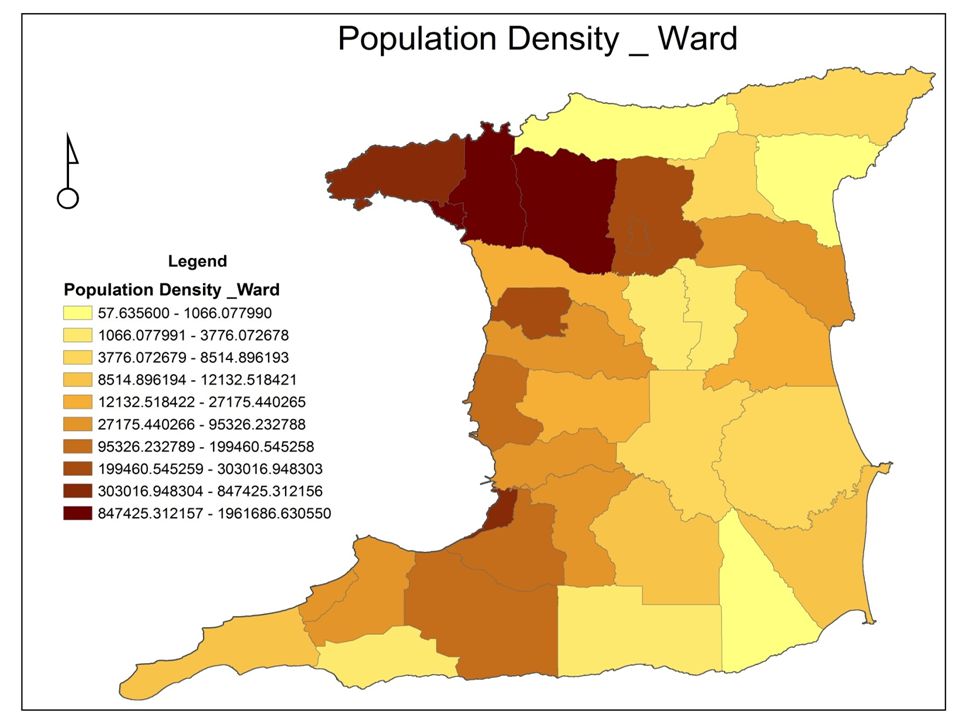
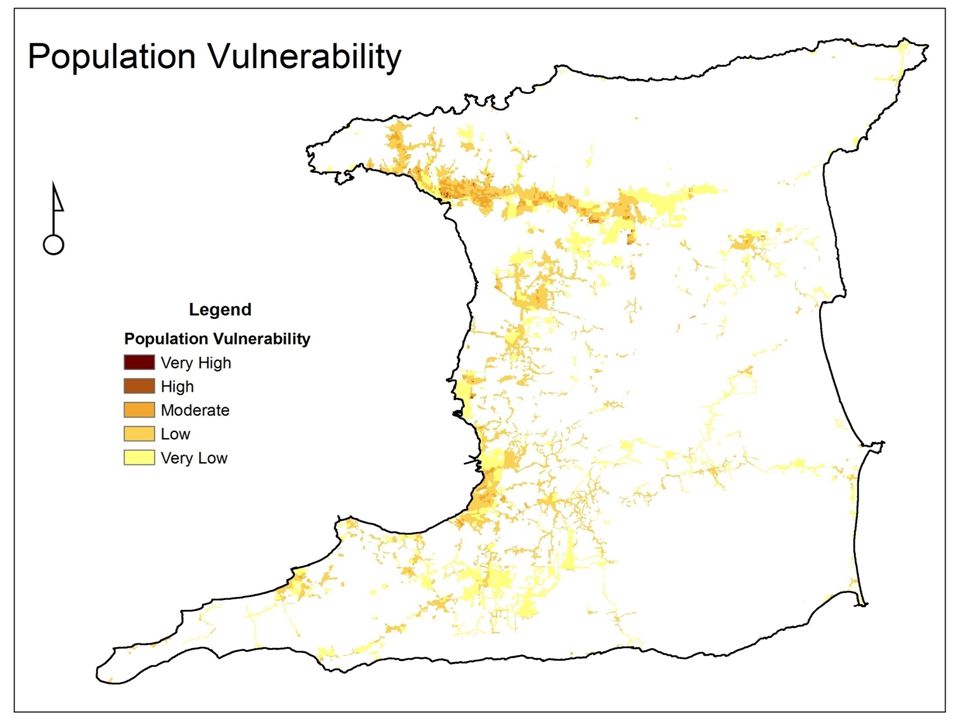
Population Density Classification Scheme Population Density by ED per hectaresVulnerability level 0 - 19Very Low 19 - 76Low 76 - 191Moderate 191 - 1,032High 1,032 - 4,874Very High

23
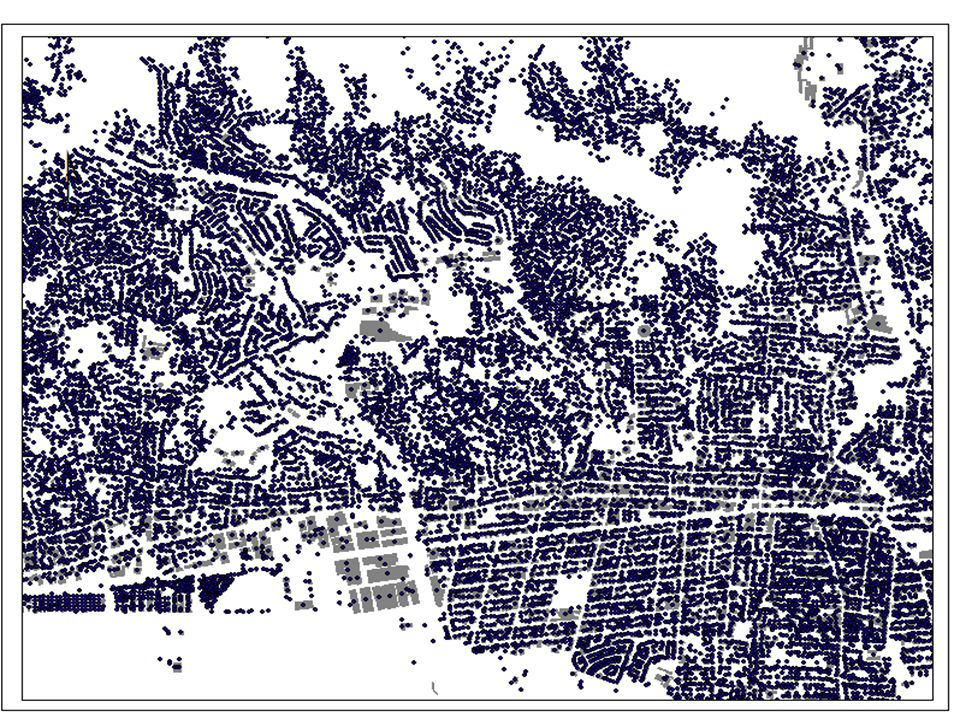
Building Density Classification Scheme Building Density By ED per hectaresVulnerability level 0 - 8Very Low 8.0 - 20Low 20 - 51Moderate 51 - 135High 135 - 441Very High

24
Vulnerability Population Vulnerability Class Building Vulnerability Class Very LowLowModerateHighVery High 12345 Very low123456 Low234567 Moderate345678 High456789 Very High5678910 Risk LevelRisk Value Very low<3<3 Low3-5 Moderate6 High7 Very High> 7

26
Single-Risk (Population) Map Single-Risk (Buildings) Map Multi-Risk (Buildings and population) Map Results: Landslide Risk Maps
 Map Single-Risk (Buildings) Map Multi-Risk (Buildings and population) Map Results: Landslide Risk Maps")
27
Landslide Population Risk Assessment

28
Single Risk Classification Scheme Vulnerability Class Susceptibility Class Very LowLowModerateHighVery High 12345 Very low123456 Low234567 Moderate345678 High456789 Very High5678910 Risk LevelRisk Value Very low< 3 Low3-5 Moderate6 High7 Very High> 7

30
Landslide Population Risk (Sum of Land Area under each risk level) Risk Level Number of cellsArea (m2)Area (HA) % of Trinidad urban land mass Very Low 32,3523,235,200323.520.61% Low 523,05652,305,6005,230.569.84% Moderate 1,188,482118,848,20011,884.8222.36% High 1,485,898148,589,80014,858.9827.96% Very High 2,084,492208,449,20020,844.9239.22%
 Risk Level Number of cellsArea (m2)Area (HA) % of Trinidad urban land mass Very Low 32,3523,235, % Low 523,05652,305,6005, % Moderate 1,188,482118,848,20011, % High 1,485,898148,589,80014, % Very High 2,084,492208,449,20020, %")
31
Landslide Building Risk Assessment

33
(Sum of Built-up Area under each risk level) Risk Level Number of cellsArea (m2)Area (HA) % of Trinidad urban land mass Very Low 648,67964,867,9006,48612.2% Low 1,271,283127,128,30012,71223.9% Moderate 1,513,640151,364,00015,13628.5% High 1,249,585124,958,50012,49523.5% Very High 631,09363,109,3006,31011.9%
 Risk Level Number of cellsArea (m2)Area (HA) % of Trinidad urban land mass Very Low 648,67964,867,9006, % Low 1,271,283127,128,30012, % Moderate 1,513,640151,364,00015, % High 1,249,585124,958,50012, % Very High 631,09363,109,3006, %")
34
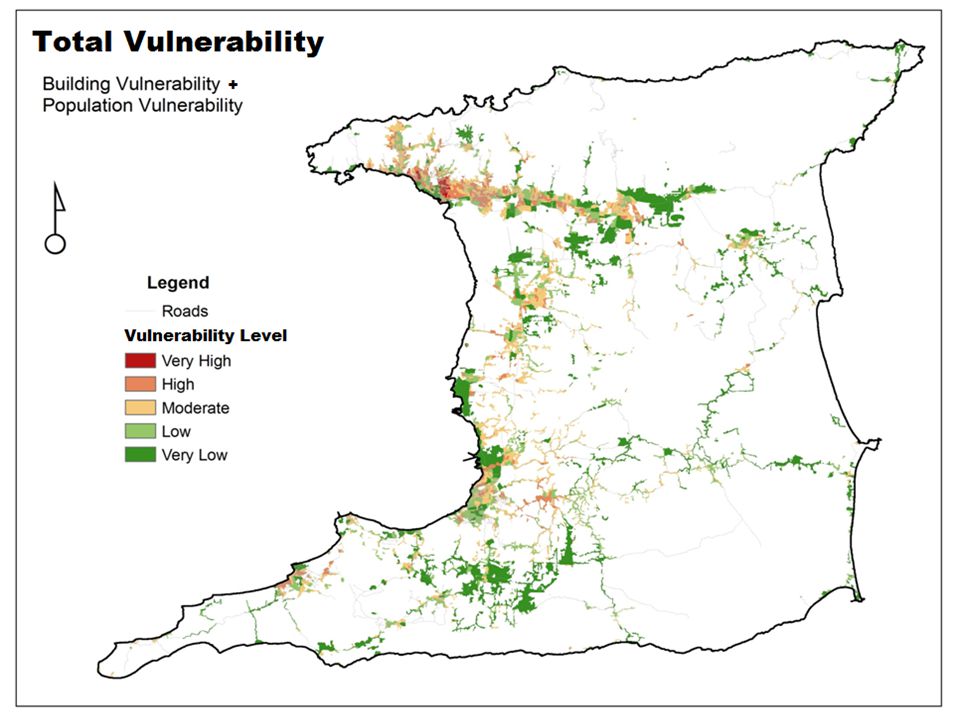
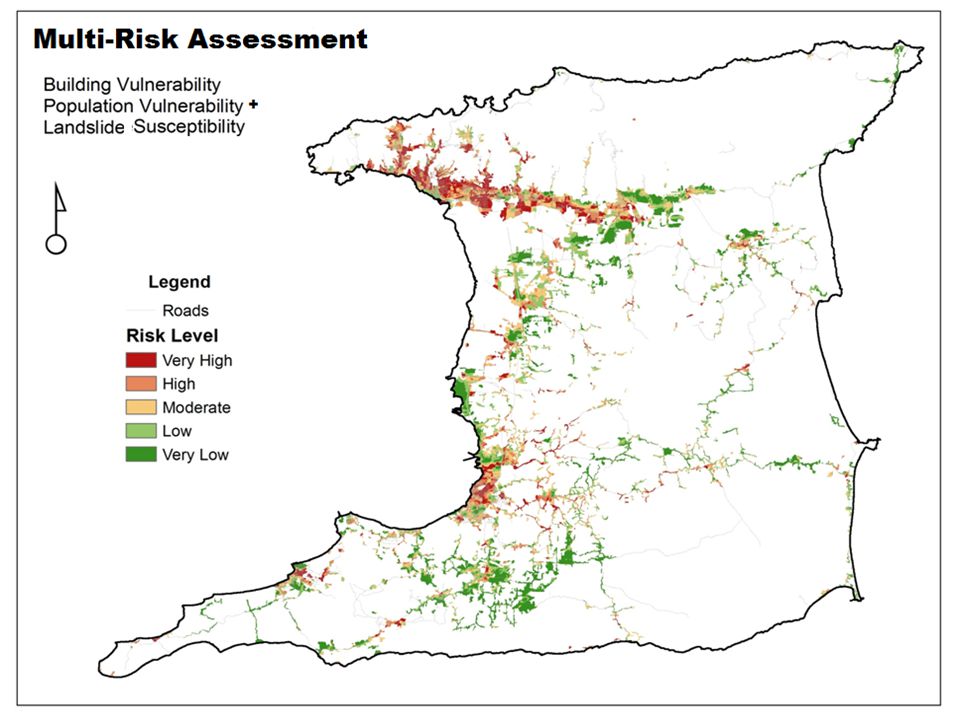
Landslide Multi-Risk Assessment: Building and Population

35
Multi-Risk Classification Scheme Vulnerability Class Susceptibility Class Very Low LowModerateHighVery High 12345 Very low1345671 Low2567892 Moderate378910113 High49101112134 Very High511121314155 Multi-Risk LevelRisk Value Very low< 6 Low6-7 Moderate8-9 High10-11 Very High> 12

38
Landslide Multi (Building & Population) Risk Assessment (Sum of Land Area under each risk level) Risk Level Number of cellsArea (m2)Area (HA) % of Trinidad urban land mass Very Low 505,08850,508,8005,050.889.50% Low 919,68591,968,5009,196.8517.31% Moderate 1,197,265119,726,50011,972.6522.53% High 1,201,305120,130,50012,013.0522.61% Very High 1,490,937149,093,70014,909.3728.06%
 Risk Assessment (Sum of Land Area under each risk level) Risk Level Number of cellsArea (m2)Area (HA) % of Trinidad urban land mass Very Low 505,08850,508,8005, % Low 919,68591,968,5009, % Moderate 1,197,265119,726,50011, % High 1,201,305120,130,50012, % Very High 1,490,937149,093,70014, %")
39
Flood Risk Mapping Objective To evaluate and rank the risk level to flooding of the resident population and the physical assets (buildings) of Trinidad Input data Flood susceptibility Map Population spatial distribution Building spatial distribution
 of Trinidad Input data Flood susceptibility Map Population spatial distribution Building spatial distribution")
40
Conceptual Design Areal Population Density Flood Susceptibility Population Risk to Flooding Risk = Hazard Susceptibility + Vulnerability (Population, Buildings) Areal Buildings Density Buildings Risk to Flooding Buildings & Population Risk to Flooding Inputs Results
 Areal Buildings Density Buildings Risk to Flooding Buildings & Population Risk to Flooding Inputs Results")
42
Flood Factors Rainfall (mm) Slope (%) Land Use Drainage density Road (% each watershed) Elevation (m)
 Slope (%) Land Use Drainage density Road (% each watershed) Elevation (m)")
43
Cartographic Model - Flood Ranking Weighting

45
Flood Susceptibility Map Summation of land areas in each susceptibility class ClassesCOUNTArea by cellArea (ha)% of total Very Low 2,327,910 232,791,000 23,2794.86 Low 9,959,195 995,919,500 99,59220.79 Moderate 16,847,280 1,684,728,000 168,47335.16 High 13,471,559 1,347,155,900 134,71628.12 Very High 5,304,962 530,496,200 53,05011.07 Total 4,791,090,600 479,109100.00
% of total Very Low 2,327, ,791,000 23, Low 9,959, ,919,500 99, Moderate 16,847,280 1,684,728, , High 13,471,559 1,347,155, , Very High 5,304, ,496,200 53, Total 4,791,090, ,")
47
Population Vulnerability Classification Scheme Population Density By ED per hectaresVulnerability level 0 - 19Very Low 19 - 76Low 76 - 191Moderate 191 - 1,032High 1,032 - 4,874Very High

49
Building Vulnerability Classification Scheme Building Density By ED per hectaresVulnerability level 0 - 8Very Low 8.0 - 20Low 20 - 51Moderate 51 - 135High 135 - 441Very High

51
Single-Risk (Population) Map Single-Risk (Buildings) Map Multi-Risk (Buildings and population) Map Results: flood risk maps
 Map Single-Risk (Buildings) Map Multi-Risk (Buildings and population) Map Results: flood risk maps")
52
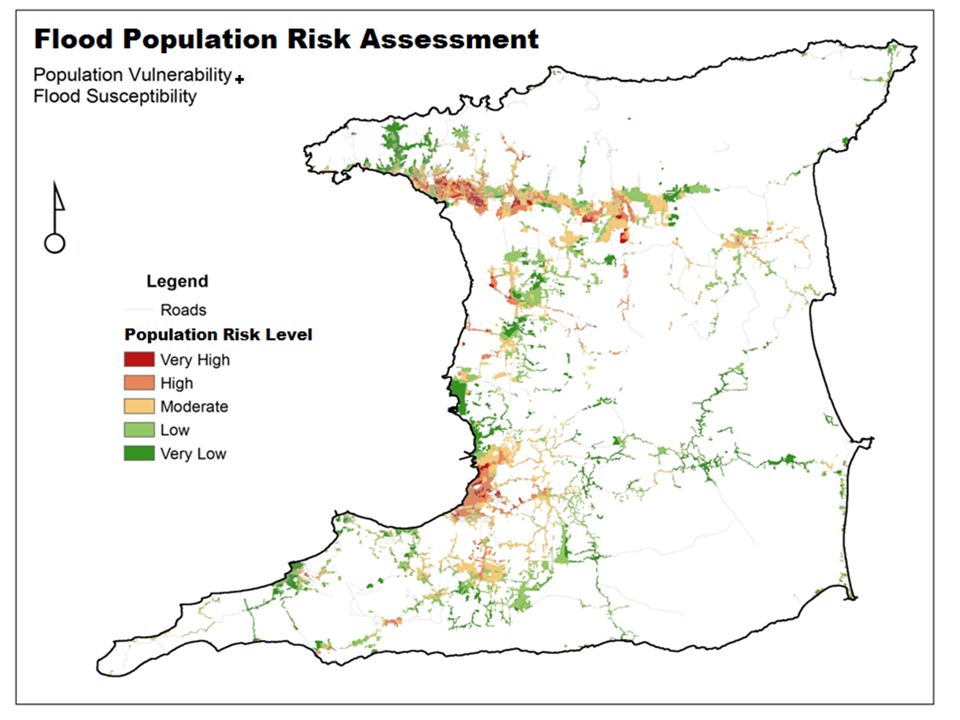
Flood Population Risk Assessment

53
Single Risk Classification Scheme Population Vulnerability Class Susceptibility Class Very LowLowModerateHighVery High 12345 Very low123456 Low234567 Moderate345678 High456789 Very High5678910 Risk LevelRisk Class Very low< 4 Low4-5 Moderate6 High7 Very High> 7

55
Flood Population Risk (Sum of Land Area under each risk level) Risk Level Number of cellsArea (m2)Area (HA) % of Trinidad urban land mass Very Low 1,194,834 119,483,400 11,94822.48% Low 1,687,858 168,785,800 16,87831.76% Moderate 1,644,578 164,457,800 16,44530.95% High 696,494 69,649,400 6,96513.11% Very High 125,510 12,551,000 1,2552.36%
 Risk Level Number of cellsArea (m2)Area (HA) % of Trinidad urban land mass Very Low 1,194, ,483,400 11, % Low 1,687, ,785,800 16, % Moderate 1,644, ,457,800 16, % High 696,494 69,649,400 6, % Very High 125,510 12,551,000 1, %")
56
Flood Building Risk Assessment

58
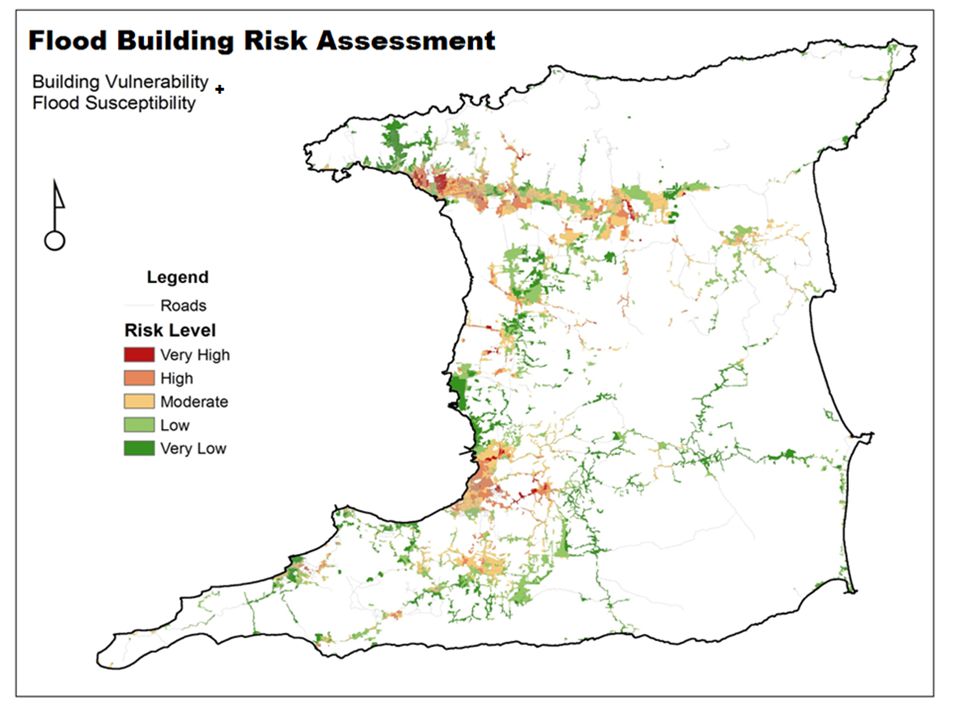
(Sum of Land Area under each risk level) Risk Level Number of cellsArea (m2)Area (HA) % of Trinidad urban land mass Very Low 1,405,680 140,568,000 14,05726.45% Low 1,716,196 171,619,600 17,16232.29% Moderate 1,496,094 149,609,400 14,96128.15% High 625,967 62,596,700 6,26011.78% Very High 105,337 10,533,700 1,0531.98%
 Risk Level Number of cellsArea (m2)Area (HA) % of Trinidad urban land mass Very Low 1,405, ,568,000 14, % Low 1,716, ,619,600 17, % Moderate 1,496, ,609,400 14, % High 625,967 62,596,700 6, % Very High 105,337 10,533,700 1, %")
59
Flood Multi-Risk Assessment: Building and Population

60
Multi-Risk Classification Scheme Vulnerability Class Susceptibility Class Very Low LowModerateHighVery High 12345 Very low1345671 Low2567892 Moderate378910113 High49101112134 Very High511121314155 Multi-Risk LevelRisk Value Very low< 6 Low6-7 Moderate8-9 High10-11 Very High> 12

62
Flood Multi (Building & Population) Risk Assessment (Sum of Land Area under each risk level) Risk Level Number of cellsArea (m2)Area (HA) % of Trinidad urban land mass Very Low 925,747 92,574,700 9,25717.42% Low 1,467,641 146,764,100 14,67627.62% Moderate 1,334,220 133,422,000 13,34225.11% High 1,402,912 140,291,200 14,02926.40% Very High 218,754 21,875,400 2,1884.12%
 Risk Assessment (Sum of Land Area under each risk level) Risk Level Number of cellsArea (m2)Area (HA) % of Trinidad urban land mass Very Low 925,747 92,574,700 9, % Low 1,467, ,764,100 14, % Moderate 1,334, ,422,000 13, % High 1,402, ,291,200 14, % Very High 218,754 21,875,400 2, %")
64
Uses Development control and planning Disaster mitigation planning Disaster management Policy formulation Law reforms Site analysis Review of insurance premium

65
Users Physical Planning Offices Non-Governmental Organizations Environmental Agencies Works Departments Utility Companies Insurance Agencies National Disaster Offices Security and Protective Services Lending Agencies Meteorology and Hydrology Departments Educational Institutions Land Developers General Public Foreign Investors

66
Questions &Comments

Similar presentations


 Landslide Risk Reduction in Saint Lucia.>")


