Download presentation
Presentation is loading. Please wait.

1
Measuring Domestic Output and National Income
We will be calculating how economists estimate a country’s output and income for a year. The importance of these figures will be discussed, as well as the differences between the various ways that we can measure income. Lastly we will discuss how we can adjust the figures that we have calculated for inflation effects and analyze some of the issues associated with the various accounts. Copyright © 2012 by The McGraw-Hill Companies, Inc. All rights reserved. McGraw-Hill/Irwin

2
Assessing the Economy’s Performance
National Income Accounting measures economy’s overall performance Bureau of Economic Analysis compiles National Income and Product Accounts Assess health of economy Track long run course Formulate policy National income accounting does for the economy what private accounting would do for an individual household or business. The Bureau of Economic Analysis, an agency of the Department of Commerce, compiles the data and reports it in National Income and Product Accounts. This information is used by economists and policymakers in formulating decisions for the best interest of the nation. LO1 7-2

3
Gross Domestic Product
Measure of aggregate output Monetary measure Avoid multiple counting Market value final goods Ignore intermediate goods Count value added The primary measure of the economy’s performance as a whole is its aggregate output. This is most commonly calculated as Gross Domestic Product, or GDP. GDP is a monetary measure in that everything is valued in dollars. All goods and services produced must be converted into dollar values for GDP to work. To avoid multiple counting of goods, GDP includes only the market value of final goods and ignores intermediate goods, which are goods either purchased for resale or for further processing into final goods. GDP could also avoid multiple counting by counting only the value added at each stage. Value added is the market value of a firm’s output less the value of the inputs that the firm purchased from others. LO1 7-3

4
GDP is our basic measure of economic activity
Gross Domestic Product (GDP) GDP is the market value of new, final goods and services produced year within the nation’s borders in a given time period. GDP is our basic measure of economic activity
 GDP is the market value of new, final goods and services produced year within the nation’s borders in a given time period. GDP is our basic measure of economic activity.")
5
Final versus Intermediate Goods
A final good or service is produced for a final user and not as a component of a final good. Examples: Cars, pizzas, luggage An intermediate good or service is used as a component of a final good or service Examples: Radiator hoses, flour, plastics.

6
Gross Domestic Product
(1) Stage of Production (2) Sales Value Of Materials Or Product $ 0 Firm A, sheep ranch 120 Firm B, wool producer 180 Firm C, coat manufacturer 220 Firm D, clothing manufacturer 270 Firm E, retail clothier 350 Total Sales Value $1140 Value Added (total income) (3) Value Added ] $120 (= $120 - $ 0) ] (= ) ] (= ) ] (= ) ] (= – 270) $350 This table illustrates the value-added in a five-stage production process. The value added is calculated as the difference between the sales value of the materials and the value of the good at the previous production stage value. Using this method will avoid multiple counting. LO1 7-6
 Stage of Production. (2) Sales Value. Of Materials. Or Product. $ 0. Firm A, sheep ranch Firm B, wool producer Firm C, coat manufacturer Firm D, clothing manufacturer Firm E, retail clothier Total Sales Value. $1140. Value Added (total income) (3) Value. Added. ] $120 (= $120 - $ 0) ] (= ) ] (= ) ] (= ) ] (= 350 – 270) $350. This table illustrates the value-added in a five-stage production process. The value added is calculated as the difference between the sales value of the materials and the value of the good at the previous production stage value. Using this method will avoid multiple counting. LO")
7
Don't double count! To count the new coat in GDP, we count the final transaction only. Otherwise, we would be counting value added twice.

8
Gross Domestic Product
Exclude financial transactions Public transfer payments Private transfer payments Stock (and bond) market transactions Exclude second hand sales Sell used car to a friend Nonproduction transactions must be excluded from GDP since they have nothing to do with the production of final goods. There are two types: purely financial transactions and secondhand sales. Purely financial transactions include such items as public transfer payments like Social Security, private transfer payments (Christmas gifts), and stock market transactions. Secondhand sales contribute nothing to current production so they are ignored in calculating GDP. LO1 7-8
 market transactions. Exclude second hand sales. Sell used car to a friend. Nonproduction transactions must be excluded from GDP since they have nothing to do with the production of final goods. There are two types: purely financial transactions and secondhand sales. Purely financial transactions include such items as public transfer payments like Social Security, private transfer payments (Christmas gifts), and stock market transactions. Secondhand sales contribute nothing to current production so they are ignored in calculating GDP. LO")
9
Count income derived from production
Two Approaches to GDP Income approach Count income derived from production Wages, rental income, interest income, profit Expenditure approach Count sum of money spent buying the final goods Who buys the goods? GDP can be viewed from two different perspectives. The income approach looks at GDP in terms of the income derived, or created, from producing goods and services. The expenditures approach measures GDP as the sum of all of the money spent in buying the output. In theory, either method should yield equal results. The expenditures and income approaches are two different ways to look at the same thing. You could look at a quarter from the heads side or the tails side, but it is still worth the same amount. This is the same as the expenditures and income approaches for calculating GDP. LO2 7-9

10
Expenditures or Output Approach
Two Approaches to GDP Expenditures or Output Approach Income or Allocations Approach Consumption by Households Wages + + Rents Investment by Businesses + G D P + = = Interest + Government Purchases Here the two different approaches to measuring GDP are illustrated. On the left, the expenditures approach measures GDP as the sum of four items: (1) consumption by households, (2) investment by businesses, (3) government purchases, and (4) expenditures by foreigners. On the right, the income approach uses different inputs: (1) wages, (2) rents, (3) interest, (4) profits, and (5) statistical adjustments. Each of these items will be further discussed next. + Profits + Expenditures By Foreigners Statistical Adjustments LO2 7-10
 consumption by households, (2) investment by businesses, (3) government purchases, and (4) expenditures by foreigners. On the right, the income approach uses different inputs: (1) wages, (2) rents, (3) interest, (4) profits, and (5) statistical adjustments. Each of these items will be further discussed next. + Profits. + Expenditures. By Foreigners. Statistical. Adjustments. LO")
11
Expenditures Approach
Personal consumption expenditures (C) Durable consumer goods Nondurable consumer goods Consumer expenditures for services Domestic plus foreign goods produced Personal consumption expenditures, indicated by a “C” notation, covers all expenditures by households on goods and services during a year. In any given year, approximately 10% of those expenditures are for durable consumer goods, which are defined as having a life of three years or more. Another 30% go to nondurable goods such as food, clothing, and gasoline. The other 60% are for services leading to the U.S. economy, frequently being referred to as a service economy. LO2 7-11
 Durable consumer goods. Nondurable consumer goods. Consumer expenditures for services. Domestic plus foreign goods produced. Personal consumption expenditures, indicated by a C notation, covers all expenditures by households on goods and services during a year. In any given year, approximately 10% of those expenditures are for durable consumer goods, which are defined as having a life of three years or more. Another 30% go to nondurable goods such as food, clothing, and gasoline. The other 60% are for services leading to the U.S. economy, frequently being referred to as a service economy. LO")
12
Consumer Spending by Type, 2009 (in billions)
Total spending by U.S. households in 2009 was a $10.1 trillion Source: Bureau of Economic Analysis

13
Expenditures Approach
Gross private domestic investment (Ig) Machinery, equipment, and tools All construction Changes in inventories Creation of new capital assets Noninvestment transactions excluded The second component of the expenditures approach is gross private investment, which includes all final purchases of machinery, equipment, and tools by businesses, all construction, and changes in inventories. All of these items represent ways businesses invest in themselves. Construction also includes residential construction because homes could be rented to produce income. LO2 7-13
 Machinery, equipment, and tools. All construction. Changes in inventories. Creation of new capital assets. Noninvestment transactions excluded. The second component of the expenditures approach is gross private investment, which includes all final purchases of machinery, equipment, and tools by businesses, all construction, and changes in inventories. All of these items represent ways businesses invest in themselves. Construction also includes residential construction because homes could be rented to produce income. LO")
14
Expenditures Approach
Gross Investment - Depreciation = Net Investment Net Investment Gross Investment Depreciation Increase When gross investment exceeds depreciation during a year, net investment occurs. This net investment expands the stock of private capital from the beginning of the year to the end of the year, allowing the economy’s production capacity to expand, all other things equal. Consumption & Government Spending Stock of Capital Stock of Capital January 1 Year’s GDP December 31 LO2 7-14

15
Expenditures Approach
Government purchases (G) Expenditures for goods and services Expenditures for publicly owned capital Excludes transfer payments Net exports (Xn) Add exported goods Subtract imported goods Xn = exports – imports GDP = C + Ig + G + Xn The last two components of the expenditures approach are government purchases and net exports. Government purchases are officially labeled “government consumption expenditures and gross investment.” It includes expenditures for goods and services that the government uses in providing public services and expenditures for publicly owned capital such as for schools or roads. It excludes government transfer payments such as Social Security because it merely transfers government receipts to certain households and does not generate any sort of production. Net exports are calculated by subtracting the value of imported goods from the value of exported goods. Adding up all four components provides a measure of GDP, a measure of the market value of a specific year’s total output. For the United States in 2009, GDP equaled $14,256 billion. LO2 7-15
 Expenditures for goods and services. Expenditures for publicly owned capital. Excludes transfer payments. Net exports (Xn) Add exported goods. Subtract imported goods. Xn = exports – imports. GDP = C + Ig + G + Xn. The last two components of the expenditures approach are government purchases and net exports. Government purchases are officially labeled government consumption expenditures and gross investment. It includes expenditures for goods and services that the government uses in providing public services and expenditures for publicly owned capital such as for schools or roads. It excludes government transfer payments such as Social Security because it merely transfers government receipts to certain households and does not generate any sort of production. Net exports are calculated by subtracting the value of imported goods from the value of exported goods. Adding up all four components provides a measure of GDP, a measure of the market value of a specific year’s total output. For the United States in 2009, GDP equaled $14,256 billion. LO")
16
U.S. Economy 2009 In Billions Receipts Expenditures Approach
Allocations Income Approach Personal Consumption (C) Gross Private Domestic Investment (Ig) Government Purchases (G) Net Exports (Xn) Gross Domestic Product $10,089 1628 2931 -392 $ 14,256 Compensation Rents Interest Proprietor’s Income Corporate Profits Taxes on Production and Imports National Income Net Foreign Factor Income (-) Statistical Discrepancy (+) Consumption of Fixed Capital (+) Gross Domestic Product $ 268 788 1041 1309 1090 $12,288 105 209 1864 $ 14,256 This chart calculates GDP for 2009 in the United States by both the expenditures approach and the income approaches. Note that both methods come to the same conclusion for the year. LO2 7-16
 Gross Private Domestic Investment (Ig) Government Purchases (G) Net Exports (Xn) Gross Domestic Product. $10, $ 14,256. Compensation. Rents. Interest. Proprietor’s Income. Corporate Profits. Taxes on Production and Imports. National Income. Net Foreign Factor Income (-) Statistical Discrepancy (+) Consumption of Fixed Capital (+) Gross Domestic Product. $ $12, $ 14,256. This chart calculates GDP for 2009 in the United States by both the expenditures approach and the income approaches. Note that both methods come to the same conclusion for the year. LO")
17
Comparative GDP In this table comparing GDPs for selected nations, the United States, Japan, and China have the world’s highest GDP. Note that all data have been converted to U.S. dollars via international exchange rates. LO2 7-17

18
Compensation of employees Rents Interest Proprietor’s income
The Income Approach Compensation of employees Rents Interest Proprietor’s income Corporate profits Corporate income taxes Dividends Undistributed corporate profits Taxes on production and imports This approach allocates expenditures as income to those responsible for producing the output. The major component is national income, which is made up of employee compensation, rents, interest, proprietor’s income, corporate profits, and taxes on production and imports. The largest share is employee compensation which includes wages and salaries paid by both businesses and government as well as supplements such as benefits paid by employers on behalf of employees. LO2 7-18

19
From national income to GDP Subtract net foreign factor income
The Income Approach From national income to GDP Subtract net foreign factor income Statistical discrepancy Consumption of fixed capital Other national accounts Net domestic product (NDP) National income (NI) Personal income (PI) Disposable income (DI) Under the income approach, all expenditures on final goods and services flow as income to either private citizens or the government. To move from national income to GDP, several adjustments must be made. The first adjustment is for net foreign factor income. This is income Americans gain from supplying resources abroad, which would be taken out, and then income that foreigners gain from supplying resources to the U.S. would be added. The next adjustment comes from what is called a statistical discrepancy, which basically is just a balancing amount. The final adjustment factor is the useful life of private capital equipment that extends well beyond the year in which they were produced. The cost of the equipment must be allocated over its useful life. The other national accounts provide useful information about the economy’s performance. NDP is GDP less consumption of fixed capital. National income is NDP less the statistical discrepancy and plus the net foreign factor income. Personal income includes all income received, regardless of whether it is earned or unearned. Finally, disposable income is PI less personal taxes. LO2 7-19
 National income (NI) Personal income (PI) Disposable income (DI) Under the income approach, all expenditures on final goods and services flow as income to either private citizens or the government. To move from national income to GDP, several adjustments must be made. The first adjustment is for net foreign factor income. This is income Americans gain from supplying resources abroad, which would be taken out, and then income that foreigners gain from supplying resources to the U.S. would be added. The next adjustment comes from what is called a statistical discrepancy, which basically is just a balancing amount. The final adjustment factor is the useful life of private capital equipment that extends well beyond the year in which they were produced. The cost of the equipment must be allocated over its useful life. The other national accounts provide useful information about the economy’s performance. NDP is GDP less consumption of fixed capital. National income is NDP less the statistical discrepancy and plus the net foreign factor income. Personal income includes all income received, regardless of whether it is earned or unearned. Finally, disposable income is PI less personal taxes. LO")
20
U.S. Income Relationships 2009
Gross Domestic Product (GDP) Less: Consumption of Fixed Capital Equals: Net Domestic Product (NDP) Less: Statistical Discrepancy Plus: Net Foreign Factor Income Equals: National Income (NI) Less: Taxes on Production and Imports Less: Social Security Contributions Less: Corporate Income Taxes Less: Undistributed Corporate Profits Plus: Transfer Payments Equals: Personal Income (PI) Less: Personal Taxes Equals: Disposable Income (DI) $ 14,256 1864 $ 12,392 209 105 $ 12,288 1090 967 315 418 2528 $ 12,026 1102 $ 10,924 This table illustrates the relationship between GDP, NDP, NI, PI, and DI in the United States for 2009. LO2 7-20
 Less: Consumption of Fixed Capital. Equals: Net Domestic Product (NDP) Less: Statistical Discrepancy. Plus: Net Foreign Factor Income. Equals: National Income (NI) Less: Taxes on Production and Imports. Less: Social Security Contributions. Less: Corporate Income Taxes. Less: Undistributed Corporate Profits. Plus: Transfer Payments. Equals: Personal Income (PI) Less: Personal Taxes. Equals: Disposable Income (DI) $ 14, $ 12, $ 12, $ 12, $ 10,924. This table illustrates the relationship between GDP, NDP, NI, PI, and DI in the United States for LO")
21
Circular Flow Revisited
Here is the updated circular flow that was introduced in a much simpler form in a previous chapter. However, from this diagram, we can see that even when we account for more transactions in the economy, income and expenditures are equal. LO2 7-21

22
GDP is a dollar measure of production
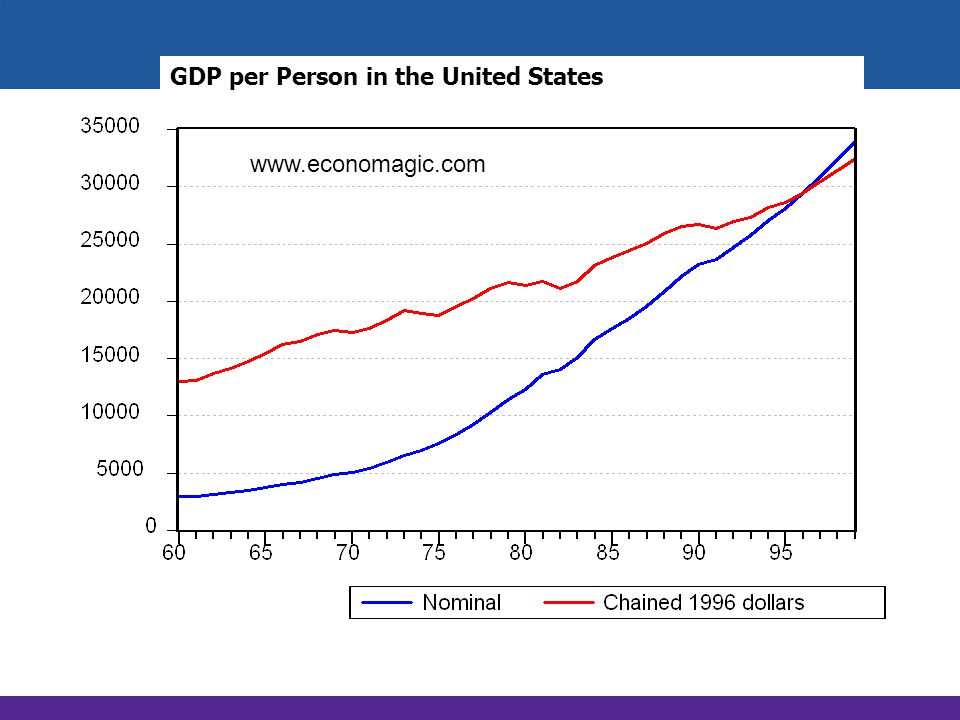
Nominal vs. Real GDP GDP is a dollar measure of production Using dollar values creates problems Nominal GDP Use prevailing price Real GDP Reflect changes in price Use base year price GDP measures production at current dollar values which creates problems because the value of a dollar changes over time. One hundred years ago, the purchasing power of one dollar was much different than it is today. To get around that problem, there are two different GDPs. Nominal GDP is based upon the prices that were in effect when the output was produced. A GDP that has been deflated or inflated to reflect changes in price levels is referred to as real GDP. In order to calculate real GDP, a base year must be selected and then the current year’s prices adjusted accordingly. LO3 7-22

23
Use price index to determine real GDP
GDP Price Index Use price index to determine real GDP Price Index In Given Year = x 100 Price of Market Basket In Specific Year Price of Same Basket In Base Year This is the formula used to calculate real GDP. We use a price index that is equal to the price of a collection of goods and services in the specific year divided by the price for the same goods and services in a base year multiplied by Nominal GDP is then divided by the price index (in hundredths) to determine real GDP. Real GDP = Nominal GDP Price Index (in hundredths) LO3 7-23
 to determine real GDP. Real. GDP. = Nominal GDP. Price Index (in hundredths) LO")
24
(4) Unadjusted, or Nominal, GDP
GDP Price Index Calculating Real GDP (Base Year = Yr 1) Year (1) Units of Output (2) Price of Pizza Per Unit (3) Price Index (Year 1 = 100) (4) Unadjusted, or Nominal, GDP (1) X (2) (5) Adjusted, or Real, GDP 1 5 $10 100 $ 50 $50 2 7 20 200 140 70 3 8 25 250 80 4 10 30 --- 11 28 In this table, nominal GDP and real GDP are calculated based upon the formula. Years 1 to 3 have been calculated. Complete the table for years 4 and 5. LO3 7-24
 Year. (1) Units of. Output. (2) Price of. Pizza. Per Unit. (3) Price Index. (Year 1 = 100) (4) Unadjusted, or Nominal, GDP. (1) X (2) (5) Adjusted, or. Real, GDP $ $ 50. $ In this table, nominal GDP and real GDP are calculated based upon the formula. Years 1 to 3 have been calculated. Complete the table for years 4 and 5. LO")
25
GDP per Person in the United States
27
The residential construction industry is in a major slump.
2005 = 100

28
Net Exports (NX) of the U.S. (Monthly)
 of the U.S. (Monthly)")
30
Improved product quality The underground economy
Shortcomings of GDP Nonmarket activities Leisure Improved product quality The underground economy GDP and the environment Composition and distribution of the output Noneconomic sources of well-being While GDP is a reasonably accurate and highly useful measure of how the economy is performing, it does have several shortcomings. Certain productive activities occur outside of any market and therefore are not measured in the traditional way. The value of leisure time, weekends, holidays, etc., is also not included, but they certainly add value due to the added satisfaction they provide to workers. GDP fails to capture the full value of improvements in product quality. Let’s face it, a 42 inch plasma screen flat panel television is a vast improvement over the old black and white vacuum tube models. There is also a huge underground economy, mainly comprised of illegal activities, that produces income that is not measured through traditional GDP methods. Included in this underground economy are legal activities that provide income that the recipients do not wish to report to the I.R.S. and pay taxes on. Environmental issues and noneconomic sources of well-being are also problematic in that GDP does not really have a way to accurately value and report the issues. LO4 7-30

31
Underground Economy This table shows the underground economy as a percentage of GDP in several nations. Three factors that help explain the variation in size are (1) the extent and complexity of regulation, (2) the type and degree of taxation, and (3) the effectiveness of law enforcement in the subject nation. LO4 7-31
 the extent and complexity of regulation, (2) the type and degree of taxation, and (3) the effectiveness of law enforcement in the subject nation. LO")
32
Census Bureau’s Retail Trade Survey
Sources of BEA Data Consumption Census Bureau’s Retail Trade Survey Census Bureau’s Survey of Manufacturers Census Bureau’s Service Survey Industry Trade Sources The Bureau of Economic Analysis, an agency of the Department of Commerce, is responsible for compiling the NIPA tables. The BEA gets its data from a variety of sources. The consumption data comes from four primary sources, three of which are provided by the Census Bureau. The Retail Trade Survey gathers sales data from a sample of 22,000 firms, the Survey of Manufacturers collects information on shipments of consumer goods from 50,000 establishments, and the Service Survey collects sales data from 30,000 service businesses. The BEA also collects information from a variety of industry trade sources. LO4 7-32

33
All consumption data sources
Sources of BEA Data Investment All consumption data sources Census Bureau’s Housing Starts Survey and Housing Sales Survey Retail Trade Survey Wholesale Trade Survey Survey of Manufacturing For investment data, the BEA looks at the consumption sources as well as the Housing Starts Survey and Housing Sales Survey produced by the Census Bureau. LO4 7-33

34
Office of Personnel Management Construction Surveys
Sources of BEA Data Government Purchases Office of Personnel Management Construction Surveys Census Bureau’s Survey of Government Finance Net Exports U.S. Customs Service BEA Surveys and Analysis The data for government purchases comes from the Office of Personnel Management, OPM, which collects data on wages and benefits of both public and private sectors, and the Construction Survey and the Census Bureau’s Survey of Government Finance, which provide data on government consumption and investment expenditures. The Net Exports data comes from U.S. Customs Service reports and the BEA surveys of domestic exporters and importers of services. LO4 7-34

Similar presentations


>")


 Outline: 1.Functions of NIA 2.Gross Domestic Product (GDP) 3.The Value Added approach to GDP 4.The Expenditure Approach.>")

 3.The Expenditure Approach to GDP 4.The.>")


