Download presentation
Presentation is loading. Please wait.

1
SAMPLE SIZE ESTIMATION
DR. SHRIRAM V. GOSAVI MODERATED BY: BHARAMBE SIR

2
FRAMEWORK What is sample size? & Why it required?
Practical issues in determining sample sizes Determining sample size Sample size calculation by different ways Sample size estimation for descriptive studies Sample size estimation for hypothesis testing Summary References

3
WHAT IS SAMPLE SIZE? & WHY IT REQUIRED?
Sample size means “n” After planning for any research it is important to know that how many subjects should be included in their study i.e. sample size & how these subjects should be selected (sampling methods). If a study does not have an optimum sample size, the significance of the results in reality (true differences) may not be detected. This implies that the study would lack power to detect the significance of differences because of inadequate sample size.
. If a study does not have an optimum sample size, the significance of the results in reality (true differences) may not be detected. This implies that the study would lack power to detect the significance of differences because of inadequate sample size.")
5
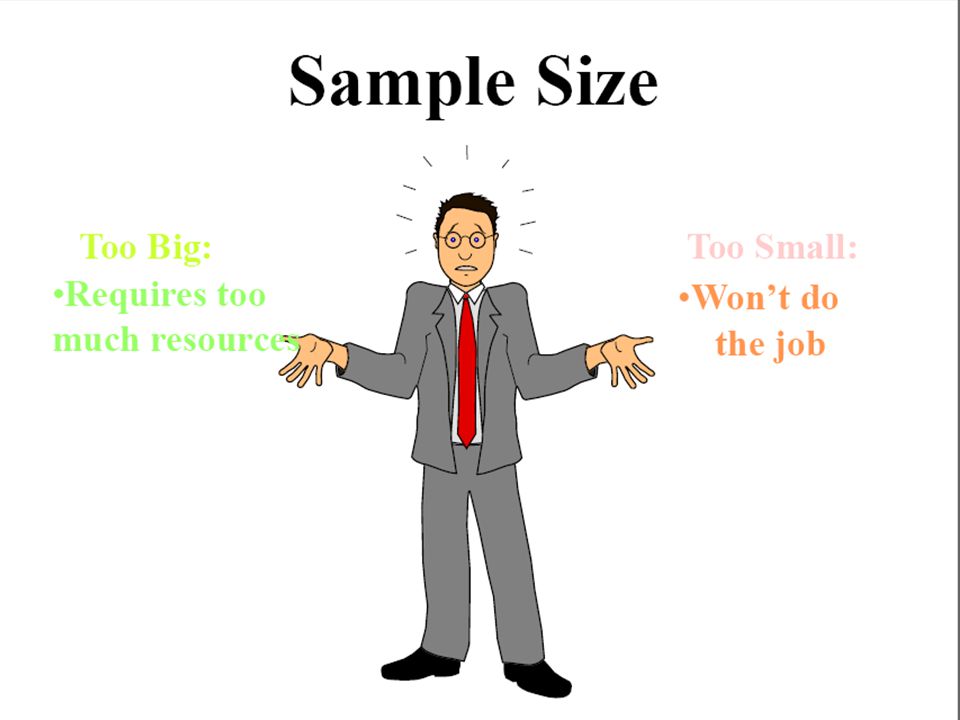
How Big a Sample Do You Need?
Small sample size (less than the optimum sample size) – May fail to detect a clinically important difference, – or may estimate those effects or associations too imprecisely, – Even the most rigorously executed study may fail to answer its research question Very large sample size (more than the optimum size): – Involve extra patients – Costs more – Difficult to maintain high data quality NOT VERY SMALL AND NOT VERY LARGE
 – May fail to detect a clinically important difference, – or may estimate those effects or associations too imprecisely, – Even the most rigorously executed study may fail to answer its research question. Very large sample size (more than the optimum size): – Involve extra patients. – Costs more. – Difficult to maintain high data quality. NOT VERY SMALL AND NOT VERY LARGE.")
6
Practical issues in Determining Sample Sizes
Importance of the Research Issue: If the results of the survey research are very critical, then the sample size should be increased. As sample size increases, the width of the confidence interval decreases. Heterogeneity of the population: If there is likely to be wide variations in the results obtained from various respondents, the sample size should be increased

7
Practical issues in Determining Sample Sizes
Funding: quite often, budgetary constraints limit the sample size for the study Number of sub-groups to analyze: If multiple sub-groups in a population are going to be analyzed, the sample size should be increased to ensure that adequate numbers are obtained for each sub-group

8
Determining sample size
The things you need to know: Random Error: Systematic Error: Validity & Precision: Null Hypothesis: Alternate Hypothesis: Hypothesis Testing: Type I & II Error: Power: Effect Size: Design Effect:

9
Random error It describes the role of chance,
Sources of random error include: - sampling variability, - subject to subject differences & - measurement errors. It can be controlled and reduced to acceptably low levels by: - Averaging, - Increasing the sample size & - Repeating the experiment

10
Systematic error (Bias)
It describes deviations that are not a consequence of chance alone. Several factors, including: - Patient selection criteria, might contribute to it. These factors may not be amenable to measurement, Removed or reduced by good design and conduct of the experiment. A strong bias can yield an estimate very far from the true value.

11
Validity and Precision (1)
Fundamental concern: avoidance and/or control of error Error = difference between true values and study results Accuracy = lack of error Validity = lack or control of systematic error Precision = lack of random error

12
Validity and Precision (2)
results validity actual estimator target estimator Precision Precision

13
Any possibility of errors?
Since our decision is based on the sample we chose from the population, there is a possibility that we make a wrong decision A type I error occurs when Null hypothesis is rejected when it is in fact true A type II error occurs when Null hypothesis is not rejected when it is false

14
Summary of possible results of any hypothesis test
Researcher’s Decision Reality of hypothesis Accepted Rejected True Correct Power = (1-Beta) Type I error (or) alpha error False Type II error (or) beta error
 Type I error (or) alpha error. False. Type II error (or) beta error.")
15
Type I error / α error The probability of making a error is called as level of significance i.e. consider as 0.05 (5%). For computing the sample size its specification in terms of Zα is required. The quantity Zα is a value from the standard normal distribution corresponding to α Sample size is inversely proportional to type I error.

16
Type II error / β error For computing the sample size its specification in terms of Zb is required. The quantity Zb is a value from the standard normal distribution corresponding to β A type II error is frequently due to small sample sizes The exact probability of a type II error is generally unknown

17
Power of the study: Probability that the test will correctly identify a significant difference or effect or association in sample should one exist in the population 1- β corresponds to sensitivity of a diagnostic test, i.e. probability of making a positive diagnosis when disease is present Thus, sample size directly related to the power of study. A well designed trial should have a power of at least 0.8

18
Effect size It should represent smallest difference that would be of clinical or biological significance. If the effect size is increased, the type II error decreases A large sample size is needed for detection of a minute difference. Thus, the sample size is inversely related to the effect size.

19
Variability of the measurement:
The variability of measurements is reflected by the standard deviation or the variance. The higher the standard deviation, larger sample size is required. Thus, sample size is directly related to the SD

20
Types of Problems in Medical Research
Estimation: (Prevalence/Descriptive Study) - Given proportion of prevalence - Given mean & standard deviation Testing hypothesis: (Cohort/Case Control/Clinical Trial) - Given two proportion or incidence rates - Given two group means and standard deviations
 - Given proportion of prevalence - Given mean & standard deviation Testing hypothesis: (Cohort/Case Control/Clinical Trial) - Given two proportion or incidence rates - Given two group means and standard deviations")
21
SAMPLE SIZE CALCULATION BY DIFFERENT WAYS
By use of Formulae Computer Soft wares Readymade tables, Nomograms

22
Formulae & Problems

23
Sample size Quantitative Qualitative

24
Descriptive study When proportion is the parameter of our study n = Z2α * p * q/d2 where z = standardized normal deviate (Z value) p = Proportion or prevalence of interest (from pilot study or literature survey) expressed in percentage form q = 100-p d = clinically expected variation (precision)
 p = Proportion or prevalence of interest (from pilot study or literature survey) expressed in percentage form q = 100-p d = clinically expected variation (precision)")
25
Example From a pilot study it was reported that among headache patients 28% had vascular headache. It was decided to have 95% CI and 10% variability in the estimated 28%. How many patients are necessary to conduct the study.

26
ANSWER p = 28%, q = 72% Z α = 1.96 for α at 0.05 d = 10% of 28% = 2.8

27
B. When mean is the parameter of our study
n = Z2α* S2/d2 Where Z = Standardized Normal Deviate (Z value) S = Sample standard deviation d = Clinically expected variation
 S = Sample standard deviation d = Clinically expected variation")
28
Example In a Health survey of school children it is found that the mean hemoglobin level of 55 boys is 10.2/100 ml with a standard deviation of 2.1 & Clinically meaningful difference is 0.8 Mean = 10.2 Standard Deviation = 2.1 Z α = 1.96 for α at 0.05 d = 0.8 n = (1.96)2 * 2.12/(0.8)2 = 26
2 * 2.12/(0.8)2 = 26")
29
Testing Hypothesis Formulae & Problems

30
When mean is the parameter of our study
n = (Zα + Zβ)2 *S 2 * 2/d2 Where Zα = Z value for α error Zβ = Z value for β error S = Common standard deviation between two groups d = Clinically meaningful difference
2 *S 2 * 2/d2 Where Zα = Z value for α error Zβ = Z value for β error S = Common standard deviation between two groups d = Clinically meaningful difference")
31
Example: Quantitative
An investigator compares the change in blood pressure due to placebo with that due to a drug. If the investigator is looking for a difference between groups of 5 mmHg, then with a between – subject, SD as 10 mmHg, how many patients should he recruit?

32
ANSWER n = (Zα + Zβ)2 *S 2 * 2/d2 Zα = 1.96 at α = 5% Zβ = 1.28 at β = 10% S = 10 d = 5 Hence, n = 85
2 *S 2 * 2/d2 Zα = 1.96 at α = 5% Zβ = 1.28 at β = 10% S = 10 d = 5 Hence, n = 85")
33
When Proportion is the parameter of our study
Formula: n = Z2α[P1(1-P1) + P2(1-P2)]/d2, where, n = sample size Z2α = confidence interval P1 = estimated proportion (larger) P2 = estimated proportion (smaller) d = Clinically meaningful difference
 + P2(1-P2)]/d2, where, n = sample size. Z2α = confidence interval. P1 = estimated proportion (larger) P2 = estimated proportion (smaller) d = Clinically meaningful difference.")
34
EXAMPLE What sample size to be selected from each of two groups of people to estimate a risk difference to be within 3 percentage points of true difference at 95% confidence when anticipated P1 & P2 are 40% & 32% respectively.

35
ANSWER Available information: zα = 1.96 P1 = .40 P2 = .32 d = 0.03

36
SUMMARY: Steps in Estimating Sample Size
1. Identify the major study variables. 2. Determine the types of estimates of study variables, such as means or proportions. 3. Select the population or subgroups of interest (based on study objectives and design). 4a. Indicate what you expect the population value to be. 4b. Estimate the standard deviation of the estimate.
. 4a. Indicate what you expect the population value to be. 4b. Estimate the standard deviation of the estimate.")
37
SUMMARY: Steps in Estimating Sample Size
5. Decide on a desired level of confidence in the estimate (confidence interval). 6. Decide on a tolerable range of error in the estimate (desired precision). 7. Compute sample size, based on study assumptions.
. 6. Decide on a tolerable range of error in the estimate (desired precision). 7. Compute sample size, based on study assumptions.")
38
COMPUTER SOFTWARE USED IN ESTIMATION OF SAMPLE SIZE

39
REFERNCES Lwanga SK, Lemeshow S. Sample size determination in health studies - A practical manual. 1st ed. Geneva: World Health Organization; 1991. Zodpey SP, Ughade SN. Workshop manual: Workshop on Sample Size Considerations in Medical Research. Nagpur: MCIAPSM; 1999 Rao Vishweswara K. Biostatistics A manual of statistical methods for use in health , nutrition and anthropology. 2nd edition. New Delhi: Jaypee brothers;2007 VK Chadha . Sample size determination in health studies. NTI Bulletin 2006,42/3&4,

Similar presentations