Download presentation
Presentation is loading. Please wait.

1
ENERGY, CARBON, AND THE SECONDARY MARKET FOR CONSUMER GOODS Dr. Ron Lembke

2
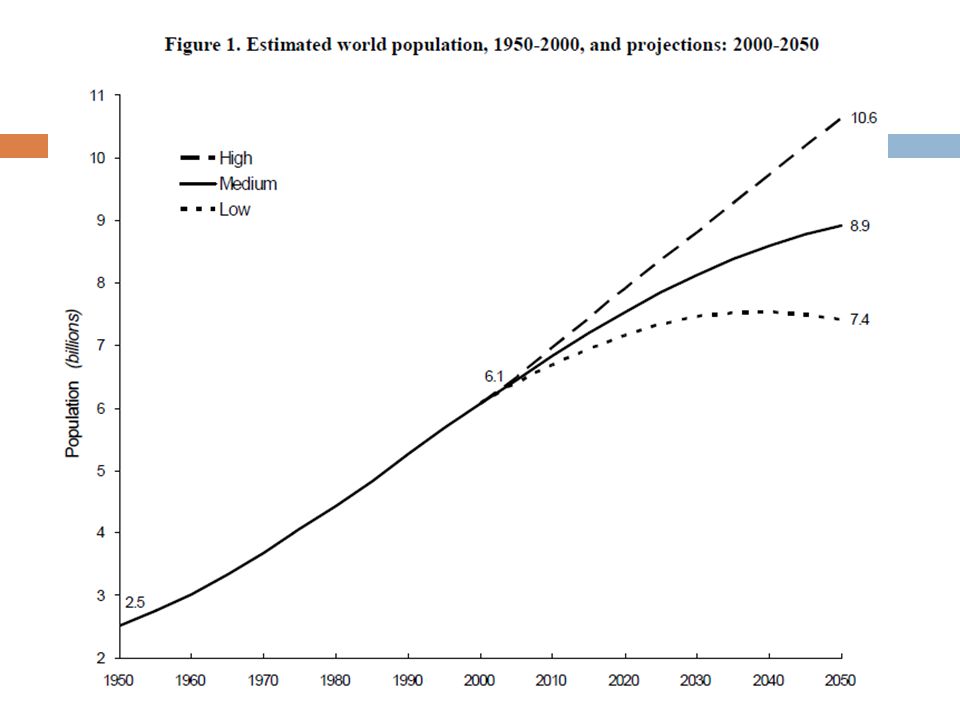
Hot, Flat, and Crowded Hot: Climate Change Flat: Technology and Bandwidth Crowded: More people, who want to live like us

3
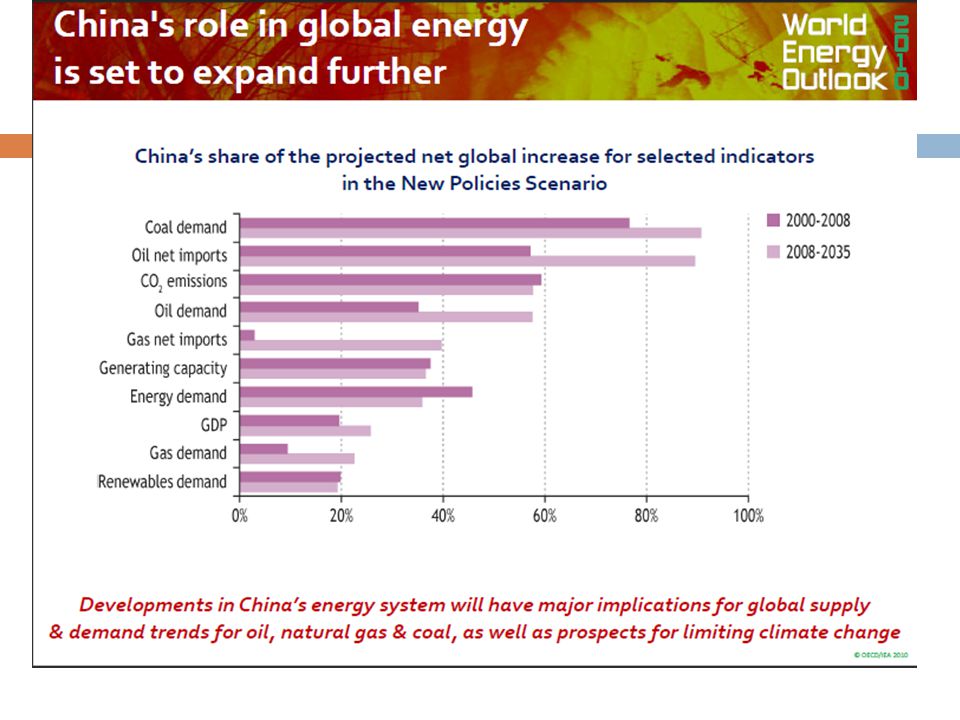
T HE DEMAND FOR ENERGY

5
International Energy Outlook, 2011, US Energy Information Admistration, eia.gov

7
T HE SUPPLY OF ENERGY

8
Hubbert’s Peak M. King Hubbert, “Nuclear Energy and the Fossil Fuels” (Drilling and Production Practices, American Petroleum Institute, Washington, DC, 1956),
,.")
11
Causality or Correlation?

12
Where does our oil come from?

13
US Oil Imports, US EIA

14
When is the Peak? 2004 data

16
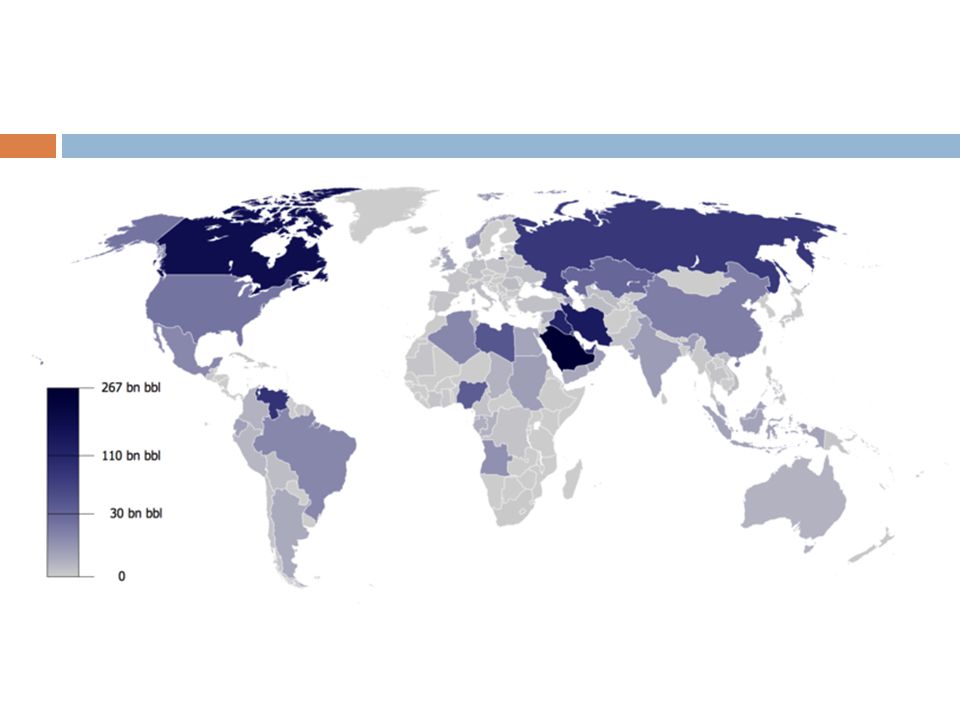
Amount of Recoverable Oil, 2004 S

19
Proven Oil Reserves, CIA Factbook

21
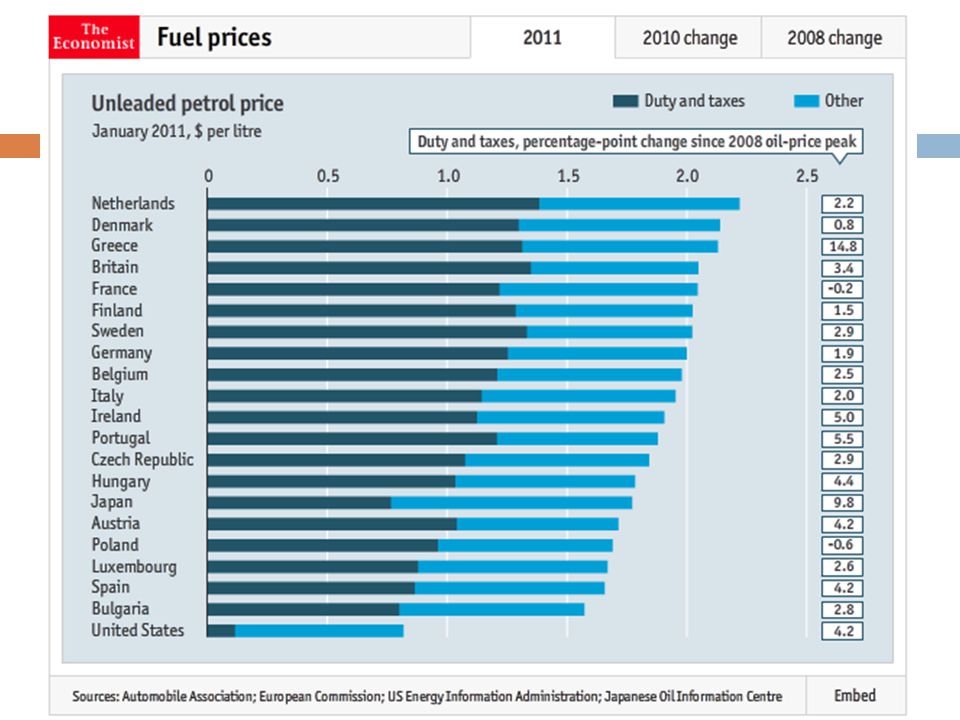
The Price of energy

22
Price of Liquids

24
EIA Predicted Price of Crude Oil, 2011

25
NV Electricity Prices Elect. Price Data: EIA, 20y Rsq=0.91, 10y Rsq=0.94

26
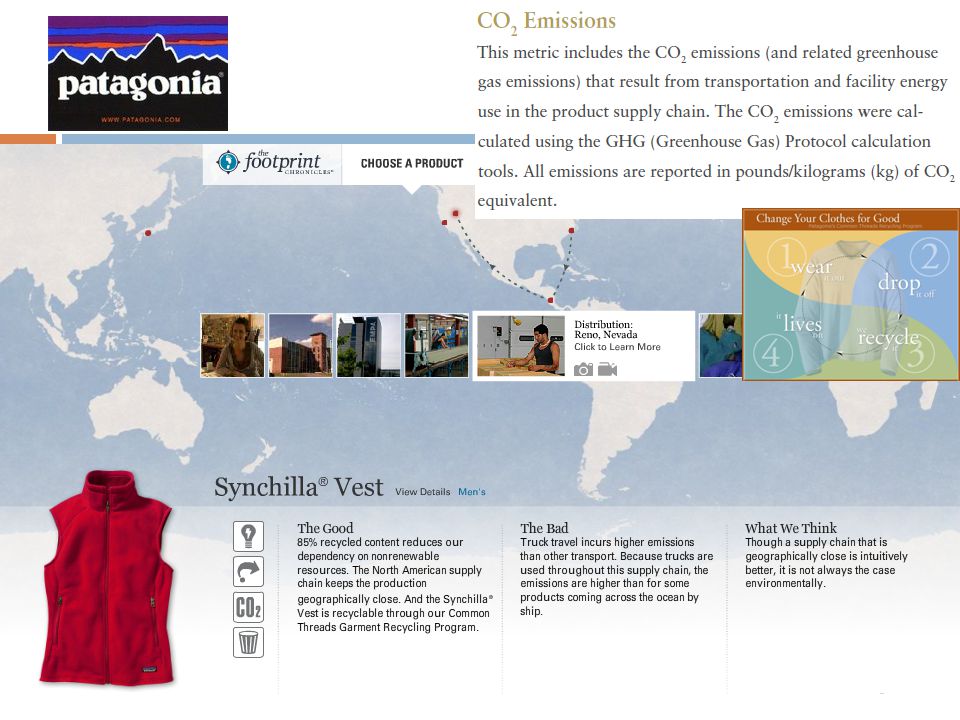
Carbon Footprints

27
Carbon Footprint Visibility Wal-Mart Sustainability initiative Carbon Trust Labeled £2 billion last year Patagonia Footprint chronicles

29
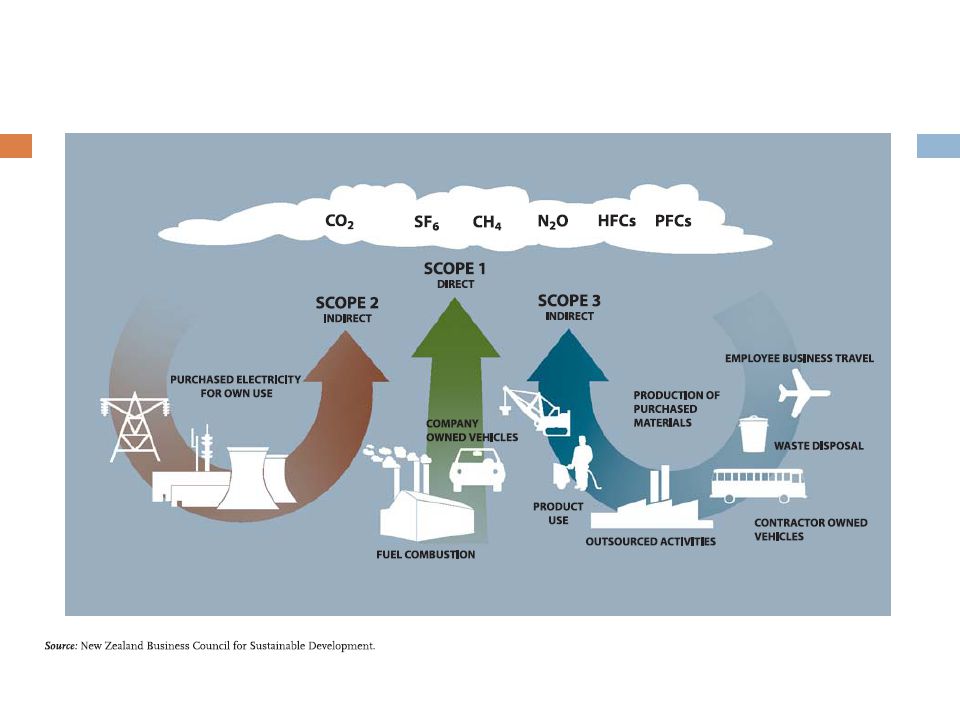
Direct vs. indirect GHG emissions? Direct: sources that are owned or controlled Indirect: result of activities, but at sources owned or controlled by another entity. Scope: 1. Direct GHG emissions 2. GHG from purchased electricity, heat, or steam 3. Extraction and production of purchased materials and fuels, transport-related activities in vehicles not owned or controlled by the reporting entity, electricity-related activities (e.g. T&D losses) not covered in Scope 2, outsourced activities, waste disposal, etc.
 not covered in Scope 2, outsourced activities, waste disposal, etc..")
31
GHG Footprint of Retailer

32
Corporate Perspective Supplier Retailer

33
Lifecycle Analysis SupplierRetailerConsumer End Of Life

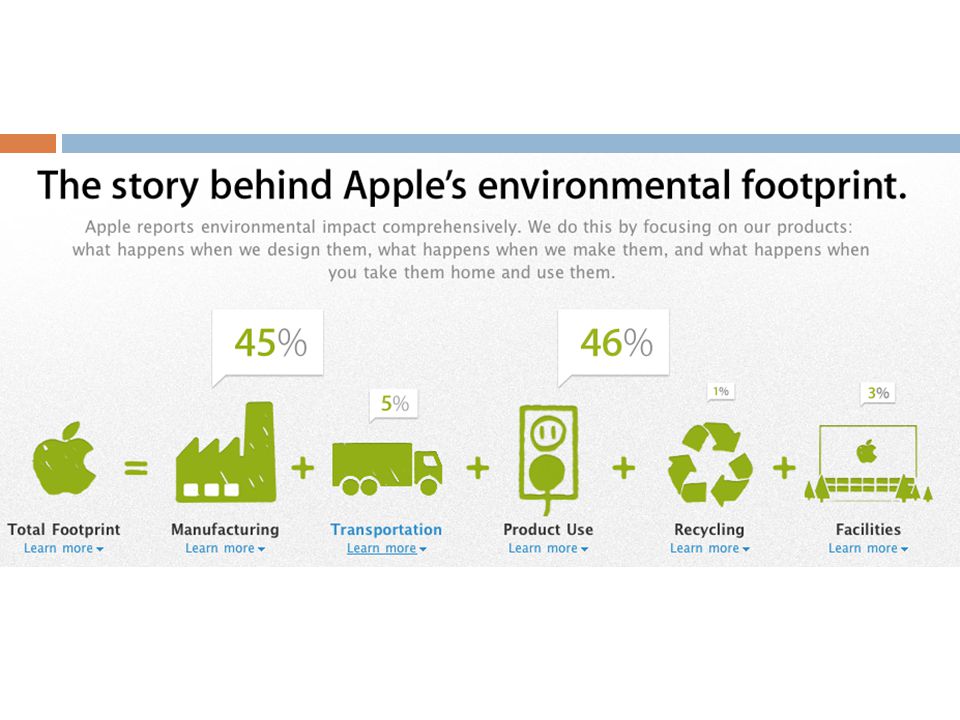
35
Apple Carbon Footprint

36
Carbon Disclosure Project

37
Wal-Mart Sustainability Index: more transparent supply chain, drive product innovation, info to customers “And increasingly [customers] want information about the entire lifecycle of a product so that they can feel good about buying it.” Mike Duke 1. Supplier Sustainability Assessment Energy & climate, material efficiency, natural resources, people & community 2. Sustainability Index Consortium Lifecycle Analysis Database, develop an open index ASU, U of Ark, database of info on products’ lifecycles 3. Simple, convenient, easy to understand presentation of the info to customers: TBD
![Wal-Mart Sustainability Index: more transparent supply chain, drive product innovation, info to customers And increasingly [customers] want information about the entire lifecycle of a product so that they can feel good about buying it. Mike Duke 1.](http://images.slideplayer.com/15/4837190/slides/slide_37.jpg "Supplier Sustainability Assessment Energy & climate, material efficiency, natural resources, people & community 2. Sustainability Index Consortium Lifecycle Analysis Database, develop an open index ASU, U of Ark, database of info on products’ lifecycles 3. Simple, convenient, easy to understand presentation of the info to customers: TBD.")
38
Wal-Mart “These are not complicated questions, but we have never systematically asked for this kind of information before ” Mike Duke

39
GHG: Do you measure? Report to the Carbon Disclosure Project (CDP)? Annual GHG? Public Targets? If so, what? Solid Waste: from the facilities for WM? Public Targets? If so, what? Water: total use from facilities for WM? Public Targets? If so, what? Public sustainability purchasing guidelines for direct suppliers environmental compliance, employment practices and product/ingredient safety? Have you obtained 3rd party certifications for products to WM? Do you know location of 100 % of facilities that produce your product(s)? Do you evaluate quality capacity for, production before signing a supplier? Do you have a process for managing social compliance at the mfg. level? Do you work with suppliers to resolve issues on social compliance evaluations and document specific corrections and improvements? Do you invest in community development activities in the markets you source from and/or operate within?
. Do you evaluate quality capacity for, production before signing a supplier. Do you have a process for managing social compliance at the mfg. level. Do you work with suppliers to resolve issues on social compliance evaluations and document specific corrections and improvements. Do you invest in community development activities in the markets you source from and/or operate within .")
40
Carbon Trust Measuring and Reducing GHG

41
CF per Unit ++ =

42
Embodied Carbon SupplierRetailer

43
Embodied Carbon Consideration Total amount of GHG expended thus far in the life cycle. Treat it like gold 6,000 kg of CO2 = 1 TL of product, 10,000 units CF = 6,000 kg/ 10,000 units = 600 g/unit Suppose you throw away half the product What is your footprint? 6,000 kg / 5,000 units = 1,200 g/unit

44
RL impact on CF 100 units 6 kg GHG Reverse Logistics reduces CF by 5%. 99 units 6 kg GHG = 63.83 g / unit 94 units 6 kg GHG = 60.61 g / unit = 60.00 g / unit Theoretical (Naïve - no returns) 6% returns, all landfilled 6% returns, 5 units re-sold 6.4% higher
 6% returns, all landfilled 6% returns, 5 units re-sold 6.4% higher.")
45
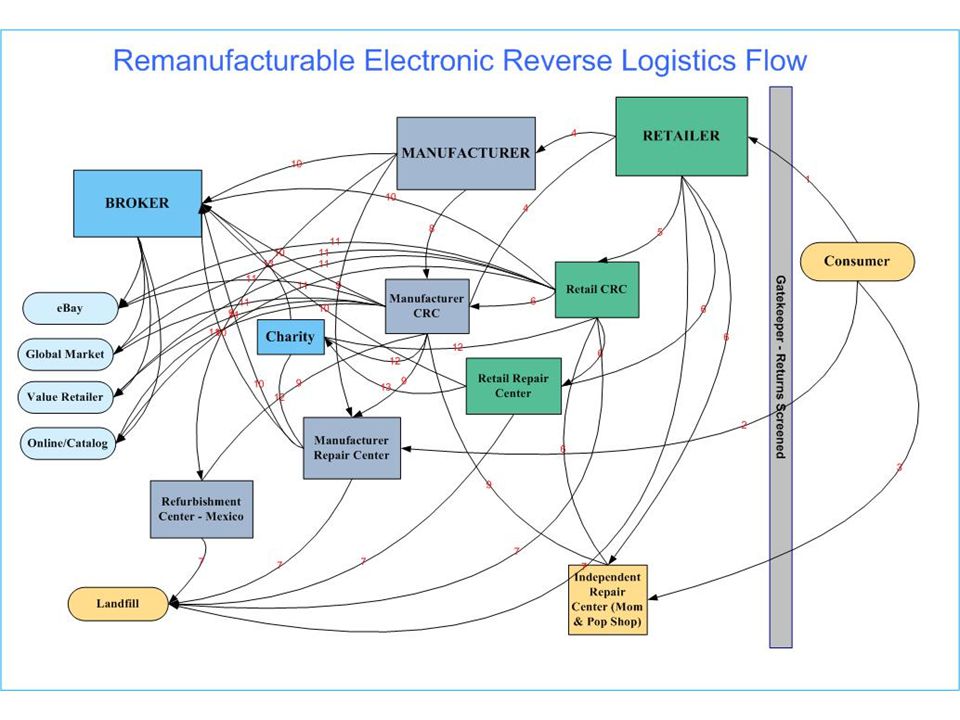
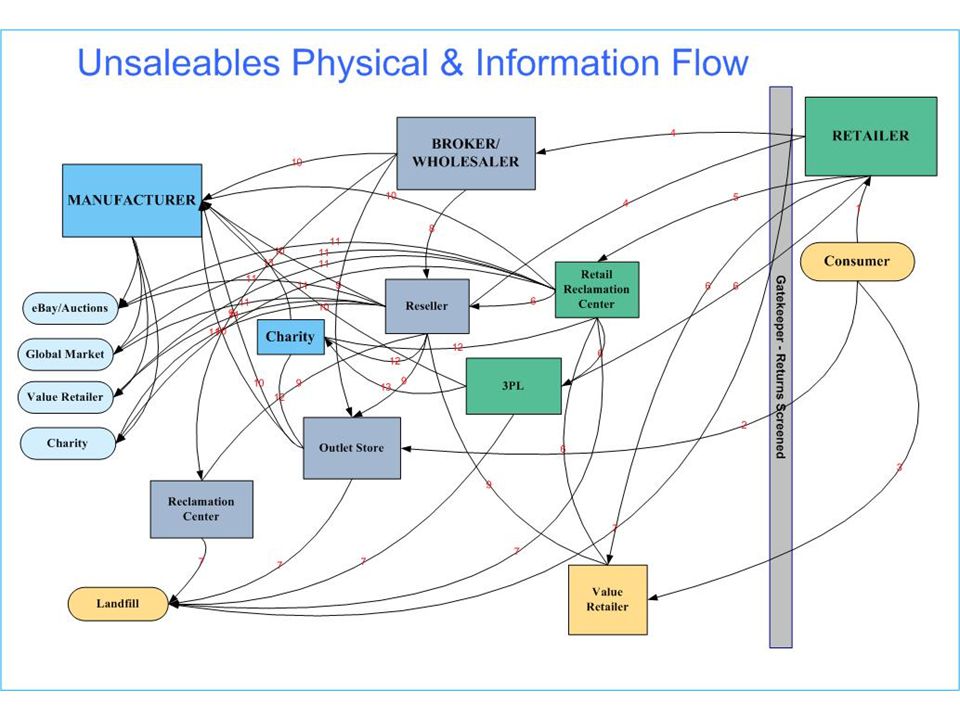
Where does all of the stuff go that they can’t sell anymore? Secondary Markets for Consumer Goods

46
Secondary Market Retailer’s Disposition Options Sell as New Open Box Outlet Return to Vendor Cannibalize Parts Salvage dealers Recycle/Landfill Customer Returns Unsold product Marketing Returns

47
Secondary market Companies recover, refurbish, remanufacture, and recycle product for additional use elsewhere. System “drains” excess inventory or assets can be recovered and resold. Several of the largest US export commodities are through the secondary market. Environmental Benefit - reduces waste stable income for a growing sector of the US economy. positively impacts environmental initiatives, social benefits to constituents, and produces healthy margins.

48
Measuring Economic Activity GDP Calculation avoids double-counting GDP = C + I + (X – M) + G Other measurements different approach: e.g. trucking, online, marketplaces, etc.

49
Secondary Market Includes Elements not Found in GDP We want to understand the total dollars flowing through the secondary market

52
Returns to Secondary Market Flow

53
Methodology Delphi Panel Methodology Lack of data, inability to measure directly Panel 4 mass merchandisers (RL and returns) 4 3PLs specializing in RL 5 RL managers at CE firms 2 contract manufacturers 3 industry association executive directors
 4 3PLs specializing in RL 5 RL managers at CE firms 2 contract manufacturers 3 industry association executive directors")
54
Auctions eBay, amazon, nobetterdeal, alibris eBay goods sold 2008 $59.7b Not including autos Market share estimated at 60% Total market $99.4b

55
Pawn Shops 3 Largest Publicly Traded: EZ Pawn Cash America International First Cash Financial Services 10% of total market Combined CoGS * 10: $5,655 m

56
Dollar Stores Dollar Tree (40% of US stores) Dollar General Family Dollar 80% of goods estimated to be from asset recovery process $17,669 m underestimate
 Dollar General Family Dollar 80% of goods estimated to be from asset recovery process $17,669 m underestimate")
57
CharitiesFlea Markets Salvation Army Goodwill Industries $2.7b combined revenues Clear underestimate $30 billion estimate, 2006 10-15% increase since then $33 billion

58
Value Retailers Often returned to retail, or bought on secondary market 1-2 seasons behind current retail Big Lots, TJ Maxx, Marshall’s, Ross Combined revenues $30,013 m clear underestimate

59
Factory Outlets Factory Outlet Stores: Goal often 70% of retail price 80% of goods non-secondary market Factory Outlet Sales 58,579,379 SF 95% typical occupancy rate $301 revenue/SF $13,400 m

60
Salvage Dealers-2007 Econ Census Avg Cust Returns % % to Secondar y Mkt $m of Cust Returns to Secondary Mkt Marketin g Returns $m Mktg Returns to Secondary Mkt Computers & Consumer Electronics 87,6646%75% 3,9457% 6,136 Clothing Stores 157,71510%75% 11,8297% 11,040 Department Stores 210,1426%75% 9,4567% 14,710 General Merchandise 367,8656%75% 16,5547% 25,751 Electronic Shipping & Mail Order 215,9638%75% 12,9587% 15,117 Total 1,039,349 54,742 72,754

61
Salvage Dealer Market Flow

62
Size of Secondary Market SectorSize Auctions 99,416 Outlets 14,105 Dollar Stores 17,669 Flea Markets 33,000 Pawn Shops 565 Charity 2,691 Value Retailers 30,031 Retail Salvage Goods 127,496 Total Size of Secondary Market 324,973 2008 US GDP 14,440,000 Secondary Market as % US GDP: 2.25%

Similar presentations


 Association Winter Conference Orlando, FL Sustainability for Small Business.>")


+61 (0)2 6252 5758.>")
