Download presentation
Presentation is loading. Please wait.

1
Plotting the path from RNA to microarray: the importance of experimental planning and methods Glenn Short Microarray Core Facility/Lipid Metabolism Unit Massachusetts General Hospital

2
Talk Outline Why perform a microarray experiment? Why perform a microarray experiment? Choosing a microarray platform Choosing a microarray platform Sources of variability that lend to experimental considerations Sources of variability that lend to experimental considerations Overcoming experimental variability Overcoming experimental variability

3
Why perform a microarray experiment? Genomic vantage point Genomic vantage point –Detect gene expression –Compare gene expression levels Over timeOver time Over treatment courseOver treatment course –Map genes to phenotypes –Map deleted or duplicated regions –Identify genes that modulate other genes Binary decision-making Binary decision-making

4
When not to perform a Microarray Experiment Interested in a small number of specific genes QRT-PCR, Northern blots Interested in a small number of specific genes QRT-PCR, Northern blots Desire quantitative results Desire quantitative results Low tolerance of variability Low tolerance of variability Cannot afford to perform experiment with adequate replication Cannot afford to perform experiment with adequate replication

5
Asking a Specific Question The most fundamental; the MOST IMPORTANT The most fundamental; the MOST IMPORTANT Simplifies experimental design Simplifies experimental design Empowers interpretation of data Empowers interpretation of data Simplicity, simplicity, simplicity! I say let your affairs be as one, two, three and to a hundred or a thousand… We are happy in proportion to the things we can do without.--Henry David Thoreau

6
Considerations of Microarray Experimental Design Which microarray platform will be used? Which microarray platform will be used? What is the end goal of the experiment? What is the end goal of the experiment? What is the specific question being asked? What is the specific question being asked? What are the most pertinent comparisons? What are the most pertinent comparisons? What controls will be applied to the experiments? What controls will be applied to the experiments? Which statistical methods will be used during data analysis? Which statistical methods will be used during data analysis? What methods will be used to verify results from the microarrays? What methods will be used to verify results from the microarrays?

7
Choosing a Microarray Platform Are genes of interest included on the array? Are genes of interest included on the array? Are genes replicated? Are genes replicated? Tiling of genes that undergo splicing Tiling of genes that undergo splicing Controls on array Controls on array Quantity of RNA needed for testing Quantity of RNA needed for testing Are the arrays adequately QC’d? Are the arrays adequately QC’d? Cost Cost

8
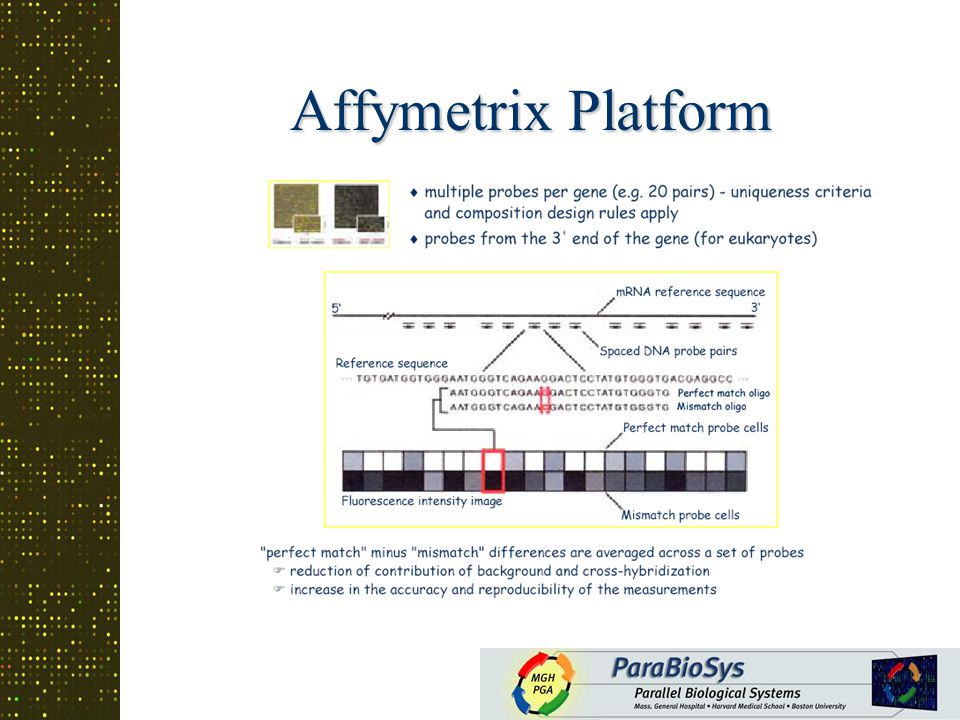
Affymetrix Platform

10
Pro’s Pro’s –standardized production –gene replication –probe tiling across gene –Reproducible –Affymetrix custom database user-friendly Con’s Con’s –Expensive –Annotation differences –single sample per chip

11
cDNA Platform cDNA clones (probes) 1. PCR product amplification amplification 2. Purification 3. Printing Pro’s Pro’s –Genome sequence independent –High stringency hybridization –Little need for signal amplification Con’s Con’s –Clone handling –Clone authentication –cDNA resources difficult to access and often cross- contaminated PCR products used as probes

12
Spotted oligonucleotide Platform Pro’s Pro’s –Complete control over oligo sequences –Absence of contamination –Additional probes may be added when needed –Flexibility of design, probe replication, and tiling –Inexpensive, enabling experimental replication Con’s Con’s –Sequence data required for probe design –No consensus set of probe design algorithms –Must have arraying instrumentation Synthesized oligonucleotides in 384 well plates 1.Purification 2.QC 3.Printing Oligonucleotides used as probes

13
Spotted Oligonucleotide vs Affymetrix Arrays probe set Probe design and synthesis Oligonulceotide Affymetrix

14
ParaBioSys Platform Long Oligonucleotides, 70mer Long Oligonucleotides, 70mer Designed and synthesized in-house Designed and synthesized in-house 5’-amine modified 5’-amine modified Extensively QC’d Extensively QC’d Probes designed to the 5’-orf Probes designed to the 5’-orf Set is updated as known orf list grows Set is updated as known orf list grows –Currently 20,000 probes

15
ParaBioSys probe design and synthesis Probe design using OligoPicker Probe design using OligoPicker –based on gen-pept database –Tm’s of selected oligos approx. the same –improved specificity

16
Oligonucleotide Quality Control pass fail Use of mass spectral analysis Use of mass spectral analysis –Identifies relative abundance –Ensures probe is of the expected mass based upon sequence Capillary Electrophoresis Capillary Electrophoresis –Identifies relative abundance of full- length product

17
Array Quality Control Spotted probes are 3’- labeled with dCTP-Cy3 using terminal deoxynucleotidyl transferase Spotted probes are 3’- labeled with dCTP-Cy3 using terminal deoxynucleotidyl transferase First and last array of the print-run are QC’d First and last array of the print-run are QC’d

18
Understanding sources of variability in microarray experiments ? ? ?

19
Sources of Variation Differences in identical treatments Differences in identical treatments Intrinsic biological variation Intrinsic biological variation Technical variation in extraction and labeling of RNA samples Technical variation in extraction and labeling of RNA samples Technical variation in hybridization Technical variation in hybridization Spot size variation Spot size variation Measurement error in scanning Measurement error in scanning

20
When graphing expression data, use log 0 5 10 15 20 -4 -2 0 2 4 ratio (T/C) log 2 ratio (T/C) ratio (T/C) log 2 ratio (T/C)
 log 2 ratio (T/C) ratio (T/C) log 2 ratio (T/C)")
21
log 2 T log 2 C Plotting expression data A M M= log ratio vs A=log geometric mean mean

22
Expression data-cont Low expressed Highly expressed log 2 (T i /C i ) Genes expressed up relative to reference by a factor of 32. Genes expressed down relative to reference by a factor of 1/32.

23
Differences Due to Treatment RNA isolation protocol differences RNA isolation protocol differences Cell-culture media changes Cell-culture media changes Expression differences over time Expression differences over time –Cell cycle genes (synchronization) Variables need to be minimized! Variables need to be minimized!

24
Biological Variability Self-self hybridizations of four independent biological replicates Biological variability of inhibitory PAS domain protein

25
Technical Variability Sample 1 Sample 2 Sample 1 Sample 3 Self-self hybridization (Cerebellar vs cerebellar) Self-self hybridization (Cerebellar vs cerebellar) –Sample 1 and 2 labeled together and hybridized on separate slides –Sample 3 labeled separately Arises from differences in labeling, efficiency in RT, hybridization, arrays, etc. Arises from differences in labeling, efficiency in RT, hybridization, arrays, etc.

26
Dye Effects Variation in quantum yield of fluorophores Variation in quantum yield of fluorophores Variation in the incorporation efficiency Variation in the incorporation efficiency Differential dye effects on hybridization Differential dye effects on hybridization Environmental Health Perspectives VOLUME 112 | NUMBER 4 | March 2004

27
Hybridization Variability

28
Printing Variability

29
Differences in Probe Performance Academic_1Academic_2ParaBioSysVendor Probe design algorithms will cause changes in the expression pattern Probe design algorithms will cause changes in the expression pattern Once a platform is chosen all future comparisons should be performed on the same platform Once a platform is chosen all future comparisons should be performed on the same platform Cross-platform comparisons as a means of validation Cross-platform comparisons as a means of validation

30
Differences Across Commercial Platforms P<0.001 Nucleic Acids Research, 2003, Vol. 31, No. 19, 5676-5684

31
Controlling Variability Experimental Plan

32
Increased Quality Control Probe QC Array QC Total RNA QC –denaturing agarose gel –Agilent Bioanalyzer Labeling QC

33
Controlling biological and technical variability with replication Average across replicates Average across replicates Essential to the estimation of variance Essential to the estimation of variance Critical for valid statistical analysis Integrin alpha 2b Pro-platelet basic protein

34
Controlling Dye Effects Dye-Swap Dye-Swap TC TC

35
Controlling Variability through Experimental Design Replication Replication –Spot –Multiple arrays per sample comparison (technical) Dye swapDye swap –Multiple samples per treatment group (biological) Increased precision and quality control Increased precision and quality control Estimate measurement error Estimate measurement error Estimate biological variation Estimate biological variation Pooling Pooling –Reduce biological variation
 Dye swapDye swap –Multiple samples per treatment group (biological) Increased precision and quality control Increased precision and quality control Estimate measurement error Estimate measurement error Estimate biological variation Estimate biological variation Pooling Pooling –Reduce biological variation")
36
Controlling Variability through Experimental Design –cont. Normalize data to correct for systematic differences (spot intensity, location on array, hybridization,dye,scanner, scanner parameters…) on the same slide or between slides, which is not a result of biological variation between mRNA samples Normalize data to correct for systematic differences (spot intensity, location on array, hybridization,dye,scanner, scanner parameters…) on the same slide or between slides, which is not a result of biological variation between mRNA samples Minimize printing differences by using a contiguous series of slides from the same print run Minimize printing differences by using a contiguous series of slides from the same print run If wanting to do historical comparisons, use the same platform If wanting to do historical comparisons, use the same platform
 on the same slide or between slides, which is not a result of biological variation between mRNA samples Normalize data to correct for systematic differences (spot intensity, location on array, hybridization,dye,scanner, scanner parameters…) on the same slide or between slides, which is not a result of biological variation between mRNA samples Minimize printing differences by using a contiguous series of slides from the same print run Minimize printing differences by using a contiguous series of slides from the same print run If wanting to do historical comparisons, use the same platform If wanting to do historical comparisons, use the same platform.")
37
Planning your experiment Experimental Aim Experimental Aim –Specific questions and priorities among them –How will the experiments answer the questions posed? Experimental logistics Experimental logistics –Types of total RNA samples Reference, control, cell line, tissue sample, treatment A….Reference, control, cell line, tissue sample, treatment A…. How will the samples be compared?How will the samples be compared? Number of arrays neededNumber of arrays needed Other Considerations Other Considerations –Plan of experimental process prior to hybridization: Sample isolation, RNA extraction, amplification, pooling, labelingSample isolation, RNA extraction, amplification, pooling, labeling –Limitations: number of arrays, amount of material –Extensibility (linking)
.")
38
Planning your Experiment- cont Other Considerations-cont Other Considerations-cont –Controls: positive, negative, in-spike controls –Methods of verification: QRT-PCR, Northern, in situ hybridization,…QRT-PCR, Northern, in situ hybridization,… Performing the experiment Performing the experiment –Reagents (arrays-from same print run), equipment (scanners), order of hybridizations
, equipment (scanners), order of hybridizations")
39
Controls Positive Controls Positive Controls –used to ensure that target DNAs are labeled to an acceptable specific activity –single pool of all probe elements on array Negative Controls Negative Controls –used to assess the degree of non-specific cross- hybridization –probes derived from organisms with no known homologs/paralogs to the organism of study –derived in silico (alien sequences) In-spike controls In-spike controls –Known amounts of polyadenylated mRNAs added to each labeling reaction –Should not cross-hybridize with with any probe sequences Alien sequencesAlien sequences Spot-report (Stratagene)Spot-report (Stratagene) Lucidea ScoreCard (Amersham Biosciences)Lucidea ScoreCard (Amersham Biosciences) –Can be used to assess dynamic range of the system
 In-spike controls In-spike controls –Known amounts of polyadenylated mRNAs added to each labeling reaction –Should not cross-hybridize with with any probe sequences Alien sequencesAlien sequences Spot-report (Stratagene)Spot-report (Stratagene) Lucidea ScoreCard (Amersham Biosciences)Lucidea ScoreCard (Amersham Biosciences) –Can be used to assess dynamic range of the system")
40
Validation If you have failed to If you have failed to validate your array data, validate your array data, you have NOT completed you have NOT completed your analysis your analysis ParaBioSys has developed ParaBioSys has developed Primer Bank for QRT-PCR Primer Bank for QRT-PCR primer sequences primer sequenceshttp://pga.mgh.harvard.edu/primerbank/

41
Many thanks for your attention Glenn Short Microarray Core Massachusetts General Hospital Massachusetts General Hospital https://dnacore.mgh.harvard.edu http://pga.mgh.harvard.edu

Similar presentations


 is a technique for studying chromosomal changes in cancer. As cancerous cells multiply, they can undergo dramatic.>")


 transcripts.>")


>")


 Trupti Joshi Computer Science Department 317 Engineering Building North 573-884-3528(O)>")


