Download presentation
Presentation is loading. Please wait.

1
Geographical Information Systems for historical research Achievements and methodologies Dr. Ian Gregory, Associate Director Centre for Data Digitisation and Analysis, Queen’s University Belfast

2
Components of data 1. Attribute (theme) –Says what the data is Textual, statistical, image, etc. 2. Temporal –Says when the data existed/are relevant for 3. Spatial –Say where the data refer to Can be precisely defined “at grid reference (x,y)” Can be vague “in the west of Ireland” –Difficult to handle On paper In a database –Neglected
 Can be vague in the west of Ireland –Difficult to handle On paper In a database –Neglected.")
3
GIS: A spatially-referenced database

4
ArcExplorer Free downloadable GIS viewer available from: http://www.esri.com/software/arcexplorer/index.html http://www.esri.com/software/arcexplorer/index.html

5
Advantages of GIS 1.Structures a database 2.Integrates a database through location 3.Data visualisation 4.Spatial analysis

6
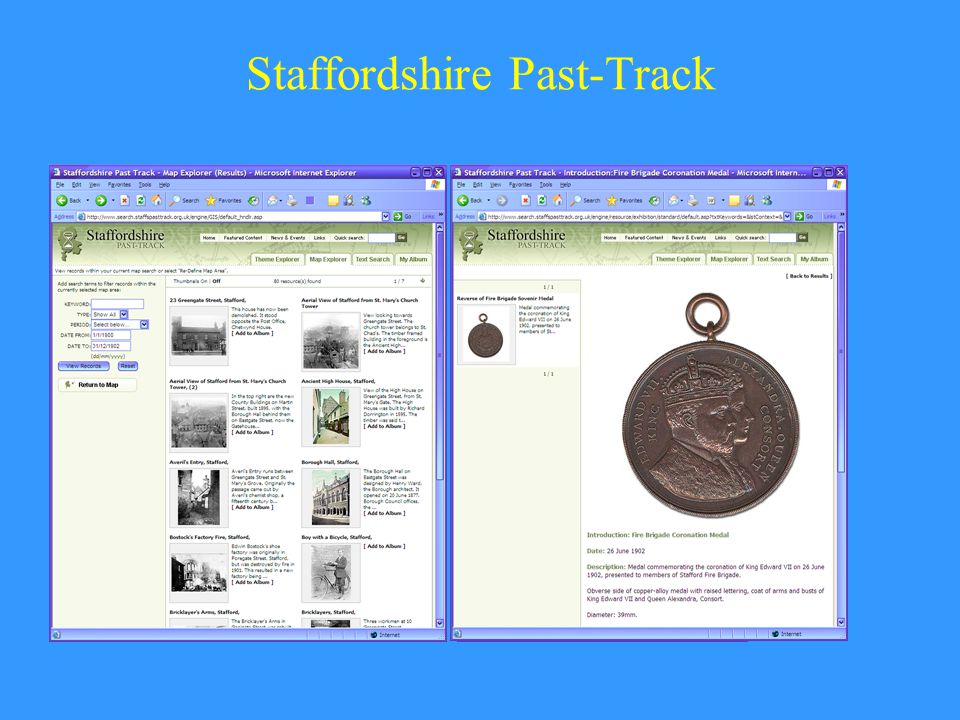
1. Structuring a database The Staffordshire Past-Track –http://www.staffspasttrack.org.uk/http://www.staffspasttrack.org.uk/ –Database of images of Staffordshire’s past 7,000 photographs 3,000 images of artwork 75 videos 3 audio files –Can be searched by: Theme: eg. Agriculture, Health & Welfare, Parks & Gardens Text: Key words, dates, media types, etc. Maps

7
Staffordshire Past-Track

9
2. Data Integration History of the book Source: MacDonald B and Black F (2000) “Using GIS for spatial and temporal analyses in print culture studies” Social Science History, 24, pp. 505-536
 Using GIS for spatial and temporal analyses in print culture studies Social Science History, 24, pp")
10
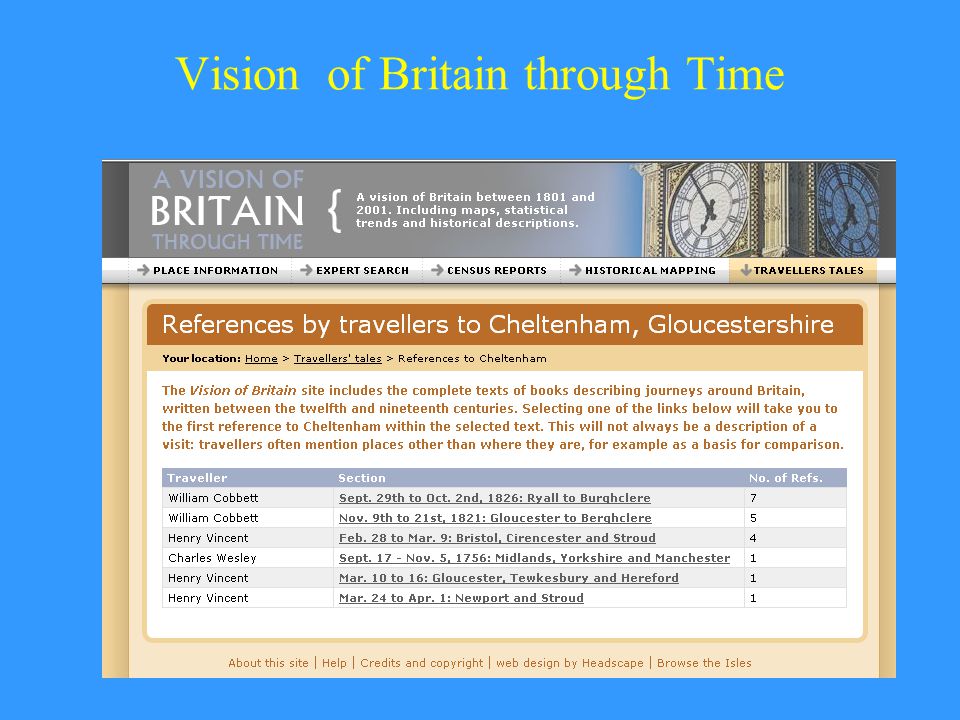
Vision of Britain through Time http://www/visionofbritain.org.uk

11
Vision of Britain through Time

15
3. Data Visualisation ChoroplethsCartograms Infant mortality, 1900s

16
The Battle of Hastings, 1066

17
4. Spatial analysis 1850s 1900s Infant mortality and the Core-Periphery Divide

18
Change in each buffer, 1850s-1900s

19
Spatial analysis Standardising administrative geographies over time Areal interpolation: “the transfer of data from one set (source units) to a second set (target units) of overlapping, non-hierarchical areal units” (Langford et al, 1991: p. 56)
.")
20
Areal Interpolation approaches Leighton Buzzard (rural and southern) IMRBirthsActual deaths Expected deaths Lives saved 1850s160.6467011076 1860s148.5668701021110483 1870s131.9869609191118199 1880s120.766184747993247 1890s126.634762603765162 1900s82.854104340659319 Total lives saved: 1009 As % of expected deaths: 27.75%
 IMRBirthsActual deaths Expected deaths Lives saved 1850s s s s s s Total lives saved: 1009 As % of expected deaths: 27.75%")
21
Lives saved by IM decline 1860s-1900s % of expected deathsTotal lives saved Legend uses deciles of total population (1911)
")
22
Population Change in Europe, 1910-40

23
Conclusions Positives: –Technology is stable and well understood –Opens up new possibilities in the study of history Negatives: –Databases complex and expensive to build. –Turning data into scholarship still not at an advanced stage. Websites: –ArcExplorer: http://www.esri.com/software/arcexplorer/index.htmlhttp://www.esri.com/software/arcexplorer/index.html –Staffordshire Past Track: http://www.staffspasttrack.org.uk/http://www.staffspasttrack.org.uk/ – Vision of Britain: http://www/visionofbritain.org.uk

Similar presentations


 & Paul Ell (Queens University, Belfast)>")


 has the ability to store, retrieve, manipulate and analyse a range of spatially related.>")

 Seraphim Alvanides (University.>")


