Download presentation
Presentation is loading. Please wait.

1
Forecasting the BET-C Stock Index with Artificial Neural Networks DOCTORAL SCHOOL OF FINANCE AND BANKING DOFIN ACADEMY OF ECONOMIC STUDIES MSc Student: Stoica Ioan-Andrei Supervisor: Professor Moisa Altar July 2006

2
Stock Markets and Prediction Predicting stock prices - goal of every investor trying to achieve profit on the stock market Predicting stock prices - goal of every investor trying to achieve profit on the stock market predictability of the market - issue that has been discussed by a lot of researchers and academics predictability of the market - issue that has been discussed by a lot of researchers and academics Efficient Market Hypothesis - Eugene Fama Efficient Market Hypothesis - Eugene Fama three forms: three forms: Weak: future stock prices can’t be predicted using past stock prices Weak: future stock prices can’t be predicted using past stock prices Semi-strong: even published information can’t be used to predict future prices Semi-strong: even published information can’t be used to predict future prices Strong: market can’t be predicted no matter what information is available Strong: market can’t be predicted no matter what information is available

3
Stock Markets and Prediction Technical Analysis Technical Analysis ‘castles-in-the air’ ‘castles-in-the air’ investors behavior and reactions according to these anticipations investors behavior and reactions according to these anticipations Fundamental Analysis Fundamental Analysis ‘firm foundations’ ‘firm foundations’ stocks have an intrinsic value determined by present conditions and future prospects of the company stocks have an intrinsic value determined by present conditions and future prospects of the company Traditional Time Series Analysis Traditional Time Series Analysis uses historic data attempting to approximate future values of a time series as a linear combination uses historic data attempting to approximate future values of a time series as a linear combination Machine Learning - Artificial Neural Networks Machine Learning - Artificial Neural Networks

4
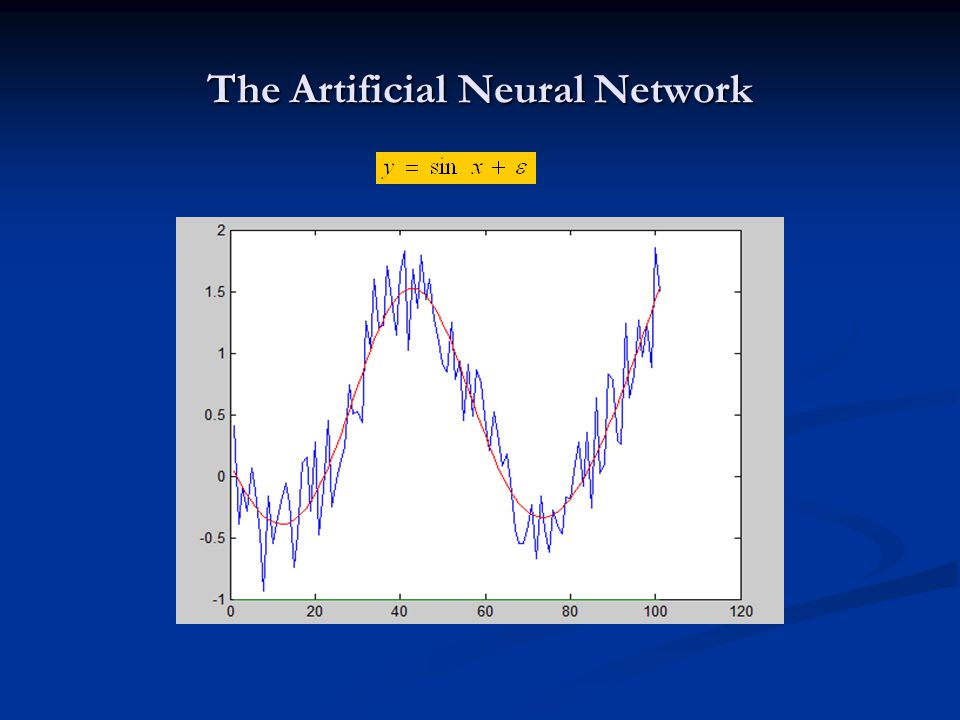
The Artificial Neural Network computational technique that benefits from techniques similar to those employed in the human brain computational technique that benefits from techniques similar to those employed in the human brain 1943 - W.S. McCulloch and W. Pitts attempted to mimic the ability of the human brain to process data and information and comprehend patterns and dependencies 1943 - W.S. McCulloch and W. Pitts attempted to mimic the ability of the human brain to process data and information and comprehend patterns and dependencies The human brain - a complex, nonlinear and parallel computer The human brain - a complex, nonlinear and parallel computer The neurons: The neurons: elementary information processing units elementary information processing units building blocks of a neural network building blocks of a neural network

5
The Artificial Neural Network semi-parametric approximation method semi-parametric approximation method Advantages: Advantages: ability to detect nonlinear dependencies ability to detect nonlinear dependencies parsimonious compared to polynomial expansions parsimonious compared to polynomial expansions generalization ability and robustness generalization ability and robustness no assumptions of the model have to be made no assumptions of the model have to be made flexibility flexibility Disadvantages: Disadvantages: has the ‘black box’ property has the ‘black box’ property training requires an experienced user training requires an experienced user training takes a lot of time, fast computer needed training takes a lot of time, fast computer needed overtraining overfitting overtraining overfitting undertraining underfitting undertraining underfitting

6
The Artificial Neural Network

8
Overtraining/Overfitting

9
Undertraining/Underfitting

10
Architecture of the Neural Network Types of layers: Types of layers: input layer: number of neurons = number of inputs input layer: number of neurons = number of inputs output layer: number of neurons = number of outputs output layer: number of neurons = number of outputs hidden layer(s): number of neurons = trial and error hidden layer(s): number of neurons = trial and error Connections between neurons: Connections between neurons: fully connected fully connected partially connected partially connected The activation function: The activation function: threshold function threshold function piecewise linear function piecewise linear function sigmoid functions sigmoid functions
: number of neurons = trial and error hidden layer(s): number of neurons = trial and error Connections between neurons: Connections between neurons: fully connected fully connected partially connected partially connected The activation function: The activation function: threshold function threshold function piecewise linear function piecewise linear function sigmoid functions sigmoid functions")
11
The feed forward network m = number of hidden layer neurons n = number of inputs

12
The Feed forward Network with Jump Connections

13
The Recurrent Neural Network - Elman allows the neurons to depend on their own lagged values building ‘memory’ in their evolution

14
Training the Neural Network Objective: minimizing the discrepancy between real data and the output of the network Ω - the set of parameters Ψ – loss function Ψ nonlinear nonlinear optimization problem - backpropagation - genetic algorithm

15
The Backpropagation Algorithm alternative to quasi-Newton gradient descent alternative to quasi-Newton gradient descent Ω 0 – randomly generated Ω 0 – randomly generated ρ – learning parameter, in [.05,.5] ρ – learning parameter, in [.05,.5] after n iterations: μ=0.9, momentum parameter after n iterations: μ=0.9, momentum parameter problem: local minimum points problem: local minimum points
![The Backpropagation Algorithm alternative to quasi-Newton gradient descent alternative to quasi-Newton gradient descent Ω 0 – randomly generated Ω 0 – randomly generated ρ – learning parameter, in [.05,.5] ρ – learning parameter, in [.05,.5] after n iterations: μ=0.9, momentum parameter after n iterations: μ=0.9, momentum parameter problem: local minimum points problem: local minimum points](http://images.slideplayer.com/15/4813778/slides/slide_15.jpg "The Backpropagation Algorithm alternative to quasi-Newton gradient descent alternative to quasi-Newton gradient descent Ω 0 – randomly generated Ω 0 – randomly generated ρ – learning parameter, in [.05,.5] ρ – learning parameter, in [.05,.5] after n iterations: μ=0.9, momentum parameter after n iterations: μ=0.9, momentum parameter problem: local minimum points problem: local minimum points")
16
The Genetic Algorithm based on Darwinian laws based on Darwinian laws Population Creation: N random vectors of weights Population Creation: N random vectors of weights Selection (Ωi Ωj) parent vectors Selection (Ωi Ωj) parent vectors Crossover & Mutation C1,C2 children vectors Crossover & Mutation C1,C2 children vectors Election Tournament: the fittest 2 vectors passed to the next generation Election Tournament: the fittest 2 vectors passed to the next generation Convergence: G* generations Convergence: G* generations G* - large enough so there are no significant changes in the fitness of the best individual for several generations G* - large enough so there are no significant changes in the fitness of the best individual for several generations
 parent vectors Selection (Ωi Ωj) parent vectors Crossover & Mutation C1,C2 children vectors Crossover & Mutation C1,C2 children vectors Election Tournament: the fittest 2 vectors passed to the next generation Election Tournament: the fittest 2 vectors passed to the next generation Convergence: G* generations Convergence: G* generations G* - large enough so there are no significant changes in the fitness of the best individual for several generations G* - large enough so there are no significant changes in the fitness of the best individual for several generations")
17
Experiments and Results BET-C stock index – daily closing prices, 16 April 1998 until 18 May 2006 BET-C stock index – daily closing prices, 16 April 1998 until 18 May 2006 daily returns: daily returns: conditional volatility - rolling 20-day standard deviation: conditional volatility - rolling 20-day standard deviation: BDS-Test for nonlinear dependencies: BDS-Test for nonlinear dependencies: H 0 : i.i.d. data H 0 : i.i.d. data BDS m,ε ~N(0,1) BDS m,ε ~N(0,1) Data Seriesm=2m=3m=4 ε=1ε=1.5ε=1ε=1.5ε=1ε=1.5 OD16.652617.697018.543618.720219.784919.0588 ARF16.262617.214818.380318.483919.761818.9595
 BDS m,ε ~N(0,1) Data Seriesm=2m=3m=4 ε=1ε=1.5ε=1ε=1.5ε=1ε=1.5 OD ARF")
18
Experiments and Results 3 types of Ann's: 3 types of Ann's: feed-forward network feed-forward network feed-forward network with jump connections feed-forward network with jump connections recurrent network recurrent network Input: [Rt-1 Rt-2 Rt-3 Rt-4 Rt-5] & Vt Input: [Rt-1 Rt-2 Rt-3 Rt-4 Rt-5] & Vt Output: next-day-return Rt Output: next-day-return Rt Training: genetic algorithm & backpropagation Training: genetic algorithm & backpropagation Data divided in: Data divided in: training set – 90% training set – 90% test set – 10% test set – 10% one-day-ahead forecasts - static forecasting one-day-ahead forecasts - static forecasting Network: Network: trained 100 times trained 100 times best 10 – SSE best 10 – SSE best 1 - RMSE best 1 - RMSE
![Experiments and Results 3 types of Ann s: 3 types of Ann s: feed-forward network feed-forward network feed-forward network with jump connections feed-forward network with jump connections recurrent network recurrent network Input: [Rt-1 Rt-2 Rt-3 Rt-4 Rt-5] & Vt Input: [Rt-1 Rt-2 Rt-3 Rt-4 Rt-5] & Vt Output: next-day-return Rt Output: next-day-return Rt Training: genetic algorithm & backpropagation Training: genetic algorithm & backpropagation Data divided in: Data divided in: training set – 90% training set – 90% test set – 10% test set – 10% one-day-ahead forecasts - static forecasting one-day-ahead forecasts - static forecasting Network: Network: trained 100 times trained 100 times best 10 – SSE best 10 – SSE best 1 - RMSE best 1 - RMSE](http://images.slideplayer.com/15/4813778/slides/slide_18.jpg "Experiments and Results 3 types of Ann s: 3 types of Ann s: feed-forward network feed-forward network feed-forward network with jump connections feed-forward network with jump connections recurrent network recurrent network Input: [Rt-1 Rt-2 Rt-3 Rt-4 Rt-5] & Vt Input: [Rt-1 Rt-2 Rt-3 Rt-4 Rt-5] & Vt Output: next-day-return Rt Output: next-day-return Rt Training: genetic algorithm & backpropagation Training: genetic algorithm & backpropagation Data divided in: Data divided in: training set – 90% training set – 90% test set – 10% test set – 10% one-day-ahead forecasts - static forecasting one-day-ahead forecasts - static forecasting Network: Network: trained 100 times trained 100 times best 10 – SSE best 10 – SSE best 1 - RMSE best 1 - RMSE")
19
Experiments and Results In-sample Criteria In-sample Criteria Out-of-sample Criteria Out-of-sample Criteria Pesaran-Timmerman Test for Directional Accuracy: Pesaran-Timmerman Test for Directional Accuracy: H 0 : signs of the forecast and those of the real data are independent H 0 : signs of the forecast and those of the real data are independent DA~N(0,1) DA~N(0,1) Evaluation Criteria
 DA~N(0,1) Evaluation Criteria")
20
Experiments and Results ROI - trading strategy based on the sign forecasts: ROI - trading strategy based on the sign forecasts: + buy sign + buy sign - sell sign - sell sign Finite differences: Finite differences: Benchmarks Naïve model: R t+1 =R t Naïve model: R t+1 =R t buy-and-hold strategy buy-and-hold strategy AR(1) model – LS – overfitting: AR(1) model – LS – overfitting: RMSE RMSE MAE MAE
 model – LS – overfitting: AR(1) model – LS – overfitting: RMSE RMSE MAE MAE")
21
Experiments and Results NaïveAR(1)FFN – no volFFNFFN-jumpRN R2R2 -0.0792570.0832520.0837550.0848270.091762 SSE-0.3327020.3312580.3310770.3306890.328183 RMSE0.0151000.0113440.0113250.0113040.0113320.011319 MAE0.0119480.0089320.0089290.0088730.0088670.008892 HR55.77% (111)56.78% (113)57.79% (115)59.79% (119) ROI0.2652710.2556050.3183740.3518900.3314640.412183 RP15.02%14.47%18.02%19.92%18.77%23.34% PT-Test--14.7915.01 14.49 B&H0.2753 FFNFFN-jumpRN Volatility-0.1123-0.1358-0.1841
FFN – no volFFNFFN-jumpRN R2R SSE RMSE MAE HR55.77% (111)56.78% (113)57.79% (115)59.79% (119) ROI RP15.02%14.47%18.02%19.92%18.77%23.34% PT-Test B&H FFNFFN-jumpRN Volatility")
22
Experiments and Results Actual, fitted ( training sample)
")
23
Experiments and Results Actual, fitted ( test sample)
")
24
Conclusions RMSE and MAE < AR(1) no signs of overfitting RMSE and MAE < AR(1) no signs of overfitting R 2 < 0.1 forecasting magnitude is a failure R 2 < 0.1 forecasting magnitude is a failure sign forecasting ~60% success sign forecasting ~60% success Volatility: Volatility: improves sign forecast improves sign forecast finite differences negative correlation finite differences negative correlation perceived as measure of risk perceived as measure of risk trading strategy: outperforms naïve model and buy-and-hold trading strategy: outperforms naïve model and buy-and-hold quality of the sign forecast – confirmed by Pesaran-Timmerman test quality of the sign forecast – confirmed by Pesaran-Timmerman test
 no signs of overfitting RMSE and MAE < AR(1) no signs of overfitting R 2 < 0.1 forecasting magnitude is a failure R 2 < 0.1 forecasting magnitude is a failure sign forecasting ~60% success sign forecasting ~60% success Volatility: Volatility: improves sign forecast improves sign forecast finite differences negative correlation finite differences negative correlation perceived as measure of risk perceived as measure of risk trading strategy: outperforms naïve model and buy-and-hold trading strategy: outperforms naïve model and buy-and-hold quality of the sign forecast – confirmed by Pesaran-Timmerman test quality of the sign forecast – confirmed by Pesaran-Timmerman test")
25
Further development Volatility: other estimates Volatility: other estimates neural classificator: specialized in sign forecasting neural classificator: specialized in sign forecasting using data outside the Bucharest Stock Exchange: using data outside the Bucharest Stock Exchange: T-Bond yields T-Bond yields exchange rates exchange rates indexes from foreign capital markets indexes from foreign capital markets

Similar presentations


>")


 l Biological Neurons l Artificial Neurons l Perceptrons l Multilayer Neural Networks l Backpropagation.>")


