Download presentation
Presentation is loading. Please wait.

1
Models for Sampled Data Systems
Chapter 12 Models for Sampled Data Systems <<<12.1>>> ###Sampled Data###

2
Motivation Up to this point in the book, we have assumed that the control systems we have studied operate in continuous time and that the control law is implemented in analogue fashion. Certainly in the early days of control, all control systems were implemented via some form of analogue equipment. Typically controllers were implemented using one of the following formats:- hydraulic pneumatic analogue electronic

3
However, in recent times, almost all analogue controllers have been replaced by some form of computer control. This is a very natural move since control can be conceived as the process of making computations based on past observations of a system’s behaviour so as to decide how one should change the manipulated variables to cause the system to respond in a desirable fashion. The most natural way to make these computations is via some form of computer.

4
A typical configuration includes:
A huge array of control orientated computers are available in the market place. A typical configuration includes: some form of central processing unit (to make the necessary computations)
")
5
analogue to digital converters (to read the analogue process signals into the computer).
(We call this the process of SAMPLING) digital to analogue converters (to take the desired control signals out of the computer and present them in a form whereby they can be applied back onto the physical process). (We call this the process of SIGNAL RECONSTRUCTION)
 digital to analogue converters (to take the desired control signals out of the computer and present them in a form whereby they can be applied back onto the physical process). (We call this the process of SIGNAL RECONSTRUCTION)")
6
Types of Control Orientated Computer
Depending upon the application, one could use many different forms of control computer. Typical control orientated computers are: DCS (Distributed Control System) These are distributed computer components aimed at controlling a large plant. PLC (Programmable Logic Controller) These are special purpose control computers aimed at simple control tasks - especially those having many on-off type functions. PC (Personal Computer) There is an increasing trend to simply use standard PC’s for control. They offer many advantages including minimal cost, flexibility and familiarity to users. ###Control Orientated Computer###
 These are distributed computer components aimed at controlling a large plant. PLC (Programmable Logic Controller) These are special purpose control computers aimed at simple control tasks - especially those having many on-off type functions. PC (Personal Computer) There is an increasing trend to simply use standard PC’s for control. They offer many advantages including minimal cost, flexibility and familiarity to users. ###Control Orientated Computer###")
7
Embedded Controller. In special purpose applications, it is quite common to use special computer hardware to execute the control algorithm. Indeed, the reader will be aware that many commonly used appliances (CD players, automobiles, motorbikes, etc.) contain special microprocessors which enable various control functions.
 contain special microprocessors which enable various control functions..")
8
Why Study Digital Control?
A simple (engineering) approach to digital control is to sample quickly and then to make some reasonable approximation to the derivatives of the digital data. For example, we could approximate the derivative of an analogue signal, y(t), as follows: where is the sampling period. The remainder of the design might then proceed exactly as for continuous time signals and systems using the continuous model. ###Digital Control### {{{digital, control}}}
 approach to digital control is to sample quickly and then to make some reasonable approximation to the derivatives of the digital data. For example, we could approximate the derivative of an analogue signal, y(t), as follows: where is the sampling period. The remainder of the design might then proceed exactly as for continuous time signals and systems using the continuous model. ###Digital Control### {{{digital, control}}}")
9
Actually, the above strategy turns out to be quite good and it is certainly very commonly used in practice. However, there are some unexpected traps for the unwary. These traps have lead to negative experiences for people naively trying to do digital control by simply mimicking analogue methods. Thus it is important to know when such simple strategies make sense and what can go wrong. We will illustrate by a simple example below.

10
D.C. Servo Motor Control We consider the control of a d.c. servo system via a computer. This is a very simple example. Yet we will show that this simple example can (when it is fully understood) actually illustrate almost an entire course on control. A photo of a typical d.c. servo system is shown on the next slide. ###D.C. Servo Motor Control###
 actually illustrate almost an entire course on control. A photo of a typical d.c. servo system is shown on the next slide. ###D.C. Servo Motor Control###")
11
Photo of Servo Laboratory System with Digital Control via a PC

12
The set-up for digital control of this system is shown schematically below:
The objective is to cause the output shaft position, y(t), to follow a given reference signal, y*(t).
, to follow a given reference signal, y*(t).")
13
Modelling Since the control computations will be done inside the computer, it seems reasonable to first find a model relating the sampled output, {y(k); k = 0, 1, … } to the sampled input signals generated by the computer, which we denote by {u(k), k = 0, 1, … }. (Here is the sample period). ###Modelling### {{{modelling}}}
; k = 0, 1, … } to the sampled input signals generated by the computer, which we denote by {u(k), k = 0, 1, … }. (Here is the sample period). ###Modelling### {{{modelling}}}")
14
We will see later in this chapter that the output at time k can be modelled as a linear function of past outputs and past controls. (We ask that the reader accept this for the moment). Thus the (discrete time) model for the servo takes the form:
 model for the servo takes the form:")
15
A Prototype Control Law
Conceptually, we want to go to the desired value y*. This suggests that we could simply set the right hand side of the equation on the previous slide equal to y*. Doing this we see that u(k) becomes a function of y(k) (as well as and At first glance this looks reasonable but on reflection we have left no time to make the necessary calculations. Thus, it would be better if we could reorganize the control law so that u(k) becomes a function of , … . Actually this can be achieved by changing the model slightly as we show on the next slide. ###Control Law###
 becomes a function of y(k) (as well as and . At first glance this looks reasonable but on reflection we have left no time to make the necessary calculations. Thus, it would be better if we could reorganize the control law so that u(k) becomes a function of , … . Actually this can be achieved by changing the model slightly as we show on the next slide. ###Control Law###")
16
Model Development Substituting the model into itself to yield:

17
We see that takes the following form:
where etc.

18
Actually, 1, 2, b1, b2, b3, can be estimated from the physical system. We will not go in to details here. However, for the system shown earlier the values turn out to be as follows for = 0.05 seconds: 1 = 2 = b1 = 1 b2 = b3 =

19
A Modified Prototype Control Law
Now we want the output to go to the reference y*. Recall we have the model: This suggests that all we need do is set equal to the desired set-point and solve for u(k). The answer is
. The answer is.")
20
Notice that the above control law expresses the current control u(k) as a function of
the reference, past output measurements, past control signals,

21
Also notice that 1 sampling interval exists between the measurement of and the time needed to apply u(k); i.e. we have specifically allowed time for the computation of u(k) to be performed after is measured!
 to be performed after is measured!.")
22
Recap All of this is very plausible so far. We have obtained a simple digital control law which causes to go to the desired value in one step ! Of course, the real system evolves in continuous time (readers may care to note this point for later consideration).
.")
23
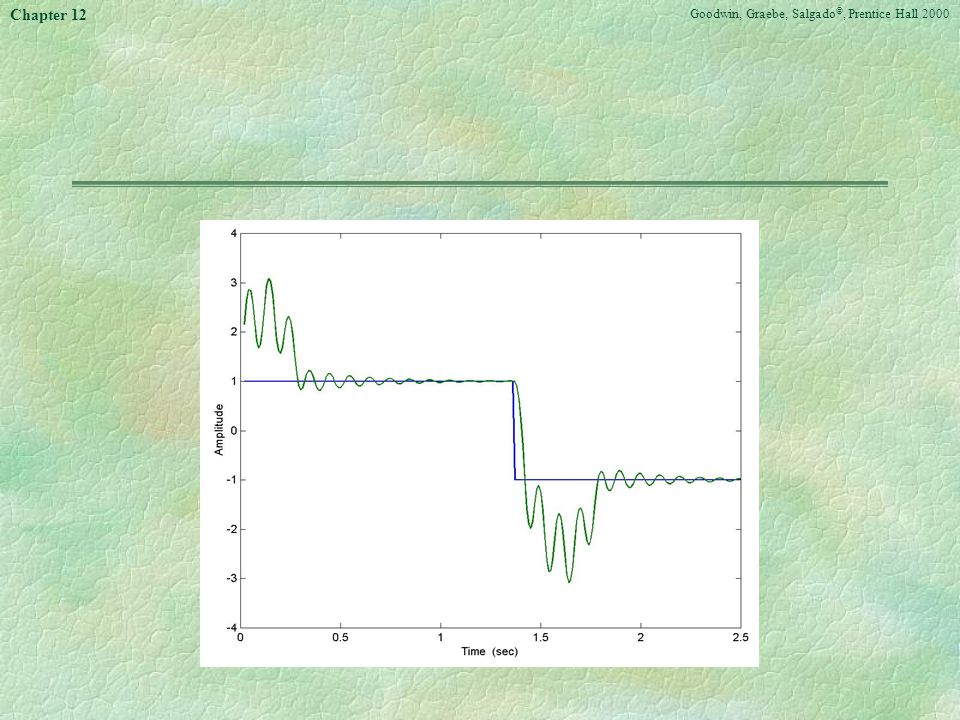
Simulation Results To check the above idea, we run a computer simulation. The results are shown on the next slide. Here the reference is a square wave. Notice that, as predicted, the output follows the reference with a delay of just 2 samples.

24
Simulation Results with Sampling Period 0.05 seconds

25
Experimental results However, when we try this on a real system, the results are extremely poor! Indeed, the system essentially goes unstable. Can the reader guess some of the causes for the difference between the ideal simulation results and the very poor real results?

26
Causes of the Poor Response
It turns out that there are many reasons for the poor response. Some of these are: 1. Intersample issues 2. Input saturation 3. Noise 4. Timing jitter The purpose of this chapter and the following two chapters is to understand these issues. To provide motivation for the reader we will briefly examine these issues for this simple servo example.

27
1. Intersample Issues If we look at the output response at a rate faster than the control sampling rate then we see that the actual response is as shown on the next slide. ###Intersample### {{{Intersample}}}

28
Simulation result showing full continuous output response

29
This is rather surprising
This is rather surprising! However, if we think back to the original question, we only asked that the sampled output go to the desired reference. Indeed it has. However, we said nothing about the intersample response! A full explanation of this phenomenon will be given in Chapter 14.

30
2. Input Saturation Looking again at the simulations, we see that this particular control law is calling for very large input signals. However, the D/A converter on the real servo kit only operates on a range of ±10 volts. We thus repeat the simulation but clamp the voltage at ±10 volts. The result is an unstable response. Indeed, clamping at ±100 volts still gives very poor results as shown on the next slide. ###Saturation###

32
Looking between the samples reveals even more structure to the result shown above. See the next slide.

34
The reader may recall that we studied windup and input saturation in Chapter 11. Maybe we should try the ideas presented in Chapter 11 here. We recall from Chapter 11 that the essential trick in anti-windup schemes is to ensure that the states of the control law are told that the input has saturated. This means that all we need do is to ensure that the saturated past input signals are stored in the computer to be used in subsequent control law calculations. Making the test gives the result on the next slide.

36
Experimental results revisited
Going back to the real servo kit and applying the above idea with anti-windup protection at ±10 volts gives the results on the next slide.

38
We see that we now, at least, have achieved stable operation
We see that we now, at least, have achieved stable operation. However, the results are nowhere near as good as those predicted by simulation.

39
3. Noise One further point that we have overlooked is that causing y(t) to approach y* as quickly as possible gives a very wide bandwidth controller. However, we saw in Chapter 8 that such a controller will necessarily magnify noise. Indeed, if we look at the steady response of the system (see the next slide) then we can see that noise is indeed causing problems. ###Noise###
 to approach y* as quickly as possible gives a very wide bandwidth controller. However, we saw in Chapter 8 that such a controller will necessarily magnify noise. Indeed, if we look at the steady response of the system (see the next slide) then we can see that noise is indeed causing problems. ###Noise###")
41
4. Timing Jitter Finally we realize that this particular real controller has been implemented in a computer that does not have a real-time operating system. This means that the true sampling rate actually varies around the design value. We call this timing jitter. This can be thought of as introducing modelling errors. Yet we are using a wideband controller. Thus, we should expect significant degradation in performance relative to the idealized simulations. ###Timing Jitter###

42
Finally, we make a much less demanding design and try a simple digital PID controller on the real system. The results are entirely satisfactory as can be seen on the next slide. Of course, the design bandwidth is significantly less than was attempted with the previous design.

44
Hopefully the above example has motivated the reader to say - “let’s study digital control”.
By the time you have studied the next three chapters you will understand all of the features of the above simple problem, e.g. how to build the model; what are the special features of the one-step-ahead control law we have used; and why funny things can (and sometimes do) happen between samples.
 happen between samples.")
45
The current chapter is principally concerned with modelling issues, i
The current chapter is principally concerned with modelling issues, i.e. how to relate samples of the output of a physical system to the sampled data input.

46
Specific topics to be covered are:
Discrete-time signals Z-transforms and Delta transforms Sampling and reconstruction Aliasing and anti-aliasing filters Sampled-data control systems

47
Sampling The result of sampling a continuous time signal is shown below: <<<12.2>>> ###Sampling### Figure 12.10: The result of sampling

48
There will always be loss of information due to sampling
There will always be loss of information due to sampling. However, the extent of this loss depends on the sampling method and the associated parameters. For example, assume that a sequence of samples is taken of a signal f(t) every seconds, then the sampling frequency needs to be large enough in comparison with the maximum rate of change of f(t). Otherwise, high frequency components will be mistakenly interpreted as low frequencies in the samples sequence.
 every seconds, then the sampling frequency needs to be large enough in comparison with the maximum rate of change of f(t). Otherwise, high frequency components will be mistakenly interpreted as low frequencies in the samples sequence.")
49
Example 12.1 Consider the signal
We observe that if the sampling period is chosen equal to 0.1[s] then from where it is evident that the high frequency component has been shifted to a constant, i.e. the high frequency component appears as a signal of low frequency (here zero). This phenomenon is known as aliasing.
. This phenomenon is known as aliasing.")
50
This effect is illustrated on the next slide.

51
Figure 12.1: Aliasing effect when using low sampling rate

52
Conclusion: To mitigate the effect of aliasing the sampling rate must be high relative to the rate of change of the signals of interest. A typical rule of thumb is to require that the sampling rate be 5 to 10 times the bandwidth of the signals.

53
Signal Reconstruction
The output of a digital controller is another sequence of numbers {u[k]} which are the sample values of the intended control signal. These sample values need to be converted back to continuous time functions before they can be applied to the plant. Usually, this is done by interpolating them into a staircase function u(t) as illustrated in Figure 12.2. <<<12.3>>> ###Signal reconstruction###
 as illustrated in Figure <<<12.3>>> ###Signal reconstruction###")
54
Figure 12.2: Staircase reconstruction

55
Illustration of Signal Reconstruction
Figure 12.11: The result of reconstruction

56
Modelling Given the process of signal reconstruction and sampling, we see that the net result is that, inside the computer, the system input and output simply appear as sequences of numbers. It therefore makes sense to build digital models that relate a discrete time input sequence, {u(k)}, to a sampled output sequence {y(k)}.
}, to a sampled output sequence {y(k)}.")
57
Linear Discrete Time Models
A useful discrete time model of the type referred to above is the linear version of the high order difference equation model. In the discrete case, this model takes the form: Note that we saw a special form of this model in relation to the motivational servo example presented earlier. <<<12.4>>> ###Linear Discrete Time Models###

58
To simplify the way we write the model equations, we will find it useful to have a simple notation to represent a time-shifted output sample, We introduce a special operator (the shift operator) that allows us to write this very compactly.
 that allows us to write this very compactly.")
59
The Shift Operator Forward shift operator
In terms of this operator, the model given earlier becomes: For a discrete time system it is also possible to have discrete state space models. In the shift domain these models take the form: <<<12.5>>> ###Shift Operator###

60
Z-Transform Analogously to the use of Laplace Transforms for continuous time signals, we introduce the Z-transform for discrete time signals. Consider a sequence {y[k]; k = 0, 1, 2, …]. Then the Z-transform pair associated with {y[k]} is given by <<<12.6>>> ###Z-Transform###

61
A table of Z-transforms of typical sequences is given in Table 12
A table of Z-transforms of typical sequences is given in Table 12.1 (see the next slide). Also, a table of Z-transform properties is given in Table 12.2 (see the slide after next).
. Also, a table of Z-transform properties is given in Table 12.2 (see the slide after next).")
62
Table 12.1: Z-transform table

63
Table 12. 2:. Z-transform properties. Note that Fi(z) = Z[fi[k]], [k]
Table 12.2: Z-transform properties. Note that Fi(z) = Z[fi[k]], [k] denotes, as usual, a unit step, y[] must be well defined and the convolution property holds provided that f1[k] = f2[k] = 0 for all k < 0.
![Table 12. 2:. Z-transform properties. Note that Fi(z) = Z[fi[k]], [k]](http://slideplayer.com/slide/4788879/15/images/63/Table+12.+2%3A.+Z-transform+properties.+Note+that+Fi%28z%29+%3D+Z%5Bfi%5Bk%5D%5D%2C+%EF%81%AD%5Bk%5D.jpg "Table 12.2: Z-transform properties. Note that Fi(z) = Z[fi[k]], [k] denotes, as usual, a unit step, y[] must be well defined and the convolution property holds provided that f1[k] = f2[k] = 0 for all k < 0.")
64
How do we use Z-transforms ?
We saw earlier that Laplace Transforms have a remarkable property that they convert differential equations into algebraic equations. Z-transforms have a similar property for discrete time models, namely they convert difference equations (expressed in terms of the shift operator q) into algebraic equations. We illustrate this below for a discrete high-order difference equation model:
 into algebraic equations. We illustrate this below for a discrete high-order difference equation model:")
65
Discrete Transfer Functions
Taking Z-transforms on each side of the high order difference equation model leads to where Yq(z), Uq(z) are the Z-transform of the sequences {y[k]} and {u[k]} respectively, and <<<12.7>>> ###Discrete Transfer Functions###
, Uq(z) are the Z-transform of the sequences {y[k]} and {u[k]} respectively, and. <<<12.7>>> ###Discrete Transfer Functions###")
66
We then see that (ignoring the initial conditions) the Z-transform of the output Y(z) is related to the Z-transform of the input by Y(z) = Gq(z)U(z) where Gq(z) is called the discrete (shift form) transfer function.
 is called the discrete (shift form) transfer function.")
67
An interesting observation
We see from Table 12.1 that the Z-transform of a unit pulse is 1. Also, we have just seen that Z-transform of the output of discrete linear systems satisfies Y(z) = Gq(z)U(z) where Gq(z) is the transfer function and U(z) the input. Hence, the transfer function is the Z-transform of the output when the input is a Kronecker delta.
 = Gq(z)U(z) where Gq(z) is the transfer function and U(z) the input. Hence, the transfer function is the Z-transform of the output when the input is a Kronecker delta.")
68
Example: Find the unit step response of a system with transfer function given by Solution: The Z-transform of the step response, y[k], is given by The response is shown on the next slide.
![Example: Find the unit step response of a system with transfer function given by. Solution: The Z-transform of the step response, y[k], is given by.](http://slideplayer.com/slide/4788879/15/images/68/Example%3A+Find+the+unit+step+response+of+a+system+with+transfer+function+given+by.+Solution%3A+The+Z-transform+of+the+step+response%2C+y%5Bk%5D%2C+is+given+by..jpg "The response is shown on the next slide.")
69
Figure 12. 3:. Unit step response of a system
Figure 12.3: Unit step response of a system exhibiting ringing response

70
Note that the response contains the term (-0
Note that the response contains the term (-0.5)k, which corresponds to an oscillatory behavior (known as ringing). In discrete time this can occur (as in this example) for a single negative real pole whereas, in continuous time, a pair of complex conjugate poles are necessary to produce this effect.
k, which corresponds to an oscillatory behavior (known as ringing). In discrete time this can occur (as in this example) for a single negative real pole whereas, in continuous time, a pair of complex conjugate poles are necessary to produce this effect.")
71
Discrete Delta Domain Models
The shift operator (as described above) is used in the vast majority of digital control and digital signal processing work. However, in some applications the shift operator can lead to difficulties. The reason for these difficulties are explained below. <<<12.8>>> ###Discrete Delta Domain Models###
 is used in the vast majority of digital control and digital signal processing work. However, in some applications the shift operator can lead to difficulties. The reason for these difficulties are explained below. <<<12.8>>> ###Discrete Delta Domain Models###")
72
Consider the first order continuous time equation
and the corresponding discretized shift operator equation is of the form: Expanding the differential explicitly as a limiting operation, we obtain the following form of the continuous time equation:

73
If we now compare the discrete model to the approximate expanded form, namely
we then see that the fundamental difference between continuous and discrete time is that the discrete model describes absolute displacements (i.e. y(t+) in terms of y(t), etc.) whereas the differential equation describes the increment
 in terms of y(t), etc.) whereas the differential equation describes the increment.")
74
This fundamental difficulty is avoided by use of an alternative operator; namely the Delta operator:
For sampled signals, an important feature of this operation is the observation that i.e., the Delta operator acts as a derivative in the limit as the sampling period 0. Note, however, that no approximations will be involved in employing the Delta operator for finite sampling periods since we will derive

75
exact model descriptions relevant to this operator at the given sampling rate.
We next develop an alternative discrete transform (which we call the Delta transform) which is the appropriate transform to use with the Delta operator, i.e. Time Domain Transfer Domain q Z-transform delta transform
 which is the appropriate transform to use with the Delta operator, i.e. Time Domain. Transfer Domain. q. Z-transform. delta transform.")
76
Discrete Delta Transform
We define the Discrete Delta Transform pair as: The Discrete Delta Transform can be related to Z-transform by noting that where Yq(z) = Z[(k)]. Conversely <<<12.9>>> ###Discrete Delta Transform###
 = Z[(k)]. Conversely. <<<12.9>>> ###Discrete Delta Transform###")
77
The next slide shows a table of Delta transform pairs;
The slide after next lists some Delta transform properties.

78
Table 12.3: Delta Transform Table

79
Table 12. 4:. Delta Transform properties
Table 12.4: Delta Transform properties. Note that Fi() = D[fi[k]], [k] denotes, as usual, a unit step, f[] must be well defined and the convolution property holds provided that f1[k] = f2[k] = 0 for all k < 0.
 = D[fi[k]], [k] denotes, as usual, a unit step, f[] must be well defined and the convolution property holds provided that f1[k] = f2[k] = 0 for all k < 0.")
80
Why is the Delta Transform sometimes better than the Z-Transform?
As can be seen from by comparing the Z-transform given in Table 12.1 with those for the Laplace Transform given in Table 4.1, expressions in Laplace and Z-transform do not exhibit an obvious structural equivalence. Intuitively, we would expect such an equivalence to exist when the discrete sequence is obtained by sampling a continuous time signal. We will show that this indeed happens if we use the alternative delta operator.

81
In particular, by comparing the entries in Table 12
In particular, by comparing the entries in Table 12.3 (The Delta Transform) with those in Table 4.1 (The Laplace Transform) we see that a key property of Delta Transforms is that they converge to the associated Laplace Transform as 0, i.e. We illustrate this property by a simple example:
 with those in Table 4.1 (The Laplace Transform) we see that a key property of Delta Transforms is that they converge to the associated Laplace Transform as 0, i.e. We illustrate this property by a simple example:")
82
Example 12.9 Say that {y[k]} arises from sampling, at period , a continuous time exponential et. Then and, from Table 12.3 In particular, note that as 0, which is the Laplace transform of et. Hence we confirm the close connections between the Delta and Laplace Transforms.
![Example 12.9 Say that {y[k]} arises from sampling, at period , a continuous time exponential et. Then.](http://slideplayer.com/slide/4788879/15/images/82/Example+12.9+Say+that+%7By%5Bk%5D%7D+arises+from+sampling%2C+at+period+%EF%81%84%2C+a+continuous+time+exponential+e%EF%81%A2t.+Then..jpg "and, from Table In particular, note that as 0, which is the Laplace transform of et. Hence we confirm the close connections between the Delta and Laplace Transforms.")
83
How do we use Delta Transforms?
We saw earlier in this chapter that Z-transforms could be used to convert discrete time models expressed in terms of the shift operator into algebraic equations. Similarly, the Delta Transform can be used to convert difference equations (expressed in terms of the Delta operator) into algebraic equations. The Delta Transform also provides a smooth transition from discrete to continuous time as the sampling rate increases.
 into algebraic equations. The Delta Transform also provides a smooth transition from discrete to continuous time as the sampling rate increases.")
84
We next examine several properties of discrete time models, beginning with the issue of stability.

85
Discrete System Stability
Relationship to Poles We have seen that the response of a discrete system (in the shift operator) to an input U(z) has the form where 1 … n are the poles of the system. We then know, via a partial fraction expansion, that Y(z) can be written as <<<12.12>>> ###Discrete System Stability###
 to an input U(z) has the form. where 1 … n are the poles of the system. We then know, via a partial fraction expansion, that Y(z) can be written as. <<<12.12>>> ###Discrete System Stability###")
86
where, for simplicity, we have assumed non repeated poles.
The corresponding time response is Stability requires that [j]k 0, which is the case if [j] < 1. Hence stability requires the poles to have magnitude less than 1, i.e. to lie inside a unit circle centered at the origin.

87
Delta Domain Stability
We have seen that the delta domain is simply a shifted and scaled version of the Z-Domain, i.e. It follows that the Delta Domain stability boundary is simply a shifted and scaled version of the Z-domain stability boundary. In particular, the delta domain stability boundary is a circle of radius 1/ centered on - 1/ in the domain. Note again the close connection between the continuous s-domain and discrete -domain, since the -stability region approaches the s-stability region (OLHP) as 0.
 as 0.")
88
Discrete Models for Sampled Continuous Systems
So far in this chapter, we have assumed that the model is already given in discrete form. However, often discrete models arise by sampling the output of a continuous time system. We thus next examine how to obtain discrete time models which link the sampled output of a continuous time system to a sampled input. We are thus interested in modelling a continuous system operating under computer control. <<<12.13>>> ###Discrete Models for Continuous Systems###

89
A typical way of making this interconnection is shown on the next slide.
The analogue to digital converter (A/D in the figure) implements the process of sampling (at some fixed period ). The digital to analogue converter (D/A in the figure) interpolates the discrete control action into a function suitable for application to the plant input.
 implements the process of sampling (at some fixed period ). The digital to analogue converter (D/A in the figure) interpolates the discrete control action into a function suitable for application to the plant input.")
90
Figure 12.4: Digital control of a continuous time plant

91
Details of how the plant input is reconstructed
When a zero order hold is used to reconstruct u(t), then Note that this is the staircase signal shown earlier in Figure Discrete time models typically relate the sampled signal y[k] to the sampled input u[k]. Also a digital controller usually evaluates u[k] based on y[j] and r[j], where {r(k)} is the reference sequence and j k.
, then. Note that this is the staircase signal shown earlier in Figure Discrete time models typically relate the sampled signal y[k] to the sampled input u[k]. Also a digital controller usually evaluates u[k] based on y[j] and r[j], where {r(k)} is the reference sequence and j k.")
92
Using Continuous Transfer Function Models
We observe that the generation of the staircase signal u(t), from the sequence {u(k)} can be modeled as in Figure 12.5. Figure 12.5: Zero order hold
, from the sequence {u(k)} can be modeled as in Figure Figure 12.5: Zero order hold.")
93
Figure 12.6: Discrete time equivalent model with zero order hold
Combining the circuit on the previous slide with the plant transfer function G0(s), yields the equivalent connection between input sequence, u(k), and sampled output y(k) as shown below:
, yields the equivalent. connection between input sequence, u(k), and. sampled output y(k) as shown below:")
94
We saw earlier that the transfer function of a discrete time system, in Z-transform form is the Z-transform of the output (the sequence {y[k]}) when the input, u[k], is a Kronecker delta, with zero initial conditions. We also have, from the previous slide, that if u[k] = K[k], then the input to the continuous plant is a Dirac Delta, i.e. us(t) = (t). If we denote by Heq(z) the transfer function from Uq(z) to Yq(z), we then have the following result.
![We saw earlier that the transfer function of a discrete time system, in Z-transform form is the Z-transform of the output (the sequence {y[k]}) when the input, u[k], is a Kronecker delta, with zero initial conditions.](http://slideplayer.com/slide/4788879/15/images/94/We+saw+earlier+that+the+transfer+function+of+a+discrete+time+system%2C+in+Z-transform+form+is+the+Z-transform+of+the+output+%28the+sequence+%7By%5Bk%5D%7D%29+when+the+input%2C+u%5Bk%5D%2C+is+a+Kronecker+delta%2C+with+zero+initial+conditions..jpg "We also have, from the previous slide, that if u[k] = K[k], then the input to the continuous plant is a Dirac Delta, i.e. us(t) = (t). If we denote by Heq(z) the transfer function from Uq(z) to Yq(z), we then have the following result..")
95
Example 12.10 Consider the d.c. servo motor problem used as motivation for this chapter. The continuous time transfer function is Using the result on the previous slide we see that

96
This model is of the form:
Note that this is a second order transfer function with a first order numerator. The reader may care to check that this is consistent with the input-output model which was stated without proof in the introduction i.e. We have thus fulfilled one promise of showing where this model comes from.

97
Using Continuous State Space Models
Next we show how a discrete model can be developed when the plant is described by a continuous time state space model Then, using the solution formula (see Chapter 3) the sampled state response over an interval is given by Now using the fact that u(+k) is equal to u(k) for 0 < we have <<<12.14>>> ###Discrete State Space Models###
 the sampled state response over an interval is given by. Now using the fact that u(+k) is equal to u(k) for. 0 < we have. <<<12.14>>> ###Discrete State Space Models###")
98
where Also the output is

99
Shift form The discrete time state space model derived above can be expressed compactly using the forward shift operator, q, as where

100
Delta Form Alternatively, the discrete state space model can be
expressed in Delta form as

101
Some Comparisons of Shift and Delta Forms
For the delta form we have For the shift form Indeed, this reconfirms one of the principal advantages of the delta form, namely that it converges to the underlying continuous time model as the sampling period approaches zero. Note that this is not true of the alternative shift operator form.

102
Frequency Response of Sampled Data Systems
We next evaluate the frequency response of a linear discrete time system having transfer function Hq(z). Consider a sine wave input given by where Following the same procedure as in the continuous time case (see Section 4.9) we see that the system output response to the input is <<<12.15>>> ###Frequency Response of Sampled Data Systems###
. Consider a sine wave input given by. where. Following the same procedure as in the continuous time case (see Section 4.9) we see that the system output response to the input is. <<<12.15>>> ###Frequency Response of Sampled Data Systems###")
103
The frequency response of a discrete time system depends upon ej and is thus periodic in with period 2/. The next slide illustrates this fact by showing the frequency response of

104
Figure 12. 7:. Periodicity in the frequency response of
Figure 12.7: Periodicity in the frequency response of sampled data systems.

105
Another feature of particular interest is that the sampled data frequency response converges to its continuous counterpart as 0 and hence much insight can be obtained by simply looking at the continuous version. This is exemplified below. Example 12.11: Consider the two systems shown in Figure 12.8 on the next page: Compare the frequency response of both systems in the range [0, s].

106
Figure 12.8: Continuous and sampled data systems

107
The continuous time transfer function
The continuous and discrete frequency responses are:

108
Note that for << s and a << s i. e
Note that for << s and a << s i.e. << 1 and a << 1, then we can use a first order Taylor’s series approximation for the exponentials e-a and ej in the discrete case leading to The next slide compares the two frequency responses as a function of input frequency for two different values of . Note that for small, the two frequency responses are very close.

109
Figure 12.9: Asymptotic behavior of a sampled data transfer function

110
Summary Very few plants encountered by the control engineer are digital, most are continuous. That is, the control signal applied to the process, as well as the measurements received from the process, are usually continuous time. Modern control systems, however, are almost exclusively implemented on digital computers. Compared to the historical analog controller implementation, the digital computer provides much greater ease of implementing complex algorithms, convenient (graphical) man-machine interfaces, logging, trending and diagnostics of internal controller and flexibility to implement filtering and other forms of signal processing operations. <<<12.16>>> ###Summary###
 man-machine interfaces, logging, trending and diagnostics of internal controller and. flexibility to implement filtering and other forms of signal processing operations. <<<12.16>>> ###Summary###")
111
Digital computers operate with sequences in time, rather than continuous functions in time. Therefore, input signals to the digital controller-notably process measurements - must be sampled; outputs from the digital controller-notably control signals - must be interpolated from a digital sequence of values to a continuous function in time. Sampling (see next slide) is carried out by A/D (analog to digital converters.
 is carried out by A/D (analog to digital converters.")
112
Figure 12.10: The result of sampling
The converse, reconstructing a continuous time signal from digital samples, is carried out by D/A (digital to analog) converters. There are different ways of interpolating between the discrete samples, but the so called zero-order hold (see next slide) is by far the most common.
 converters. There are different ways of interpolating between the discrete samples, but the so called zero-order hold (see next slide) is by far the most common.")
113
Figure 12.11: The result of reconstruction
When sampling a continuous time signal, an appropriate sampling rate must be chosen an anti-aliasing filter (low-pass) should be included to avoid frequency folding. Analysis of digital systems relies on discrete time versions of the continuous operators.
 should be included to avoid frequency folding. Analysis of digital systems relies on discrete time versions of the continuous operators.")
114
The chapter has introduced two discrete operators:
the shift operator, q, defined by the -operator, , defined by Thus, or Due to this conversion possibility, the choice is largely based on preference and experience. Comparisons are outlined below.

115
The -operator, , has the advantages of:
The shift operator, q, is the traditional operator; is the operator many engineers feel more familiar with; is used in the majority of the literature. The -operator, , has the advantages of: emphasizing the link between continuous and discrete systems (resembles a differential); -expressions converge to familiar continuous expressions as 0, which is intuitive; is numerically vastly superior at fast sampling rates when properly implemented.
; -expressions converge to familiar continuous expressions as 0, which is intuitive; is numerically vastly superior at fast sampling rates when properly implemented.")
116
With the help of these operators,
Analysis of digital systems relies on discrete time versions of the continuous operators: the discrete version of the differential operator is difference operator; the discrete version of the Laplace Transform is either the Z-transform (associated with the shift operator) or the -transform (associated with the -operator). With the help of these operators, continuous time differential equation models can be converted to discrete time difference equation models; continuous time transfer or state space models can be converted to discrete time transfer or state space models in either the shift or operators.
 or the -transform (associated with the -operator). With the help of these operators, continuous time differential equation models can be converted to discrete time difference equation models; continuous time transfer or state space models can be converted to discrete time transfer or state space models in either the shift or operators.")
Similar presentations


 Kevin D. Donohue Electrical and Computer Engineering University of Kentucky.>")


