Download presentation
Presentation is loading. Please wait.

1
Responsible mining – people’s participation and technology Sumita Sindhi & P R Choudhury KIIT School of Rural Management KIIT University Bhubaneswar (India) Land & Poverty Conference 26 March 2015
 Land & Poverty Conference 26 March 2015")
2
Flow of presentation Mining in Odisha Social & Ecological impact of mining Summary LGAF Panel 5 Shah Commission Report Responsible Mining for inclusive growth

4
Minerals - Odisha Largest reserves of iron ore in country 93% Chromite and Nickel 52% Bauxite 44% Manganese 24% coal deposits

5
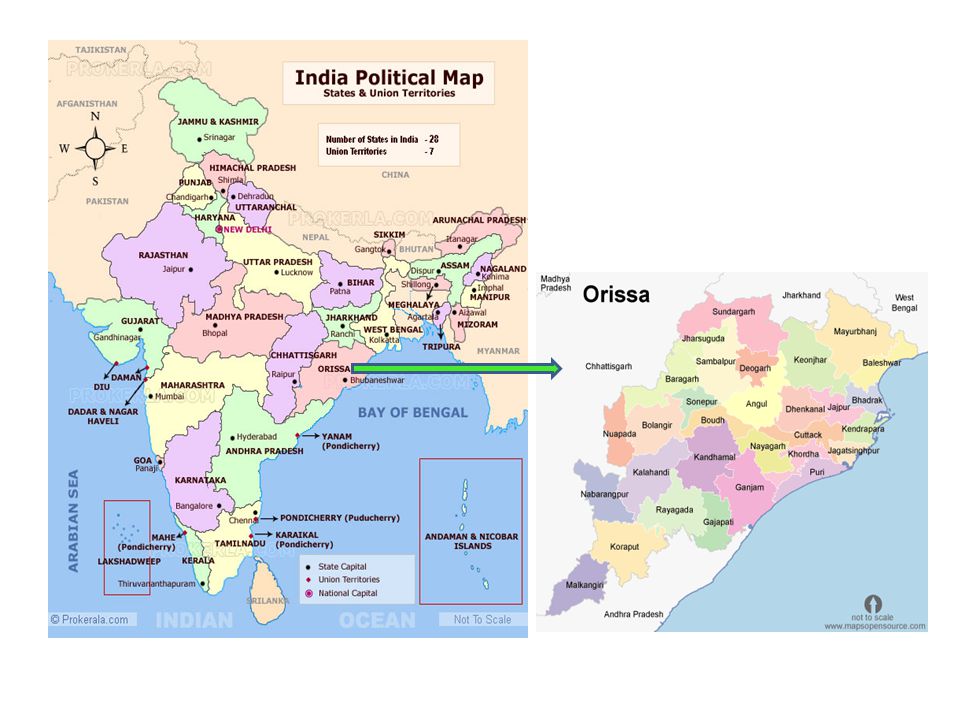
Mineral map of Odisha

6
Mine Profile - Odisha

7
Share of mining and quarrying sector in Odisha’s real GSDP 2004-05 to 2013-14 Average GSDP for a decade 2003-04 to 2013-14 is 7.14

8
Value of mineral production in Odisha Total value of minerals in Odisha amounts to $ 5644.35 million and the production of minerals in year 2012-13 is 186.680 million MT

9
Total exports of minerals and ores

10
598 mining leases in 2012-13, covering an area of 98355 ha Out of these, 128 leases over an area of 66293 ha in operation In 2012-13, MoUs for 49 Steel projects have been signed amounting to USD 37168.06 milion for an estimated production capacity of 83.66 million tons per annum (MTPA)
")
11
For FDI Odisha is the favoured destination. As per ASSOCHAM, Odisha got the lion’s share with 7738.59 USD as FDI in 2011-12. This accounts for 27% of the total FDI to India.

12
Reality Bite (Resource Curse) In a decade from 1993-2003, a growth of 278 percent in mining and quarrying (from Rs.7005 million to Rs.19, 489 million) is phenomenal. Agriculture, forestry and fishery sector production fell by 16 percent (from Rs.71, 625 to Rs.60, 866 million in the same period)
.")
13
Tendulkar Committee Report 2009 – Poverty headcount ratio - 57.2 % (highest in India) – Multidimensional poverty index – 63.2% BPL – Rural poverty – 60.8% – Urban poverty – 37.6% – Incidence of poverty higher in Schedule Tribes
 – Multidimensional poverty index – 63.2% BPL – Rural poverty – 60.8% – Urban poverty – 37.6% – Incidence of poverty higher in Schedule Tribes")
14
UNDP – Human Development Report Health – 41.1% women BMI less than 18.5 – Under 5 mortality rate – 90.6 per thousand – Proportion of underweight children – 40.7 % Household amenities – 85% families have access to drinking water – 4/5 th households do not have toilet facilities Literacy rate – Overall – 73.45% – Male literacy rate – 82% – Female literacy rate – 64% Human Development Value – 0.362

15
Mineral map of Odisha

16
Forest Map of Odisha

17
Schedule Tribe Population (in %)
")
18
Social impact of mining Mining industry is major perpetuator for marginalization of indigenous communities Alienation from land and livelihood resources 1.4 million people displaced - 80% indigenous people

19
Workers directly employed in major mineral based activities in Odisha In 2012-13, employment in mineral based activity is just 0.338% of total workers employed in Odisha

20
Ecological Issues of mineral based industry 80% steel projects in small category Of these 64% of the units fall into highly polluting or red category 7% are the moderately polluting or orange category of industries Threat to wildlife especially some “critically threatened species”- wild boar and hyena 16% forest land diverted for mining

21
Diversion of forest area to non-forest use by activity

22
Transparency Complete database in respect of number of people affected/ displaced, employment provided, etc., were not available either at Department or at district level. Rehabilitation and Periphery Development Advisory Committees (RPDAC) constituted for respective projects to approve R&R planning and its implementation for affected people left gaps in their functioning. RPDAC did not review decisions leaving large number of issues unaddressed CAG Report 2012-13
 constituted for respective projects to approve R&R planning and its implementation for affected people left gaps in their functioning. RPDAC did not review decisions leaving large number of issues unaddressed CAG Report")
24
LGAF findings (Panel 5) Investor friendly policies and institutions The process of land disposal is not transparent. The land is neither auctioned nor allotted in open tender process, but leased out as per the requirement of the investor and within the discretion of the concerned competent authority. Only 10% of land required for commercial purpose is auctioned As per state policy of industrialization, land is leased at concessional rates, which are much below the market value of land

25
There is no specific policy stating benefit sharing in the process of transfer of public land There is limited consultation with community concerning decisions on change of land use and negotiation between the community and private investors is also to a limited extent Though the procedures for resettlement exist in the policy, its actual scope is clearly circumscribed, since the implementation is not effective in line with best practice.

26
Shah Commission Report Shah Commission report provides information on 82 iron and manganese cases showing 1388.66 ha area under encroachment – Illegal mining in forest areas – Lack of transparency - all information on mining leases should be made public – Welfare of local inhabitants – especially tribals – Equity for tribals – used for tribal welfare – Revising royalty rites – mechanism of sharing – E-auctioning of iron ore – Mining lease by public auction

27
Discontent Over land Economic issues Ecological issues Social issues Is it responsible mining?

28
Progressive Legislations National Green Tribunal Forest Rights Act 2006 Right to Fair Compensation, Resettlement, Rehabilitation and Transparency in Land Acquisition (LARR 2013) ????????
")
29
Shah Commission Report DGPS survey of the mining lease areas – to be monitored twice in a year mandatorily Satellite images of high resolution of leased areas to be submitted by the lessee in the months of October – November and April – May each year Forest and Mines Department and MoEF should also evolve a methodology on these guidelines to monitor the projects Does not mention about people’s participation

30
Inclusive growth through mining Stakeholder Participation – During negotiation & benefit sharing mechanism – Gain in land use change, access and utilization of assets – Participation in monitoring Transparency in land transfer

31
Technological interventions Land Use Policy & Zoning Identification of land for industrial use - GIS based land use planning MIS database Logical and technical assessment and standardization

32
Thank You

Similar presentations


alk m>")

>")


102937 Rural population (%)6785 ST & SC population (%)ST - 8, SC - 16ST - 22, SC.>")


