Download presentation
Presentation is loading. Please wait.

1
American Samoa Seismic Hazard Maps Mark D. Petersen, Stephen C. Harmsen, Kenneth S. Rukstales, Charles S. Mueller, Daniel E. McNamara, Nicolas Luco, and Melanie Walling

2
American Samoa Formed by migration of tectonic plate over hot spot 2 to 28 Ma Pacific Plate motion GPS vector Tonga trench is one of most active subduction zones ( 15-24 cm/yr), 22 M 7 earthquakes in last 110 yrs September, 2009 M 8.1 event on outer rise and interface
, 22 M 7 earthquakes in last 110 yrs September, 2009 M 8.1 event on outer rise and interface")
3
American Samoa tectonics

4
Depth sections

5
Moment tensors

6
South Pacific Zones for calculating b-value and Mmax

7
Seismicity analysis

8
Magnitude-frequency For this analysis we use 1964+ catalog The rate of M 5’s seems to be higher The rate of M 7+ is similar Completeness near M 5

9
Magnitude-frequency

10
Magnitude-frequency plot by source

11
Magnitude-frequency plot Vanuatu

12
Magnitude-frequency for Tonga-Kermedec trench Model has two Mmax branches, M 8.5, 9, weighted equally

13
Ground motion analysis

14
Interface and Intraplate Earthquakes Interface and Intraplate, d=25 km

15
Interface and Intraplate Earthquakes

16
Intraplate and Interface Earthquakes M 9 curves

18
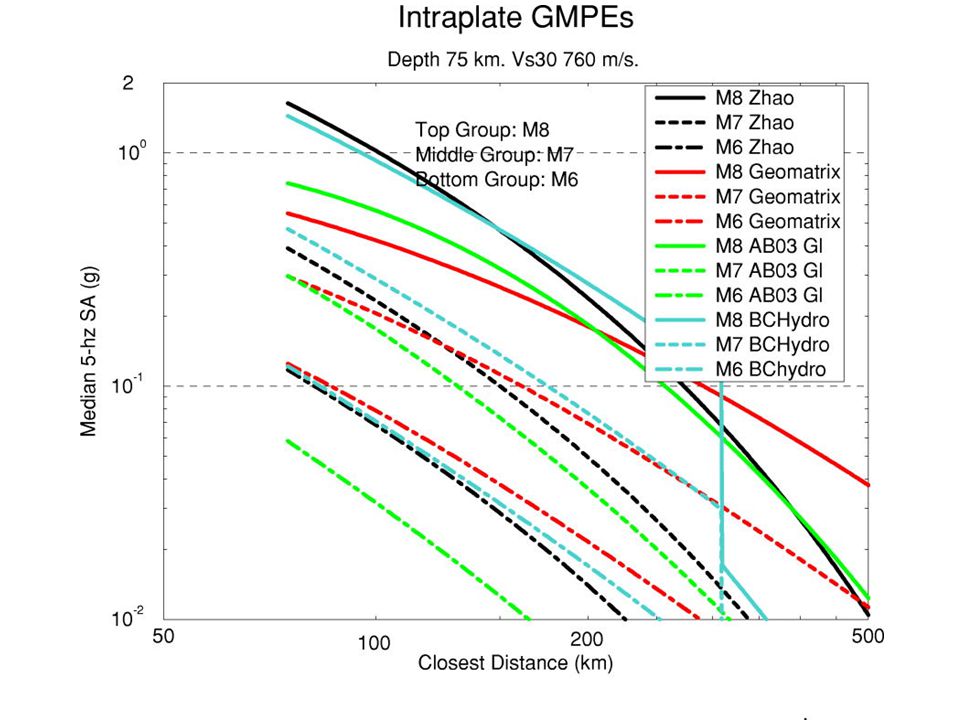
Intraplate earthquakes by depth (1 s and 0.2 s SA)
")
19
Ground motions for Shallow crustal earthquakes (1 s and 0.2 s SA) For M 8 crustal earthquakes Zhao is highest (less gm saturation with M) For M 6 crustal earthquakes Zhao is lowest In 2011 paper Zhao et al. suggests more magnitude saturation for M 7+ earthquakes.

20
Zhao et al. (2006) crustal, inslab, and interface earthquake ground motions Inslab earthquakes cause high gm Guam ground motions are dominated by Intraslab ground motions American Samoa ground motions are dominated by crustal sources
 crustal, inslab, and interface earthquake ground motions Inslab earthquakes cause high gm Guam ground motions are dominated by Intraslab ground motions American Samoa ground motions are dominated by crustal sources.")
21
Oceanic data by distance and depth Red – interface, blue – intraplate

22
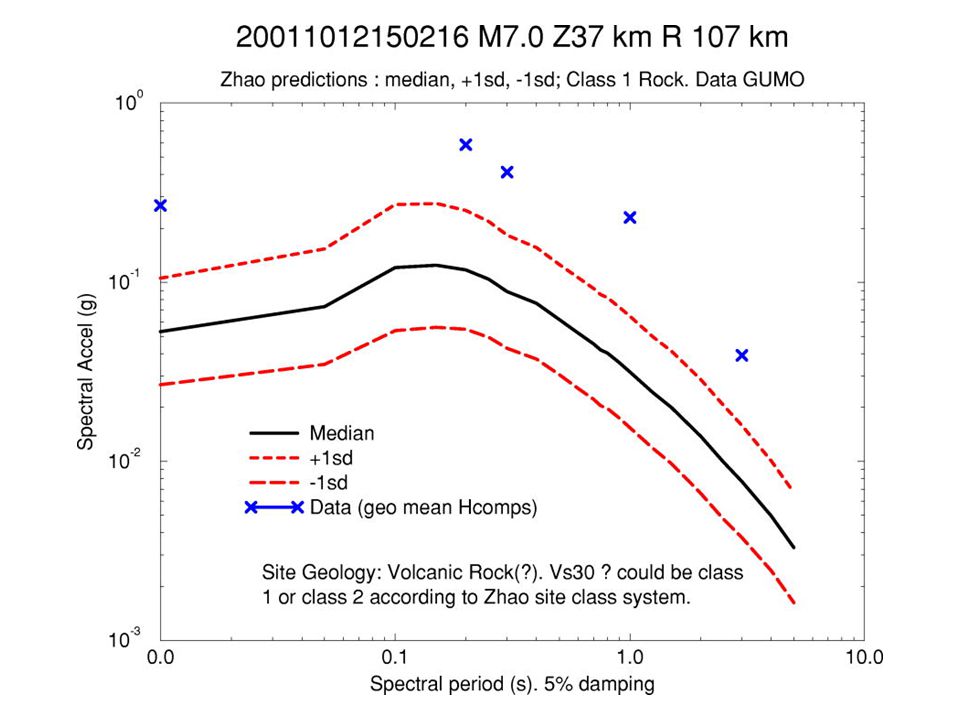
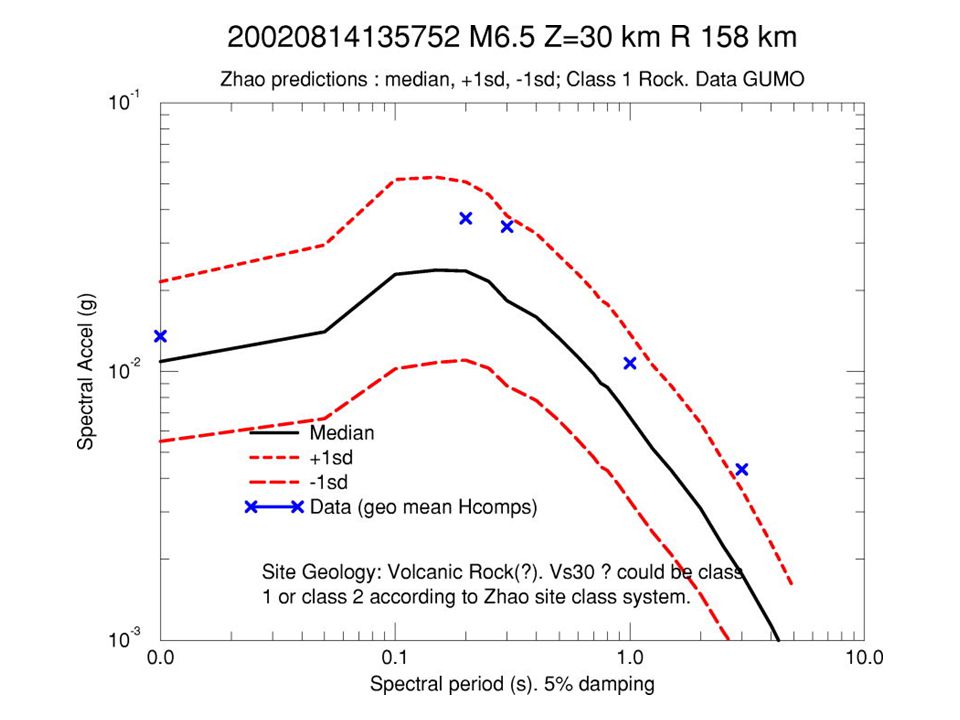
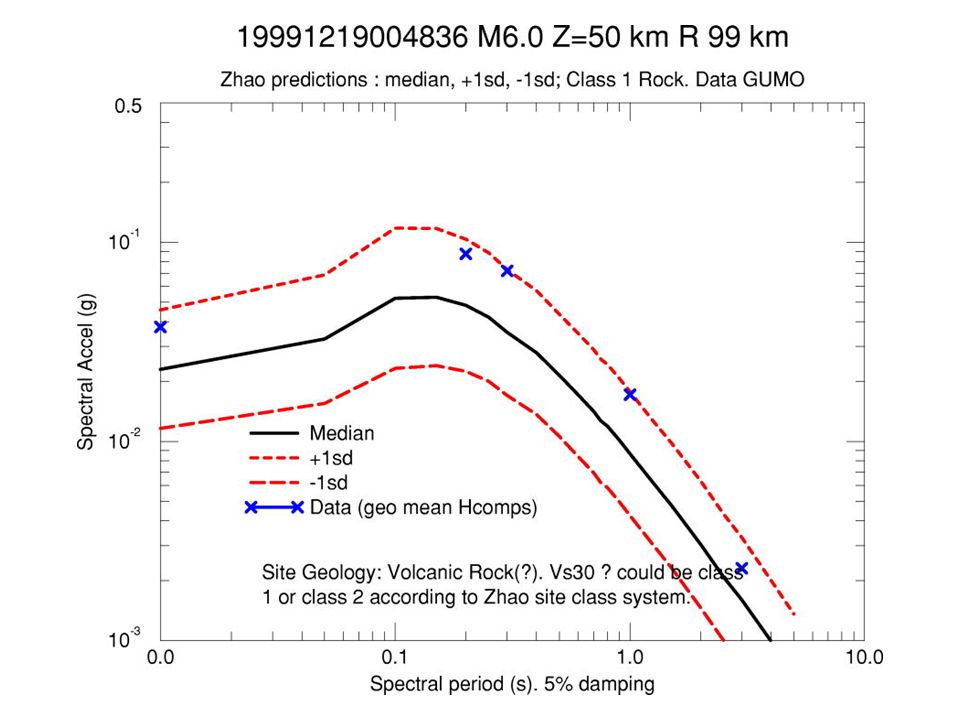
Zhao et al. (2006) model with Pacific strong ground motion data ( 1 s and PGA)
 model with Pacific strong ground motion data ( 1 s and PGA)")
23
PGA station residuals after subtracting station term and systematic offsetStation residuals Residuals = data-prediction

24
PGA average single station residuals by magnitude and distance Residuals = data-prediction

25
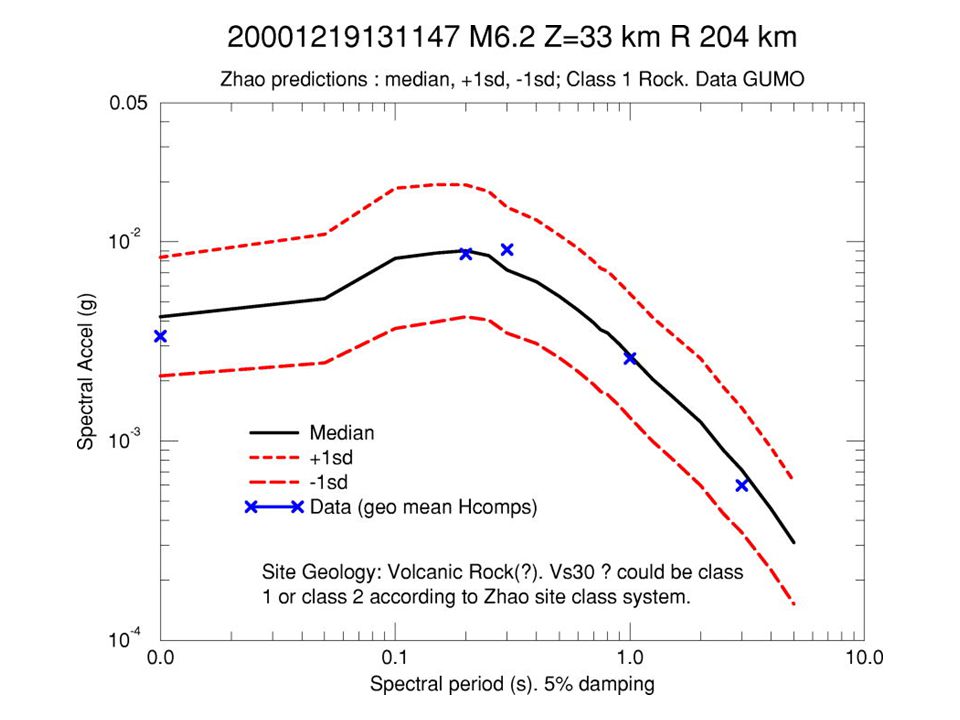
Comparison of Guam data and Zhao

33
PGA5HZ1HZ ZHAO -0.05420.07770.2018 Systematic offset of Pacific data with Zhao et al. (2006) model Total Sigma, distance ≤ 300 km, M ≥ 6.0 Zhao and others (2006)Geomatrix Atkinson and Boore (2003) PGA 0.92970.96851.1587 5HZ.97091.03421.0194 1HZ.7024.7434.7554
 model Total Sigma, distance ≤ 300 km, M ≥ 6.0 Zhao and others (2006)Geomatrix Atkinson and Boore (2003) PGA HZ HZ")
34
Source Model (depth) Calculate d b-value b-value standar d deviatio n Maximum recorded magnitude since 1900 Maximum recorded magnitud e since 1964 Maximum magnitude for calculations Rate of M≥7 s inc e 1900 Type of source S=smoot h F=fault Model source depth (km) Ground motion models Tonga Outer Rise (0–50 km) 0.990.078.28.1 (8.0*) 8.2S10Crustal Zhao and NGA New Hebrides Outer Rise (0–50 km) 1.110.107.7 8.2S10Crustal Zhao and NGA Tonga Subduction Zone interface (0–50 km) 0.870.038.57.9 (8.0*) 7.0 (see interface zone below) S10Crustal Zhao and NGA New Hebrides Subduction Zone Interface (0–50 km) 0.580.047.97.87.0 (see interface zone below) S10Crustal Zhao and NGA Fiji zone (0–50 km)0.860.037.87.78.0S10Crustal Zhao and NGA Background (elsewhere; 0–50 km) 1.010.077.1 7.3S10Crustal Zhao and NGA Background (50–100 km)0.930.058.28.18.2S75Intraslab Background (100–200 km) 0.890.047.8 8.0S150Intraslab Background (200–300 km) 0.950.057.97.18.0S250Intraslab Background (300–400 km) 0.970.078.07.28.0S350Intraslab Background (400–500 km) 1.160.097.57.38.0S450Intraslab Background (500–600 km) 0.870.057.87.68.0S550Intraslab Background (600–723 km) 0.870.077.7 8.0S650Intraslab Tonga Subduction Zone Interface (0–50 km) M7–M9, 1900–2010 0.87 (fixed)* * 8.57.9 (8.0(fix ed)* ) 8.5, 9.022 events / 110 years FH=25, top of zone is 10 km Inter-face New Hebrides Subduction Zone Interface (0–50 km) M7–M9, 1900–2010 1.0 (fixed)* * 7.97.88.5, 9.032 events / 110 years FH=25, top of zone is 10 km Inter-face
 Calculate d b-value b-value standar d deviatio n Maximum recorded magnitude since 1900 Maximum recorded magnitud e since 1964 Maximum magnitude for calculations Rate of M≥7 s inc e 1900 Type of source S=smoot h F=fault Model source depth (km) Ground motion models Tonga Outer Rise (0–50 km) (8.0*) 8.2S10Crustal Zhao and NGA New Hebrides Outer Rise (0–50 km) S10Crustal Zhao and NGA Tonga Subduction Zone interface (0–50 km) (8.0*) 7.0 (see interface zone below) S10Crustal Zhao and NGA New Hebrides Subduction Zone Interface (0–50 km) (see interface zone below) S10Crustal Zhao and NGA Fiji zone (0–50 km) S10Crustal Zhao and NGA Background (elsewhere; 0–50 km) S10Crustal Zhao and NGA Background (50–100 km) S75Intraslab Background (100–200 km) S150Intraslab Background (200–300 km) S250Intraslab Background (300–400 km) S350Intraslab Background (400–500 km) S450Intraslab Background (500–600 km) S550Intraslab Background (600–723 km) S650Intraslab Tonga Subduction Zone Interface (0–50 km) M7–M9, 1900– (fixed)* * (8.0(fix ed)* ) 8.5, events / 110 years FH=25, top of zone is 10 km Inter-face New Hebrides Subduction Zone Interface (0–50 km) M7–M9, 1900– (fixed)* * , events / 110 years FH=25, top of zone is 10 km Inter-face")
35
Model and Results

36
Logic tree In zones that include subduction zones, we use 30 percent strike-slip and 70 percent reverse in the ground-motion models. In all other zones, we use half strike-slip and half normal faulting mechanisms in the ground-motion models,

37
Hazard from subduction zones and seismicity ( 1 s SA)
")
38
Sensitivity

43
Maps and deaggregations

44
Seismic hazard map (10% PE of exceedance in 50 years for 1 s SA)
")
45
Seismic hazard map (2% PE of exceedance in 50 years for 1 s SA)
")
46
Seismic hazard map (10% PE of exceedance in 50 years for 0.2 s SA)
")
47
Seismic hazard map (2% PE of exceedance in 50 years for 0.2 s SA)
")
48
Deterministic analysis

49
Deaggregation for Pago Pago Contribution to hazard is shown by the height from one color to the next color.

52
Geographic deaggregation ( 1 s top, 0.2 s bottom)
")
53
Conclusions Model seismicity rates defined by historic seismicity We don’t know of any crustal faults on or near American Samoa For Pago Pago outer rise earthquakes and subduction interface earthquakes dominate hazard For Pago Pago crustal GMPE’s are the most important For Pago Pago we apply equally weighted Zhao et al. (2006, class 1-rock of about 600 m/s) and 3 NGA equations (NEHRP B/C, Vs30=760) Even though the ground motions are half the current IBC, we feel that the model for Pago Pago includes plausible sources and ground motion models and represents a reasonable estimate of the hazard
 and 3 NGA equations (NEHRP B/C, Vs30=760) Even though the ground motions are half the current IBC, we feel that the model for Pago Pago includes plausible sources and ground motion models and represents a reasonable estimate of the hazard.")
Similar presentations


 was felt strongly on nearby Adak Island about 94 km west-northwest of the epicenter. No tsunami warnings were issued.>")
 catalog statistics – extreme occurrences seismogenic feature:>")


 and a tsunami warning was.>")


 earthquake near Sendai, east coast of Honshu, Japan Friday, March 11, 2011 at 05:46:23 UTC Japan was struck by a magnitude 8.9 (9.0)>")


 4.Driving forces of plate tectonics.>")

>")


, Norsang Gelsor 1) and Jens Havskov 2) 1) Jiangsu Road No 36 Lhasa, Tibet, PRC 2) University of Bergen, Department.>")