Download presentation
Presentation is loading. Please wait.

1
Ecological Footprint

2
Human Population Growth and Natural Resources Why does the human population keep growing? (Sanitation, Agriculture, Medicine) According to this chart, when will humans reach carrying capacity? When the slope of the line = 0 This is completely hypothetical. Carrying capacity could be 10, 20, or even 50 billion. In fact maybe we already passed it!
 According to this chart, when will humans reach carrying capacity. When the slope of the line = 0 This is completely hypothetical. Carrying capacity could be 10, 20, or even 50 billion. In fact maybe we already passed it!.")
3
Ecological Footprint The ecological footprint is a measure of the land area in the same vicinity as the population, required to provide the resources and absorb the wastes of a population. It is able to provide a quantitative estimate of human carrying capacity. It is the inverse of carrying capacity It refers to the area required to sustainably support a given population rather than the population that a given area can sustainably support.

4
Calculations The accurate calculation of an ecological footprint is very complex, but an approximation can be achieved using the following equations: Per capita land requirement = per capita consumption (kg y -1 ) for food production (ha) mean food production per hectare of local arable land (kg ha -1 yr -1 ) - Per capita land requirement = per capita CO 2 emission (kg C yr -1 ) for absorbing waste CO 2 net carbon fixation per hectare of from fossil fuels (ha) local natural vegetation (kg C ha -1 yr -1 )
 for food production (ha) mean food production per hectare of local arable land (kg ha -1 yr -1 ) - Per capita land requirement = per capita CO 2 emission (kg C yr -1 ) for absorbing waste CO 2 net carbon fixation per hectare of from fossil fuels (ha) local natural vegetation (kg C ha -1 yr -1 )")
5
Per Capita What does per capita mean? The average per person

6
Calculations What resources are missing in these calculations? In other words, is carbon the only waste we generate? Do we use land only for food production? These calculations assume that you know your per capita food consumption per year and how much carbon dioxide emission you give off per year.

7
Calculations Homework: go home tonight and calculate your ecological footprint using the Earth Day Footprint Quiz at www. earthday.net/footprint2/index.html or simply search for Earth Day Footprint Quiz. Enter DETAILED information Write down your # and WHY your number is so high (or so low).
..")
8
LEDCs vs. MEDCs Most of the more-developed countries of the world have a much larger ecological footprint than is represented by their land area. Examples: Japan is highly developed but has few resources; its ecological footprint is 5 times larger than its locally available resources. The ecological footprint of the U.S. is 1.5 times locally available resources. This does not mean that we do not have a large footprint. It merely implies that the U.S. is rich in resources.

9
LEDCs vs. MEDCs MEDCs consume about twice as much energy in the diet because they eat a meat rich diet. Remember it is more efficient to directly eat the grain rather than to indirectly eat it through meat. MEDCs are more dependent on fossil fuels. Results in higher carbon dioxide emissions

10
Ecological Footprint can be 20 to 40 times higher in MEDCs.

11
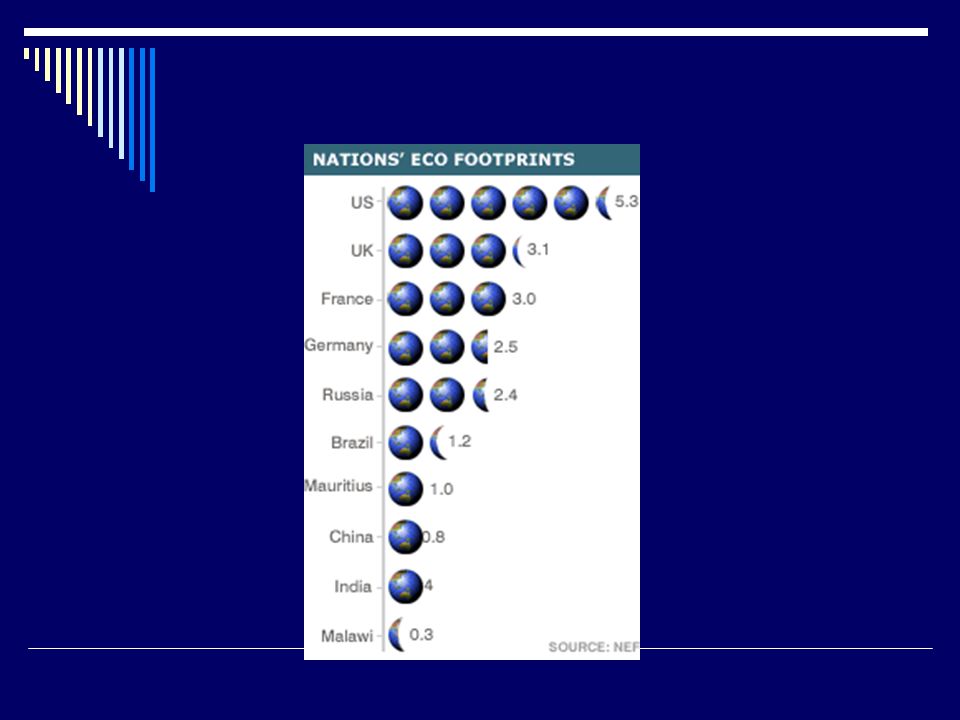
Ecological Footprint

13
The average American’s ecological footprint is around 9.7 hectares. (1 hectare = 10,000 square meters) That’s larger than 24 football fields. We may have a large footprint, but other countries have many more “feet”. US population: 301,140,000 China: 1,321,852,000 India: 1,129,866,000
 That’s larger than 24 football fields. We may have a large footprint, but other countries have many more feet . US population: 301,140,000 China: 1,321,852,000 India: 1,129,866,000.")
14
Biocapacity The same methodology can be used to calculate, in the same units, the Earth’s biocapacity its biologically productive area. Currently, the biocapacity of the Earth is around 11.2 billion hectares in 2001 (assuming that no capacity is set aside for non-human species). In 2001, humanity’s demand on the biosphere its global ecological footprint was 13.7 billion global hectares. At present, therefore, our Footprint exceeds our biocapacity by 0.4 global hectares per person, or 23 %. This means that the planet’s living stocks are being depleted faster than nature can regenerate them.
. In 2001, humanity’s demand on the biosphere its global ecological footprint was 13.7 billion global hectares. At present, therefore, our Footprint exceeds our biocapacity by 0.4 global hectares per person, or 23 %. This means that the planet’s living stocks are being depleted faster than nature can regenerate them..")
15
Biocapacity and Carrying Capacity Biocapacity and carrying capacity go hand in hand. Biocapacity deals with the living aspect of carrying capacity

16
Technocentrism Many people feel that human carrying capacity can be expanded continuously through technological innovation. Example: If we learn to use energy and material twice as efficiently, we can double the population size However, to compensate for foreseeable population growth and economic growth, efficiency would have to be raised by a factor of 4 – 10 to remain within global carrying capacity.

17
Business as Usual

18
Slow Shift

19
Rapid Reduction

Similar presentations


 that would be required to sustainably provide for a specific population’s resources and assimilate its.>")


 provide all.>")


