Download presentation
Presentation is loading. Please wait.

2
SE Asia is more urbanized than the figures show Where do the urban populations live? Giant cities? Intermediate cities? Small towns? Analysis of mega-urban region dynamics Development of mega-urban corridors Are SE Asian cities distinctive? Or is a Los Angelization” taking place? How are cities viewed by governments in power?

3
198019902000201020202030 Indonesia22.130.642.049.0 (44.3)(48.1)(53.7) Malaysia42.049.862.072.278.582.2 Thailand26.829.431.134.038.945.8 Philippines37.548.648.048.952.658.3 Vietnam19.220.324.530.437.044.2 Myanmar24.024.727.833.640.748.1 Cambodia 9.012.616.920.123.829.2 Laos12.415.422.033.244.253.1 SE ASIA25.531.638.241.846.752.9 Source : UN Population Division, 2011. The Indonesian figures for 2010, 2020 and 2030 are in brackets because they are clearly too low compared with the measured 2010 figure of 49.0.

4
<500,000 500,000 to 1 million 1 to 5 million 5 to 10 million >10 million 197549132585 2000501123610 2015481023811 Source: Zlotnik, 2004

5
SIZE GROUP1970198019902000201020202025 MALAYSIA 5+million 0 0 0 0 0 0 0 1-5 million 0 0 12 9 13 18 500,000-1 million 0 16 0 12 17 16 <500,000100 84 88 78 70 65 66 All sizes100 INDONESIA 5+million 0 18 15 10 9 8 8 1-5 million 33 18 16 12 11 500,000-1 million 9 8 6 5 5 6 6 <500,000 58 56 63 73 74 75 All sizes100 Source: Calculated from UN Population Division, 2011.

7
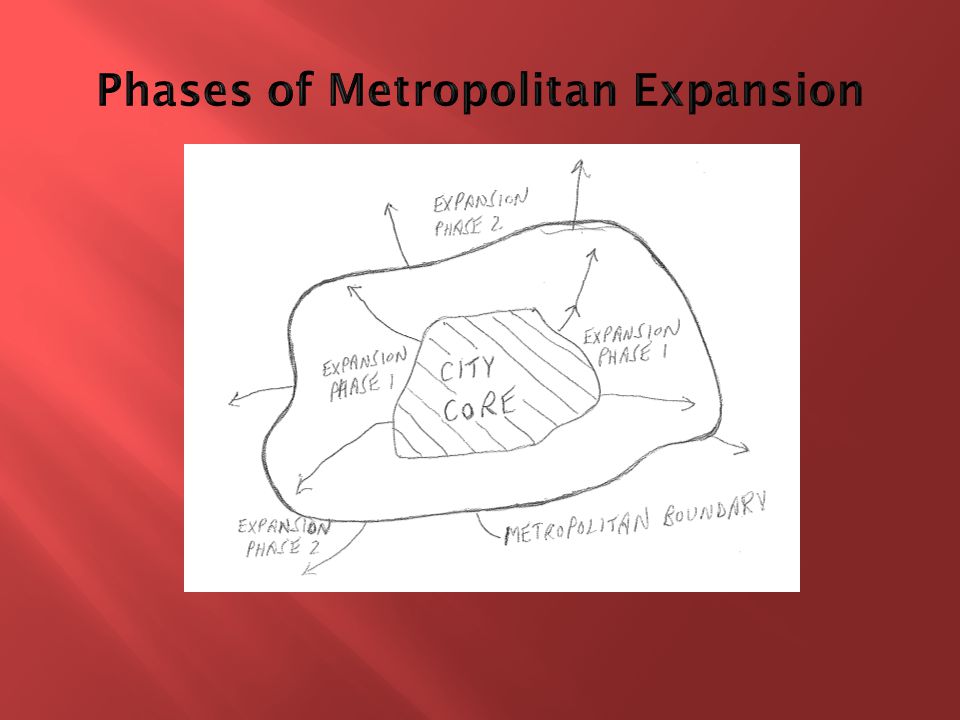
Area (sq. km) PopulationDensity (per sq. km.) Population growth rate (av. ann.) 1990-2000 1990200019902000 JAKARTA Core 662 8,223 8,34712,42112,6100.2 Inner zone2,374 5,434 9,435 2,289 3,9755.7 Outer zone3,139 3,442 3,407 1,097 1,085-0.1 Total6,17517,09821,190 2,769 3,4322.1 Indonesia1.5 BANGKOK Core 8765,445 5,876 6,215 6,7090.8 Inner zone1,9071,596 2,380 837 1,2484.1 Outer zone4,4651,593 2,163 348 4723.1 Total7,2488,63410,419 1,172 1,4141.9 Thailand1.4 MANILA Core 633 7,907 9,88012,55115,6422.3 Inner zone3,105 4,183 6,365 1,345 2,0474.3 Outer zone8,323 3,819 5,368 461 6483.5 Total12,06115,90921,613 1,324 1,6413.1 Philippines2.1 HO CHI MINH Core 170 2,3203,20313,64718,8413.8 Inner zone 617 9041,078 1,465 1,7471.9 Outer zone1,308 700 756 535 5780.8 Total2,095 3,9245,037 1,873 2,4042.8 Vietnam1.7 SHANGHAI Core 605 8,027 9,93413,26716,4152.1 Inner zone1,753 2,207 3,292 1,259 1,8714.0 Outer zone3,944 3,108 3,182 788 8080.2 Total6,30213,34216,408 2,117 2,6032.0 China1.1 TAIPEI Core 272 2,7302,62410,0479,655-0.4 Inner zone 890 3,9934,923 4,4865,5321.9 Outer zone2,516 733 995 291 3952.6 Total3, 678 7,4568,542 2,0272,3221.3 Taiwan0.9 Note: Ho Chi Minh City populations are for 1989 and 1999. Source: Jones and Douglass (eds), 2008, Table 3.1.
 JAKARTA Core 662 8,223 8,34712,42112, Inner zone2,374 5,434 9,435 2,289 3, Outer zone3,139 3,442 3,407 1,097 1, Total6,17517,09821,190 2,769 3, Indonesia1.5 BANGKOK Core 8765,445 5,876 6,215 6, Inner zone1,9071,596 2, , Outer zone4,4651,593 2, Total7,2488,63410,419 1,172 1, Thailand1.4 MANILA Core 633 7,907 9,88012,55115, Inner zone3,105 4,183 6,365 1,345 2, Outer zone8,323 3,819 5, Total12,06115,90921,613 1,324 1, Philippines2.1 HO CHI MINH Core 170 2,3203,20313,64718, Inner zone ,078 1,465 1, Outer zone1, Total2,095 3,9245,037 1,873 2, Vietnam1.7 SHANGHAI Core 605 8,027 9,93413,26716, Inner zone1,753 2,207 3,292 1,259 1, Outer zone3,944 3,108 3, Total6,30213,34216,408 2,117 2, China1.1 TAIPEI Core 272 2,7302,62410,0479, Inner zone 890 3,9934,923 4,4865, Outer zone2, Total3, 678 7,4568,542 2,0272, Taiwan0.9 Note: Ho Chi Minh City populations are for 1989 and Source: Jones and Douglass (eds), 2008, Table")
8
JakartaBangkokManilaHCMCShanghaiTaipei % outside core 1990 51.936.950.340.939.863.4 % growth outside core 1990-2000 97.075.965.420.737.8109.8 % outside core 2000 60.643.654.336.439.569.3 Source: Jones and Douglass (eds), 2008, Table 3.2
, 2008, Table 3.2")
9
JakartaBangkokManilaHCMCShanghaiTaipei 19909.415.826.15.91.237.5 200010.016.628.66.41.339.1 Source: Jones and Douglass, 2008, Table 3.3.

10
Population – core plus inner zone Growth rate (av. ann. -%) City19902000 Core plus inner zone Total Mega Urban Region Whole Country Urban * Jakarta13,65717,7822.72.11.54.2 Bangkok7,0418,2561.61.91.42.5 Manila12,09016,2453.03.12.12.5 HCMC3,2244,2813.02.81.74.1 Shanghai10,23413,2262.52.01.14.3 Taipei6,7237,5471.21.30.9 * Including non-urban parts of the MUR Source: Jones and Douglass, 2008, Table 3.4
 City Core plus inner zone Total Mega Urban Region Whole Country Urban * Jakarta13,65717, Bangkok7,0418, Manila12,09016, HCMC3,2244, Shanghai10,23413, Taipei6,7237, * Including non-urban parts of the MUR Source: Jones and Douglass, 2008, Table 3.4.")
11
Mega- urban region Core Density of inner zone Density of outer zone Density of entire MUR Populati on (‘000) Area (sq. km.) Density Mumbai*11,97060319,7588,2501,0714,549 Jakarta 8,34766212,6103,9751,0853,432 Manila 9,88063315,6422,047 6481,641 Bangkok 5,876876 6,7091,248 4721,414 Shanghai 9,93460516,4151,871 8082,603 Data for 2001 Source: For Jakarta, Bangkok, Manila and Shanghai, Jones, 2008, Table 3.1. For Mumbai, Bhagat and Jones, 2013, Tables 1 and 4. Inner zone includes: for Mumbai, the Municipal Corporation of Greater Mumbai (MCGM); for Jakarta, the DKI Jakarta; for Bangkok, most of the Bangkok Metropolitan Administration (BMA) plus part of Nonthaburi Province; for Manila, Metro Manila; for Shanghai, Districts 1-9, plus densely settled parts of surrounding districts contiguous to the nine districts.
 Density Mumbai*11, ,7588,2501,0714,549 Jakarta 8, ,6103,9751,0853,432 Manila 9, ,6422, ,641 Bangkok 5, ,7091, ,414 Shanghai 9, ,4151, ,603 Data for 2001 Source: For Jakarta, Bangkok, Manila and Shanghai, Jones, 2008, Table 3.1. For Mumbai, Bhagat and Jones, 2013, Tables 1 and 4. Inner zone includes: for Mumbai, the Municipal Corporation of Greater Mumbai (MCGM); for Jakarta, the DKI Jakarta; for Bangkok, most of the Bangkok Metropolitan Administration (BMA) plus part of Nonthaburi Province; for Manila, Metro Manila; for Shanghai, Districts 1-9, plus densely settled parts of surrounding districts contiguous to the nine districts..")
12
Number of votersBarisan NasionalPakatan RakyatTotal 50,000 and below43144 50,000 to 65,000241438 65,000 to 80,00092534 More than 80,000104050 Source: Adapted from Lee, 2013, Table 6.

13
JakartaBangkokManilaHCMCShanghaiTaipei Core Inner zone Outer zone Mega urban region Negative 60.9 Negative 16.2 3 71 62 52 19 54 42 38 n.a. 46.3 11.4 94.7 62.4 104.4 Negative 31.9 40.7 n.a. Source: Jones and Douglass, 2008, Table 3.5

Similar presentations


 Mexico (1,964) > Indonesia (1,905) Myanmar (677) > France (643) Thailand (513) > Spain (505) Vietnam.>")


 USA 3.8 billion 455 million 290.5 million 42.35m s.km 3.89m sk.m 9.16m s.km US$4,969.>")
 USA 3,800 million455 million291 million 42 million km²4 million km²9 million km² US$ 4,969US$ 23,600US$ 36,300.>")


