Download presentation
Presentation is loading. Please wait.

1
Addressing Inequalities in Health and Wellbeing at Population Level
HINST Associates Addressing Inequalities in Health and Wellbeing at Population Level Professor Chris Bentley

2
Well being and Health Physiological risks High blood pressure High cholesterol Stress hormones Anxiety/depression Behavioural risks Smoking Poor diet Lack of activity Substance abuse Psycho-social risks: Isolation Lack of social support Poor social networks Low self-esteem High self-blame Low perceived power Loss of meaning/purpose of life Risk conditions – e.g.: Poverty Low social status Poor educational attainment Unemployment Dangerous environments Discrimination Steep power hierarchy Gaps/weaknesses in services and support Health Seeking Behaviour After Ronald Labonte

3
Strengthen the role and impact of ill-health prevention.
Marmot ‘Plus’ policy Objectives Healthcare Public Health Enable all children, young people & adults to maximise their capabilities & control their lives. Create and develop healthy and environment-ally sustainable places & communities. Ensure healthy standard of living for all. Create fair employment & decent work for all. Give every child the best start in life. Strengthen the role and impact of ill-health prevention.

4
Different Gestation Times for Interventions
Health Inequalities Different Gestation Times for Interventions For example intervening to reduce risk of mortality in people with established disease such as CVD, cancer, diabetes A For example intervening through lifestyle and behavioural change such as stopping smoking, reducing alcohol related harm and weight management to reduce mortality in the medium term B This slide illustrates the timescales of impact of various interventions. While many of the recommendations made during the NST visit concentrate on interventions which could have an effect on life expectancy in the next three years (A) up to 2010 in accordance with the PSA life expectancy target , other interventions take longer and should continue alongside the interventions (such as work on obesity) which will have a longer term effect For example intervening to modify the social determinants of health such as worklessness, poor housing, poverty and poor education attainment to impact on mortality in the long term C 2005 2010 2015 2020 4
 up to 2010 in accordance with the PSA life expectancy target , other interventions take longer and should continue alongside the interventions (such as work on obesity) which will have a longer term effect. For example intervening to modify the social determinants of health such as worklessness, poor housing, poverty and poor education attainment to impact on mortality in the long term. C")
6
Haringey: Slope Index of Inequality (Males)
")
7
Index of Multiple Deprivation (IMD)
Haringey Index of Multiple Deprivation (IMD) % of residents from each English quintile
 % of residents from each English quintile.")
8
Haringey: Slope Index of Inequality (Males)
")
9
Slope Index of Inequality - Redcar and Cleveland
(males)
")
10
Index of Multiple Deprivation (IMD)
Maidstone Index of Multiple Deprivation (IMD) % of residents from each English quintile
 % of residents from each English quintile.")
11
Maidstone – slope index (males)
")
12
Number of chronic disorders by age group
Barnett, K et al. 2012

13
Multi-morbidity – the existence of several chronic health disorders in one individual – is a critical and increasing challenge for health and social services. The prevalence of this problem increases with deprivation; people in deprived circumstances having the same prevalence of multi-morbidity as more affluent patients who were 10 – 15 years older (Barnett, 2012).
.")
14
The relationship between multiple lifestyle risks and mortality
Buck, D; Frosini, F; 2012

15
Distribution of multiple risk behaviours
Looking at combination of 4 key risk behaviours in 2008, i.e.: Smoking; Excessive use of alcohol; Fruit and vegetable consumption; Physical exercise Unskilled manual labour 3 times more likely to have all 4 risk behaviours than professionals People with no qualifications 5 times more likely to have all 4 risk behaviours than those with high level qualifications King’s Fund 2012

16
Reduce health inequalities and improve health and wellbeing for all
Policy Goals Create an enabling society that maximises individual and community potential. Ensure social justice, health and sustainability are at heart of policies. Policy objectives Give every child the best start in life. Create fair employ-ment & decent work for all. Create and develop healthy and environment-ally sustainable places & communities. Strengthen the role and impact of ill-health prevention. Enable all children, young people & adults to maximise their capabilities & control their lives. Ensure healthy standard of living for all. Policy mechanisms Equality & health equity in all policies. Effective evidence-based delivery systems.

17
Inequality in Early Cognitive Development of British Children in the 1970 Cohort, 22 months to 10 years High SES Low SES High Q at 22m Inequality in the Early Cognitive Development of British Children in the 1970 Cohort Author(s): Leon Feinstein Source: Economica, New Series, Vol. 70, No. 277 (Feb., 2003), pp The definition of SES categories is as for Figure 1 with medium SES children omitted. Children in the 2nd and 3rd quartile at 22 months are also omitted. Standard error intervals are not shown to ease clarity of exposition. Important details of significant differences are given in the text. Low Q at 22m Source: Feinstein, L. (2003) ‘Inequality in the Early Cognitive Development of British Children in the 1970 Cohort’, Economica (70) 277, 73-97 17
: Leon Feinstein Source: Economica, New Series, Vol. 70, No. 277 (Feb., 2003), pp The definition of SES categories is as for Figure 1 with medium SES children omitted. Children in the 2nd and 3rd quartile at 22 months are also omitted. Standard error intervals are not shown to ease clarity of exposition. Important details of significant differences are given in the text. Low Q at 22m. Source: Feinstein, L. (2003) ‘Inequality in the Early Cognitive Development of British Children in the 1970 Cohort’, Economica (70) 277,")
18
`Sensitive periods’ in early brain development
The Council for Early Child Development - Putting Science into Action for Children “Pre-school” years School years High `Numbers’ Peer social skills Sensitivity Conceptualization Language Habitual ways of responding Emotional control Children’s early experiences have far-reaching and solidifying effects on the development of their brains and behaviours. This diagram indicates the most sensitive periods of brain development, the foundation for cognitive learning, emotional and social skills, language and expression are laid before children begin formal schooling. We know there are critical periods of development. For example: Children born with cataracts who don’t have them removed shortly after birth will never have normal sight – the critical period for vision development will have been missed. Children born deaf will unlikely have the same language skills as a child who becomes deaf later in early childhood. The child born deaf will miss the sensitive period of language development. Children exposed to more than one language before the age of 7 months will be able to speak both languages as first languages and more easily acquire additional languages. We know that when we learn a second language later in life we learn it in the memory, rather than the language part of our brain. Our physiology will be unable to form certain sounds and we will likely always have an accent. Children who do not have regular contact with other young children before 4 years old will have underdeveloped social-emotional skills. Trajectories for children with developmental vulnerabilities can be changed but the major effort has to be made in the early years when neural systems are most plastic and compromises or constrictions are most readily overcome. Later interventions are more difficult and less effective. ‘Sensitive periods’ in early brain development – this slide is based on the following references: Doherty, G. (1997). Zero to Six: the Basis for School Readiness. Applied Research Branch R-97-3E Ottawa: Human Resources Development Canada. McCain & Mustard (1999). Early Years Study. Toronto, Ontario: Publications Ontario. Shonkoff, Jack (Ed) (2000). From Neurons to Neighborhoods: The Science of Early Childhood Development. Washington, D.C.: National Academy Press. Vision Hearing Low 1 2 3 4 5 6 7 Years Graph developed by Council for Early Child Development (ref: Nash, 1997; Early Years Study, 1999; Shonkoff, 2000.) Created: August 24, 2005
. Zero to Six: the Basis for School Readiness. Applied Research Branch R-97-3E Ottawa: Human Resources Development Canada. McCain & Mustard (1999). Early Years Study. Toronto, Ontario: Publications Ontario. Shonkoff, Jack (Ed) (2000). From Neurons to Neighborhoods: The Science of Early Childhood Development. Washington, D.C.: National Academy Press. Vision. Hearing. Low Years. Graph developed by Council for Early Child Development (ref: Nash, 1997; Early Years Study, 1999; Shonkoff, 2000.) Created: August 24,")
19
Per cent achieving 5+ A* - C grades inc Maths and English at GCSE by IDACI decile of pupil residence: England 2007 % achieving 5+ A*-C GCSEs inc Maths and English Deprivation and Education DCSF 2009; accessed 13th July 2009 From table – Figure 4-4 on page 31 Most deprived Income Deprivation Affecting Children Index (IDACI) Least deprived Source: DCFS 2009
 Least. deprived. Source: DCFS")
20
Health inequalities in Scotland
Outcome Most deprived Least deprived Smoking during pregnancy¹ 38% 13% Stillbirth 5.9/1000 live births 3.8/1000 live births 46 m Language development concerns² 26% 12% Behaviour to other children 24% 10% Total difficulties (on SDQ) 20% 7% Dental caries age 5 years³ (odds) 4.6 1 Teenage pregnancy⁴ 3 x higher Death in year olds⁵ 5 x higher 45-74 year olds Death due to CHD 3.8 x more likely Death due to cancer 2.3 x more likely Alcohol deaths 12.3 x more likely Under-75 year old deaths 3.6 x more likely Sources : 1. Gray R, Bonellie SR, Chalmers J, Greer I, Jarvis S, Kurinczuk JJ, et al Scottish Government. Growing Up in Scotland: Health inequalities in the early years Levin KA, Davies CA, Topping GV, Assaf AV, Pitts NB Scottish Government 2003. 5. Scottish Government Health Analytical Services Division 2008.
 20% 7% Dental caries age 5 years³ (odds) Teenage pregnancy⁴. 3 x higher. Death in year olds⁵. 5 x higher year. olds. Death due to CHD. 3.8 x more likely. Death due to cancer. 2.3 x more likely. Alcohol deaths x more likely. Under-75 year old deaths. 3.6 x more likely. Sources : 1. Gray R, Bonellie SR, Chalmers J, Greer I, Jarvis S, Kurinczuk JJ, et al Scottish Government. Growing Up in Scotland: Health inequalities in the early years Levin KA, Davies CA, Topping GV, Assaf AV, Pitts NB Scottish Government Scottish Government Health Analytical Services Division")
21
Child wellbeing in Better-off Countries (UNICEF Review 2007)
")
22
Maidstone - Neighbourhood (LSOA) deprivation scores (decile – 10%)
(10) (9)
 (9)")
25
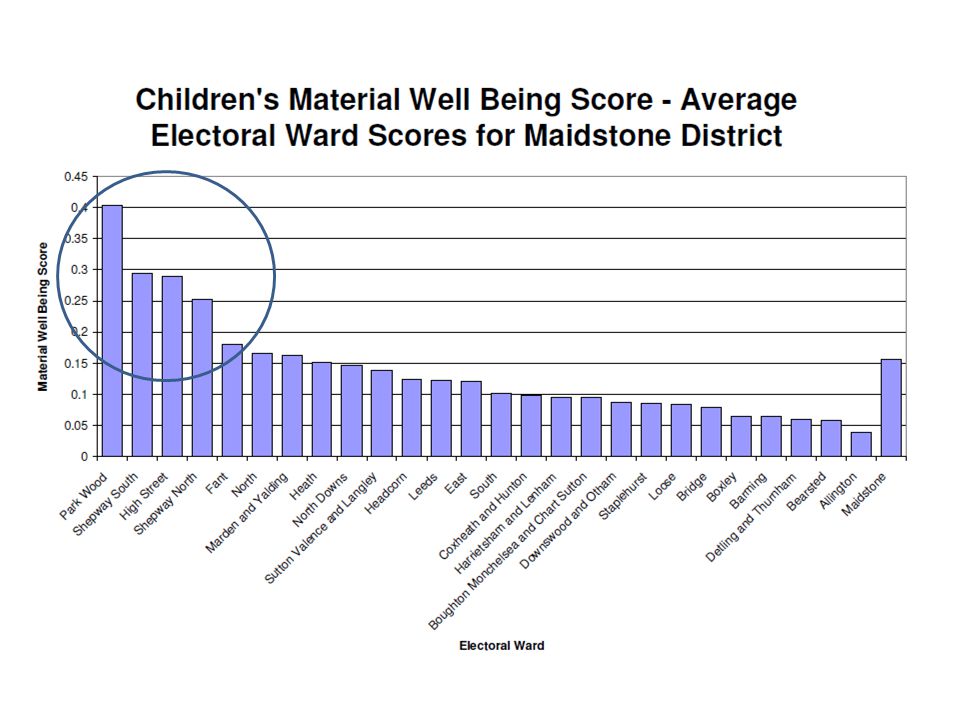
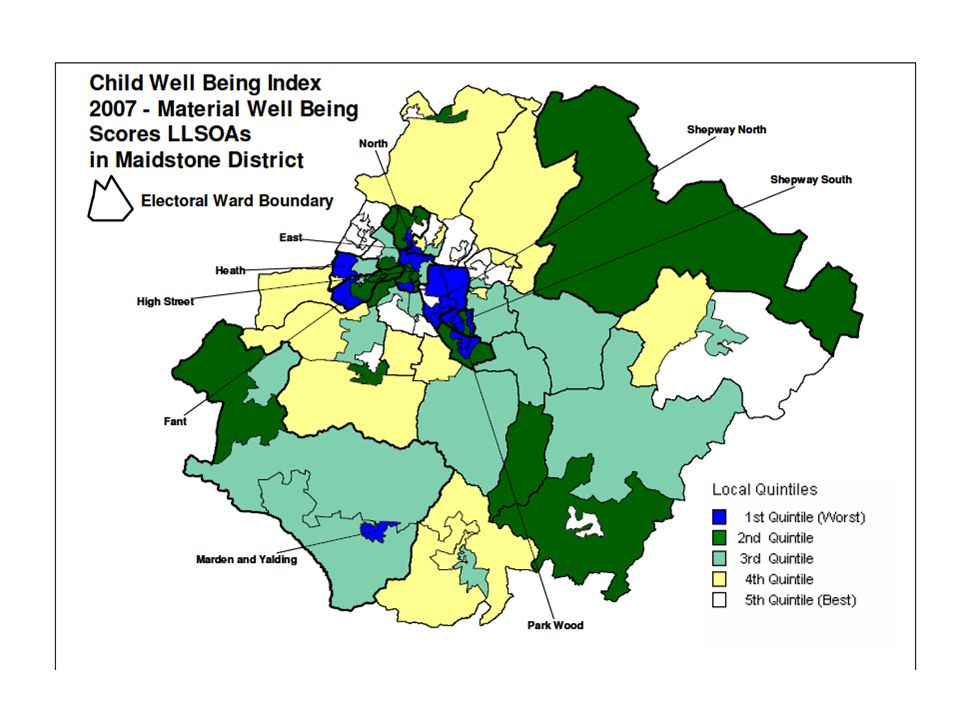
Local index of child wellbeing material wellbeing domain

27
Local index of child wellbeing education domain

28
Literacy and numeracy in the UK
Moser Report 1999 Skills for Life Survey 2011 (BIS)
")
30
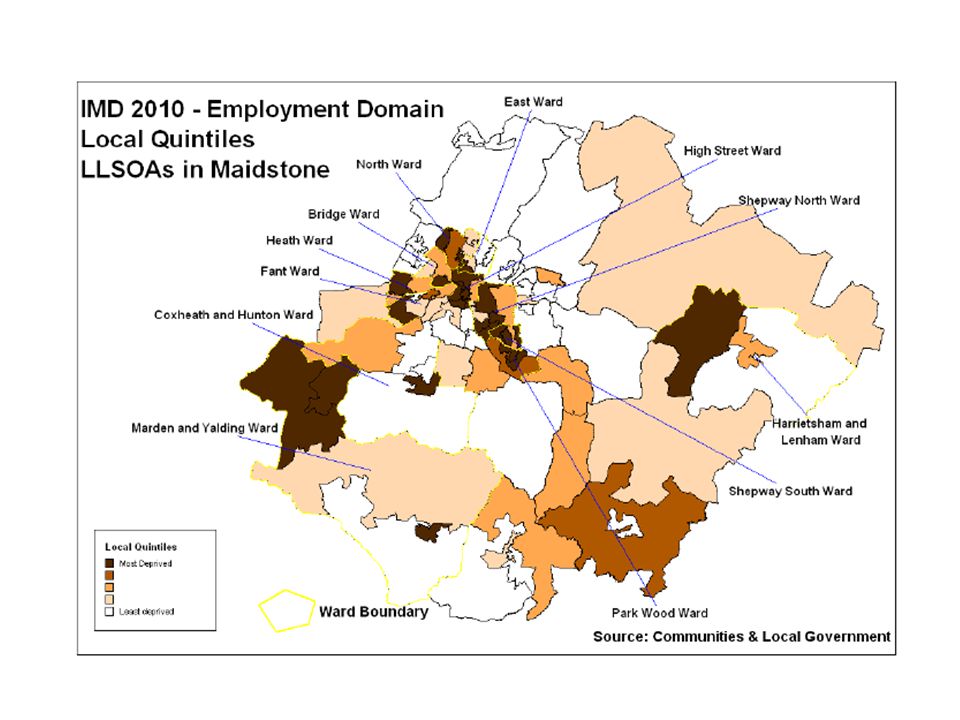
Maidstone unemployment

Similar presentations


 Review Proposed Priority Outcomes Erica Wimbush, Health Scotland 26 October 2007.>")


 HINSTAssociatesHINSTAssociates Professor Chris Bentley>")


