Download presentation
Presentation is loading. Please wait.

1
© 2008 Freeman, et al. Designing Evaluation Measures for Tertiary Training Systems in Positive Behavior Support March 27, 2008 Rachel Freeman, Amanda Little, Nan Perrin, Marie Tieghi, Pat Kimbrough, Peter Griggs, & Kristin Tate

2
© 2008 Freeman, et al. Purpose of Presentation Describe how the tertiary trainer of trainer system fits within Kansas Emphasize how formative and summative evaluation is used to improve training Present process for designing tools and data systems over 5 years Show data for 5 cohorts of professionals

3
© 2008 Freeman, et al. Brief History of the KIPBS Training System

4
© 2008 Freeman, et al. History of KIPBS Project Initiated in 2001 Medicaid Director initiated PBS project Training program match with KU (federal fiscal participation) Statewide match for reimbursement Kansas State Plan includes PBS –Children who are Medicaid eligible (physical health screen)
 Statewide match for reimbursement Kansas State Plan includes PBS –Children who are Medicaid eligible (physical health screen).")
5
© 2008 Freeman, et al. Over 75 Professionals Trained Developmental Disability Services Mental Health Children and Family Services Education Independent Contractors District Tertiary Trainers in School- wide Positive Behavior Support (SWPBS)
.")
6
© 2008 Freeman, et al. Level of Tertiary Training Highly intensive “trainer of trainer” approach Target professionals who will teach others how to implement PBS Small number of professionals eligible to bill for PBS services & receive Medicaid reimbursement

7
© 2008 Freeman, et al. Kansas Institute for PBS 3 Training Sites across Kansas 2 in northeast 1 in central 1 distance learning class Over 75 professionals completed the entire course from Cohorts 1-5 (but not all case studies) 36 KIPBS Facilitators (completed all required case studies) 13 Active KIPBS Facilitators are billing for PBS services
 36 KIPBS Facilitators (completed all required case studies) 13 Active KIPBS Facilitators are billing for PBS services.")
8
© 2008 Freeman, et al. Training Requirements 8 hours a week for 12 months 2 full day conferences Monthly onsite classes Online activities and 2 open book online exams 2 case studies (now) –Person-centered plan –Functional behavioral assessment –PBS plan –Follow-up data 1 systems change demonstration
 –Person-centered plan –Functional behavioral assessment –PBS plan –Follow-up data 1 systems change demonstration.")
9
© 2008 Freeman, et al. Interagency Agreement for SWPBS Currently 6 districts and 20 schools are implementing SWPBS with funding from the state –8 districts & 42+ schools will be implementing in 2008-2008 –More districts are implementing SWPBS with other funds District tertiary trainers attend the KIPBS training

10
© 2008 Freeman, et al. All Organizations Learn Strategies Similar to SWPBS Establish a team/staff buy-in Establish a data-based decision-making system Modify incident reporting process Establish ways to teach important social and communication skills Develop plans for teaching skills systematically Create ways to recognize individuals –8 positive statements for every corrective statement Refine how we respond to problem behavior Monitor, evaluate, and modify what we do

11
© 2008 Freeman, et al. Primary Prevention: Organization-wide Wide Systems for All Children/Adults, Staff, & Settings Secondary Prevention: Specialized Group Systems for Children/Adults with At- Risk Behavior Tertiary Prevention: Specialized Individualized Systems for Children/Adults with High-Risk Behavior ~80% of Children/Adults ~15% ~5% CONTINUUM OF INSTRUCTIONAL & POSITIVE BEHAVIOR SUPPORT

12
© 2008 Freeman, et al. Expanding the Triangle to Community- based Organizations Intensive, Individual Interventions * Children with intense needs * Assessment-based * High Intensity Targeted Group Interventions * Some children (at risk) * High efficiency System-wide Interventions * All children * Preventive, proactive *Broad community focus Adapted from Sugai, 2002 Community-wide Behavior Support Systems 80-90% School-wide Behavior Systems 5-10% 1-5%
 * High efficiency System-wide Interventions * All children * Preventive, proactive *Broad community focus Adapted from Sugai, 2002 Community-wide Behavior Support Systems 80-90% School-wide Behavior Systems 5-10% 1-5%.")
13
© 2008 Freeman, et al. Levels of Community: Changing Contexts at all Levels Organization Neighborhood State City Nation

14
© 2008 Freeman, et al. SYSTEMS PRACTICES Information Supporting Staff Behavior Supporting Decision Making Supporting Student Behavior Positive Behavior Support OUTCOMES Social Competence, Self Determination Academic Achievement, and Safety Center for Positive Behavior Interventions and Supports (2002)
.")
15
© 2008 Freeman, et al. Organization-wide Positive Behavior Support Last year was a transition year for organization- wide planning Larger organizations must define parameters of systems change Tools were developed by state-wide PBS team (PBS-Kansas) These tools were piloted last year Alaska statewide team is working with us to create a training tool similar to the School-wide Evaluation Tool (SET)
 These tools were piloted last year Alaska statewide team is working with us to create a training tool similar to the School-wide Evaluation Tool (SET).")
16
© 2008 Freeman, et al. Geographic Challenges for Training Across Kansas (Western “Frontier Counties”) Green=Facilitator Dark blue=Student Gray=Student, Auditor Brown=Auditor, Instructor Red=Student, Facilitator Yellow=Student, Facilitator, Facilitator/Instructor Light blue=Student, Facilitator, Auditor, Facilitator/Instructor Salmon=Student, Auditor, Facilitator
 Green=Facilitator Dark blue=Student Gray=Student, Auditor Brown=Auditor, Instructor Red=Student, Facilitator Yellow=Student, Facilitator, Facilitator/Instructor Light blue=Student, Facilitator, Auditor, Facilitator/Instructor Salmon=Student, Auditor, Facilitator.")
17
© 2008 Freeman, et al. Evaluating the KIPBS Training Initial First Steps: Creating a Checklist for Evaluating Case Studies with Cohorts 1 & 2

18
© 2008 Freeman, et al. Professionals in KIPBS Training Program Professionals Taking Course Completed 3 Case Studies Graduated KIPBS Course Able to Bill Medicaid Cohort 1 12888 Cohort 2 1511109 Note: KIPBS started with an initial cadre of experts who submitted plans prior to the training system and were “mentored-in.” This accounts for 7 additional KIPBS Facilitators

19
© 2008 Freeman, et al. First Question for Cohorts 1 & 2: Is the KIPBS Training Program Improving From One Year to the Next? a)Do training outcomes improve from one year to the next? b)Are there any differences in training outcomes in PCP versus PBS?
Do training outcomes improve from one year to the next. b)Are there any differences in training outcomes in PCP versus PBS .")
20
© 2008 Freeman, et al. Evaluating the Quality of Written Plans Two written reports –Person-centered planning (PCP) –Positive behavior support (PBS) Two Separate Checklists operationalizing PCP and PBS One group worked on PCP and the other PBS No language related to wraparound planning
 –Positive behavior support (PBS) Two Separate Checklists operationalizing PCP and PBS One group worked on PCP and the other PBS No language related to wraparound planning.")
21
© 2008 Freeman, et al.

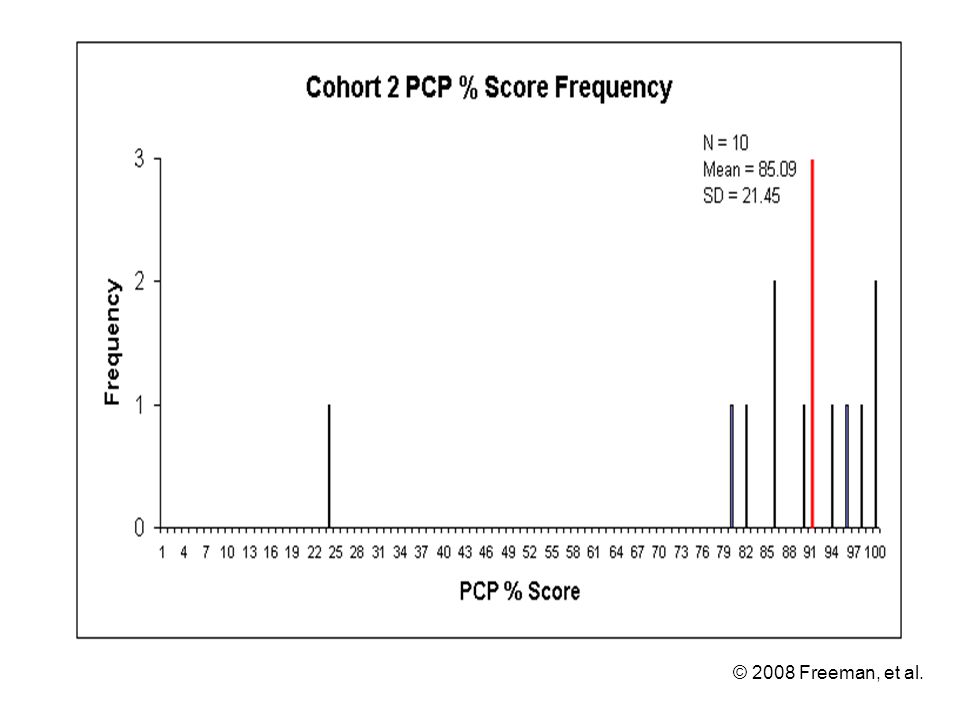
23
PCP Post-test Checklist Results Cohort 1 (PCP)Cohort 2 (PCP) N = 11 N = 10 Mean = 64Mean = 85.09 SD = 20.77SD = 21.45
Cohort 2 (PCP) N = 11 N = 10 Mean = 64Mean = SD = 20.77SD = 21.45")
24
© 2008 Freeman, et al.

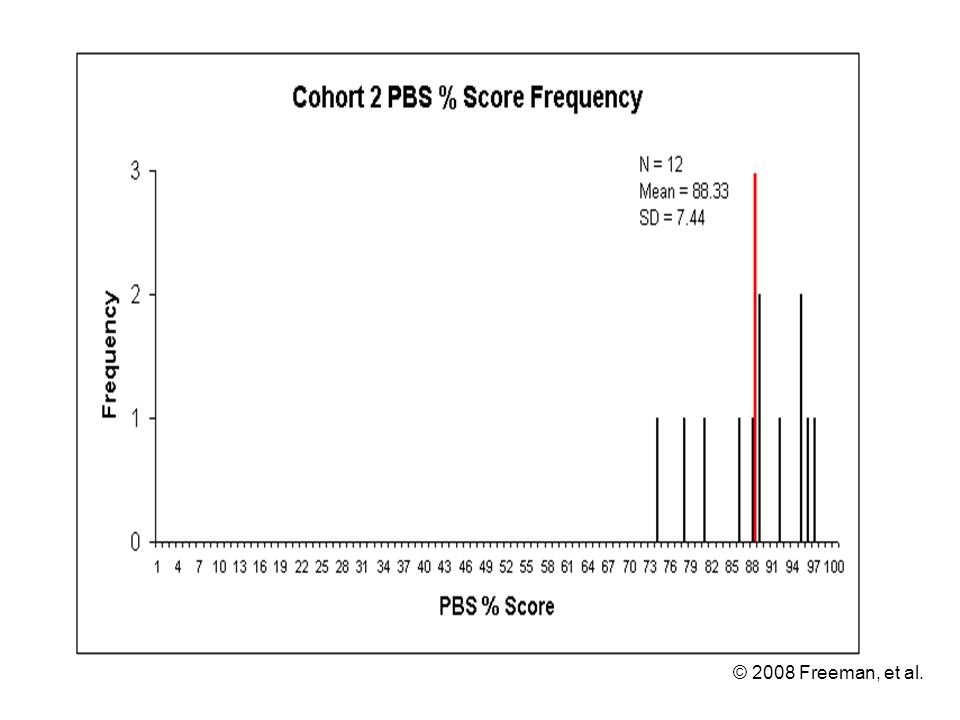
26
PBS Post-test Checklist Results Cohort 1 (PBS)Cohort 2 (PBS) N = 10 N = 12 Mean = 75Mean = 88.33 SD = 10.25SD = 7.44
Cohort 2 (PBS) N = 10 N = 12 Mean = 75Mean = SD = 10.25SD = 7.44")
27
© 2008 Freeman, et al. Changes After Cohort 2 Combined PCP and PBS into one plan One PC-PBS checklist –68-item checklist –14 general information items, –26 PBS items – 28 PCP items Instructors are now leaders in scoring plans Inter-rater agreement process expanded Cohorts 1-2 data are considered different 2 full case studies Changed due dates to avoid procrastination issues (6 months to finish up)
.")
28
© 2008 Freeman, et al. Inter-rater Agreement on PC- PBS Checklist 5 People Scoring; 1 Agreement Person Proportion of Agreement: Formula = [Number of Agreements/(Agreements + Disagreements)] x 100% Inter-Rater Agreement on PC-PBS Checklist Number of Raters Number of Plans Ave. Reliability Reliability Range 5874.63 47.06 to 88.24 As of Feb. 07, all 5 raters were “reliable raters” (3 plans with 75% or above agreement)
] x 100% Inter-Rater Agreement on PC-PBS Checklist Number of Raters Number of Plans Ave. Reliability Reliability Range to As of Feb. 07, all 5 raters were reliable raters (3 plans with 75% or above agreement).")
29
© 2008 Freeman, et al. Professionals in KIPBS Training Program Professionals Taking Course Completed 2 Case Studies Graduated KIPBS Course Able to Bill Medicaid Cohort 3 148 8 Cohort 4 18 (5 auditing) 5174 Note: Starting with Cohort 4, some professionals audited the training program. Auditors are only required to complete one case study activity.
 5174 Note: Starting with Cohort 4, some professionals audited the training program. Auditors are only required to complete one case study activity..")
30
© 2008 Freeman, et al. Training Cohorts 3 & 4 – Frequency Distribution on the Entire Plan

31
© 2008 Freeman, et al. Training Cohorts 3 & 4 – Score distribution on PBS items

32
© 2008 Freeman, et al. Training Cohorts 3 & 4 – Score distribution on PCP items

33
© 2008 Freeman, et al. PC-PBS Checklist Results Cohorts 3 & 4 PBS Items Cohorts 3 & 4 PCP Items Cohorts 3 & 4 PC-PBS Checklist N26 Mean91.3895.2392.85 St. Dev.6.783.304.17 Range67 - 10089 - 10082 - 99

34
© 2008 Freeman, et al. Evaluating the Quality of Written Plans Cohorts 3 & 4 Combined (Note: Cohorts 1 & 2 are available upon request)
.")
35
© 2008 Freeman, et al. What are the Effects of the KIPBS Training Program on Written Plans? a)Quality of plans (PC-PBS Checklist) b)Impact scores of written plans (KIPBS Impact Assessment)
Quality of plans (PC-PBS Checklist) b)Impact scores of written plans (KIPBS Impact Assessment).")
36
© 2008 Freeman, et al. Evaluating Professional’s Case Studies Pre-training PCP and PBS Plans Professionals submit example of PCP & PBS plans that they have written with application (if possible) Professionals in training ask for child’s PCP and PBS plans that were in place before they begin working with the team Post-training PCP and PBS Plan Evaluation Completes a person-centered and PBS plan Both Pre and Post Plans Are Scored Using: 1.PC-PBS Checklist 2.Impact Scale
 Professionals in training ask for child’s PCP and PBS plans that were in place before they begin working with the team Post-training PCP and PBS Plan Evaluation Completes a person-centered and PBS plan Both Pre and Post Plans Are Scored Using: 1.PC-PBS Checklist 2.Impact Scale.")
37
© 2008 Freeman, et al. Professionals from Cohorts 3 & 4: Comparison of Scores on Plans Completed Before and During the Training

38
© 2008 Freeman, et al. Professionals from Cohorts 3 & 4: Comparison of Scores on a Child or Adult’s Written Plan Before and During the Training

39
© 2008 Freeman, et al. Professionals from Cohorts 3 & 4: Comparisons of Scores Broken Down by Types of Report and by Case Study

40
© 2008 Freeman, et al. Professionals from Cohorts 3 & 4: Results Broken Down by Sections of the PC-PBS Checklist

41
© 2008 Freeman, et al. Evaluating the Impact of Written Plans on the Lives of Children & Team Members

42
© 2008 Freeman, et al. Seven Summary Impact Data Items Plans are rated, using a 3-point scale (1 = negative impact; 2 = no impact; 3 = positive impact): 1.Impact on focus individual’s overall problem behaviors 2.Impact on person’s overall appropriate/adaptive behaviors 3.Impact on person’s quality of life 4.Impact on team’s time, resources & needs (i.e., contextual fit) 5.Impact on team’s satisfaction with the results 6.Impact on caregivers’ satisfaction with the results 7.Impact on caregiver’s quality of life
: 1.Impact on focus individual’s overall problem behaviors 2.Impact on person’s overall appropriate/adaptive behaviors 3.Impact on person’s quality of life 4.Impact on team’s time, resources & needs (i.e., contextual fit) 5.Impact on team’s satisfaction with the results 6.Impact on caregivers’ satisfaction with the results 7.Impact on caregiver’s quality of life.")
43
© 2008 Freeman, et al. Professionals from Cohorts 3 & 4: Individual Impact Scores Cohorts 3 & 4 - All Case Studies (N = 26) Total 1sTotal 2sTotal 3s 1. Impact on person's overall Problem behaviors 1223 2. Impact on person's overall Appropriate/Adaptive behaviors 0521 3. Impact on the person's Quality of Life 0224 4. Impact on the team's time, resources, & needs 1223 5. Impact on the team's satisfaction with results 0125 6. Impact on caregiver's satisfaction with results 0323 7. Impact on caregiver's Quality of Life 0323 Total 218162
 Total 1sTotal 2sTotal 3s 1. Impact on person s overall Problem behaviors Impact on person s overall Appropriate/Adaptive behaviors Impact on the person s Quality of Life Impact on the team s time, resources, & needs Impact on the team s satisfaction with results Impact on caregiver s satisfaction with results Impact on caregiver s Quality of Life 0323 Total")
44
© 2008 Freeman, et al. Professionals from Cohorts 3 & 4: Individual Impact Scores by Percentage Cohorts 3 & 4 - All Case Studies (N = 26) % 1s% 2s% 3s 1. Impact on person's overall Problem behaviors 3.857.6988.46 2. Impact on person's overall Appropriate/Adaptive behaviors 0.0019.2380.77 3. Impact on the person's Quality of Life 0.007.6992.31 4. Impact on the team's time, resources, & needs 3.857.6988.46 5. Impact on the team's satisfaction with results 0.003.8596.15 6. Impact on caregiver's satisfaction with results 0.0011.5488.46 7. Impact on caregiver's Quality of Life 0.0011.5488.46
 % 1s% 2s% 3s 1. Impact on person s overall Problem behaviors Impact on person s overall Appropriate/Adaptive behaviors Impact on the person s Quality of Life Impact on the team s time, resources, & needs Impact on the team s satisfaction with results Impact on caregiver s satisfaction with results Impact on caregiver s Quality of Life")
45
© 2008 Freeman, et al. Professionals in Cohort 3: Impact Summary 9 trainees, 2 plans each (18 plans scored) 33% of these plans (6/18) received a score of 3 on all seven impact questions (i.e., perfect scores for these plans) Only one of the nine Cohort 3 students received a perfect score on BOTH case study plans
 33% of these plans (6/18) received a score of 3 on all seven impact questions (i.e., perfect scores for these plans) Only one of the nine Cohort 3 students received a perfect score on BOTH case study plans.")
46
© 2008 Freeman, et al. Professionals in Cohort 4: Impact Summary 4 trainees, 2 plans each (8 plans scored) 75% of these plans (6/8) received a score of 3 on all seven impact questions (i.e., perfect scores for these plans) Three of the four Cohort 4 students received a perfect score on BOTH case study plans
 75% of these plans (6/8) received a score of 3 on all seven impact questions (i.e., perfect scores for these plans) Three of the four Cohort 4 students received a perfect score on BOTH case study plans.")
47
© 2008 Freeman, et al. Professionals from Cohorts 3 & 4: Impact Scores Implications & Conclusions Items that scored the highest on impact –Item #3 (focus person’s quality of life), –Item #5 (team’s satisfaction with results), –Item #6 (caregivers’ satisfaction with results), and –Item #7 (caregivers’ quality of life)
, –Item #5 (team’s satisfaction with results), –Item #6 (caregivers’ satisfaction with results), and –Item #7 (caregivers’ quality of life).")
48
© 2008 Freeman, et al. Evaluating the KIPBS Billing System

49
© 2008 Freeman, et al. Number of Children Receiving Services from 2003-2007

50
© 2008 Freeman, et al. The counties in blue indicate where children have been served. The black dots indicate where the facilitators who have billed are located. Location where Children have Received PBS Services across Kansas

51
© 2008 Freeman, et al. KIPBS Facilitator Data First Case: Evaluation

52
© 2008 Freeman, et al. KIPBS Facilitators - First Case Scores on PC-PBS Checklist

53
© 2008 Freeman, et al. KIPBS Facilitators - First Case Scores by Section

54
© 2008 Freeman, et al. Seven Summary Impact Data Items Plans are rated, using a 3-point scale (1 = negative impact; 2 = no impact; 3 = positive impact): 1.Impact on focus individual’s overall problem behaviors 2.Impact on person’s overall appropriate/adaptive behaviors 3.Impact on person’s quality of life 4.Impact on team’s time, resources & needs (i.e., contextual fit) 5.Impact on team’s satisfaction with the results 6.Impact on caregivers’ satisfaction with the results 7.Impact on caregiver’s quality of life
: 1.Impact on focus individual’s overall problem behaviors 2.Impact on person’s overall appropriate/adaptive behaviors 3.Impact on person’s quality of life 4.Impact on team’s time, resources & needs (i.e., contextual fit) 5.Impact on team’s satisfaction with the results 6.Impact on caregivers’ satisfaction with the results 7.Impact on caregiver’s quality of life.")
55
© 2008 Freeman, et al. KIPBS Facilitator Data - First Case: Individual Impact Scores KIPBS Facilitators 1st Case Out (N = 7) Total 1s Total 2s Total 3s 1. Impact on person's overall Problem behaviors* 015 2. Impact on person's overall Appropriate/Adaptive behaviors* 015 3. Impact on the person's Quality of Life 025 4. Impact on the team's time, resources, & needs 007 5. Impact on the team's satisfaction with results 007 6. Impact on caregiver's satisfaction with results 016 7. Impact on caregiver's Quality of Life 016 * One plan could not be rated on items 1 & 2 (N = 6 for these items) Total 0641
 Total 1s Total 2s Total 3s 1. Impact on person s overall Problem behaviors* Impact on person s overall Appropriate/Adaptive behaviors* Impact on the person s Quality of Life Impact on the team s time, resources, & needs Impact on the team s satisfaction with results Impact on caregiver s satisfaction with results Impact on caregiver s Quality of Life 016 * One plan could not be rated on items 1 & 2 (N = 6 for these items) Total")
56
© 2008 Freeman, et al. KIPBS Facilitator Data - First Case: Individual Impact Score by Percentage KIPBS Facilitators 1st Case Out (N = 7) % 1s% 2s% 3s 1. Impact on person's overall Problem behaviors* 0.0016.6783.33 2. Impact on person's overall Appropriate/Adaptive behaviors* 0.0016.6783.33 3. Impact on the person's Quality of Life 0.0028.5771.43 4. Impact on the team's time, resources, & needs 0.00 100.00 5. Impact on the team's satisfaction with results 0.00 100.00 6. Impact on caregiver's satisfaction with results 0.0014.2985.71 7. Impact on caregiver's Quality of Life 0.0014.2985.71 * One plan could not be rated on items 1 & 2 (N = 6 for these items)
 % 1s% 2s% 3s 1. Impact on person s overall Problem behaviors* Impact on person s overall Appropriate/Adaptive behaviors* Impact on the person s Quality of Life Impact on the team s time, resources, & needs Impact on the team s satisfaction with results Impact on caregiver s satisfaction with results Impact on caregiver s Quality of Life * One plan could not be rated on items 1 & 2 (N = 6 for these items).")
57
© 2008 Freeman, et al. KIPBS Facilitator Data First Case: Impact Ratings Overall, impact ratings were very high across all 7 first case plans with very little variability in scores. None of the plans were rated as having as negative impact across any of the seven impact items 87.23% (41/47) of the TOTAL impact scores across ALL 7 first case plans for all KIPBS facilitators received a score of “3”
 of the TOTAL impact scores across ALL 7 first case plans for all KIPBS facilitators received a score of 3 .")
58
© 2008 Freeman, et al. KIPBS Facilitator Data First Case: Impact Ratings 100% (i.e., 7/7) of first case plans received scores of “3” (highest/best) on –Impact on team’s time, resources & needs (item #4), and on –Impact on team’s satisfaction with results (item #5)
 of first case plans received scores of 3 (highest/best) on –Impact on team’s time, resources & needs (item #4), and on –Impact on team’s satisfaction with results (item #5).")
59
© 2008 Freeman, et al. KIPBS Facilitator Data First Case: Impact Ratings 83.3% (5/6) of plans received scores of “3” on Impact on person’s overall problem behaviors (item #1) and on Impact on person’s overall appropriate/ adaptive behavior (item #2) 85.7% (6/7) of plans received scores of “3” on Impact on caregivers’ satisfaction with results (item #6) and on Impact on caregivers’ quality of life (item #7) 71.4% (5/7) of plans received scores of “3” on Impact on focus person’s quality of life (item #3)
 of plans received scores of 3 on Impact on person’s overall problem behaviors (item #1) and on Impact on person’s overall appropriate/ adaptive behavior (item #2) 85.7% (6/7) of plans received scores of 3 on Impact on caregivers’ satisfaction with results (item #6) and on Impact on caregivers’ quality of life (item #7) 71.4% (5/7) of plans received scores of 3 on Impact on focus person’s quality of life (item #3).")
60
© 2008 Freeman, et al. KIPBS Facilitator Data First Case: Impact Ratings Only one out of six facilitators did not produce ratings of “3” on BOTH Impact on person’s overall problem behaviors (item #1 ) AND on Impact on person’s overall appropriate/ adaptive behaviors (item #2) Only two of the seven facilitators did not produce ratings of “3” on BOTH Impact on focus person’s quality of life (item #3) AND on Impact on caregivers’ quality of life (item #7)
 AND on Impact on person’s overall appropriate/ adaptive behaviors (item #2) Only two of the seven facilitators did not produce ratings of 3 on BOTH Impact on focus person’s quality of life (item #3) AND on Impact on caregivers’ quality of life (item #7).")
61
© 2008 Freeman, et al. KIPBS Facilitator Data - First Case: Individual Plan Scores & Impact Ratings

62
© 2008 Freeman, et al. “On Paper” PBS Plans and Impact Ratings The highest scored plan on paper (overall score of 96.3%) resulted in no perceived impact on focus person’s quality of life (Item 3), as reported by caregivers All of the plans regardless of score resulted in impact for the individuals served
 resulted in no perceived impact on focus person’s quality of life (Item 3), as reported by caregivers All of the plans regardless of score resulted in impact for the individuals served.")
63
© 2008 Freeman, et al. KIPBS Facilitator Data First Case: Global Risk Assessment Global Risk Assessment Scale 1=Strongly disagree to 5=strongly agree A higher score is BAD—highest/worst score on an item is “5”

64
© 2008 Freeman, et al. KIPBS Facilitator Data - First Case: Global Risk Assessment Scores Risk Assessment Difference for 1st PA cases (N = 7) The individual’s behavior…. Mean Pre Mean Post Diffe- rence 1. Significantly and consistently interferes with integration and participation in the community 4.863.001.86 2. Is dangerous to others 4.292.331.95 3. Provides a health risk to self (i.e. head banging, self-biting, ingestion of objects, etc.) 4.143.001.14 4. Results in significant damage to property 4.002.00 5. Is likely to become serious in the near future if not addressed 5.003.331.67 6. Is occurring at such a frequency or intensity that a caregiver’s ability to effectively provide support is being compromised 4.711.832.88 7. Results in the involvement of law enforcement 2.141.170.98 8. Puts them at risk of institutionalization or loss of a current least restrictive environment 4.572.172.40 Across all 4.212.351.86
 The individual’s behavior…. Mean Pre Mean Post Diffe- rence 1. Significantly and consistently interferes with integration and participation in the community Is dangerous to others Provides a health risk to self (i.e. head banging, self-biting, ingestion of objects, etc.) Results in significant damage to property Is likely to become serious in the near future if not addressed Is occurring at such a frequency or intensity that a caregiver’s ability to effectively provide support is being compromised Results in the involvement of law enforcement Puts them at risk of institutionalization or loss of a current least restrictive environment Across all")
65
© 2008 Freeman, et al. KIPBS Facilitator Data - First Case: Global Risk Assessment Scores Mean pre/post scores by item were in a positive direction for ALL eight items Overall mean change score for all 7 KIPBS facilitators across all 8 items on scale was 1.86 on 5-point scale Pre Mean (4.20) Post Mean (2.35)
 Post Mean (2.35).")
66
© 2008 Freeman, et al. KIPBS Facilitator Data - First Case: Global Risk Assessment Scores

67
© 2008 Freeman, et al. After the First Case is Submitted & Scored…. Ongoing Evaluation of KIPBS Facilitators Occurs by a 25% Random Sample

68
© 2008 Freeman, et al. KIPBS Facilitator Data – 25% Random Selection Process Process for random selection After the KIPBS Facilitator has successfully completed the first case review, All of his/her completed, full case studies are entered into the random selection pool In November, the pool is totaled, and 25% of those cases are randomly selected for evaluation: –Cases are entered into the drawing, and 25% are picked

69
© 2008 Freeman, et al. KIPBS Facilitator Data – Results of 25% Random Selection This November (2007), there were 12 completed plans in the pool All 12 were entered into the random selection drawing 3 Plans (25%) were drawn Two of the three plans have been scored (we just received the last one) Average Percent Score on the PC-PBS Checklist for these two plans was 80.15% –Highest score was 81.62% –Weaker areas of both plans = follow-up evaluation
, there were 12 completed plans in the pool All 12 were entered into the random selection drawing 3 Plans (25%) were drawn Two of the three plans have been scored (we just received the last one) Average Percent Score on the PC-PBS Checklist for these two plans was 80.15% –Highest score was 81.62% –Weaker areas of both plans = follow-up evaluation.")
70
© 2008 Freeman, et al. Summary of KIPBS Evaluation Findings: Future Directions

71
© 2008 Freeman, et al. Implications for Training Future Cohorts and Monitoring/ Mentoring Billing Graduates Written plans expected during training vs. during billing are different –Function is critical –Living documents For some graduates the mentoring of two case studies (or in the case of cohort 1 and 2, one complete and two partial cases) may not be enough support to sustain skills Ongoing monitoring and support may be necessary and is embedded
 may not be enough support to sustain skills Ongoing monitoring and support may be necessary and is embedded.")
72
© 2008 Freeman, et al. Implications for Training Future Cohorts and Monitoring/ Mentoring Billing Graduates Current Challenge: encouraging ongoing self assessment after training in between random selection –Increase in number of billed cases evaluated –Use organization-wide training systems to encourage self assessment using tool like the PC-PBS Checklist –Increase support for those facilitators “out the door” who need it Increase focus on systems level/organization wide evaluation –ISSET-like tool for community organizations –Move towards a different evaluation process after billing Expand evaluation of measures that assess fidelity of parent/team member intervention implementation Look at parent behavioral data related to expectations within the service

73
© 2008 Freeman, et al. Future Training, Tool Development, and Evaluation Activities Continue working on inter-rater agreement for the KIPBS Impact Assessment Establish whether 80% on the PC-PBS Checklist is associated with decreases in problem behavior and increases in replacement behaviors Develop surveys to send to family/team members receiving & participating in PBS

74
© 2008 Freeman, et al. Future Training, Tool Development, and Evaluation Activities Continue to improve operational definitions and measurement skills: –In current training –As part of update trainings Each Facilitator will receive –graphs of training case studies, first case study after billing, and randomly selected cases during billing –Positive feedback for strengths –Suggestions for improving areas in plans that are systematically lower across plans

75
© 2008 Freeman, et al. Future Training, Tool Development, and Evaluation Activities (con’t) Create a survey that combines key indices of quality of life, contextual fit, and impact on behavior, into one tool (the “TOOL”) Expand reporting process to include other survey data already being collected (QOL, contextual fit, etc.) Create a different process for evaluating portion of billed cases
 Create a survey that combines key indices of quality of life, contextual fit, and impact on behavior, into one tool (the TOOL ) Expand reporting process to include other survey data already being collected (QOL, contextual fit, etc.) Create a different process for evaluating portion of billed cases.")
Similar presentations
 Forms 2007 Illinois State Board of Education June 2007.>")


 on Applied Behavior Analysis (ABA) principles within the EIBI autism classroom,>")


