Download presentation
Presentation is loading. Please wait.

1
www.csiro.au Scientific tools to support practical implementation of EBFM Tony Smith*, Beth Fulton*, Alistair Hobday*, David Smith*, Paula Shoulder # CSIRO Marine Research*, AFMA #

2
Outline Ecosystem based fisheries management (EBFM) A framework for tool development Ecological risk assessment (ERA) Management strategy evaluation (MSE) Harvest strategy framework (HSF) Expanding the toolbox Acknowledgements
 A framework for tool development Ecological risk assessment (ERA) Management strategy evaluation (MSE) Harvest strategy framework (HSF) Expanding the toolbox Acknowledgements")
3
Ecosystem based fisheries management (EBFM) Aka ecosystem approach to fisheries (FAO) Objective: to sustain healthy marine ecosystems and the fisheries they support (Pikkitch et al 2004) Key elements: avoid degradation of ecosystems minimize risk of irreversible change obtain long term socioeconomic benefits precautionary approach to uncertainty
 Aka ecosystem approach to fisheries (FAO) Objective: to sustain healthy marine ecosystems and the fisheries they support (Pikkitch et al 2004) Key elements: avoid degradation of ecosystems minimize risk of irreversible change obtain long term socioeconomic benefits precautionary approach to uncertainty")
4
Policy drivers in Australia Major shift in emphasis in 1990s National commitment to ecologically sustainable development (ESD) New fisheries legislation New environmental legislation Australia’s Oceans Policy Policy development ran ahead of the scientific tools and methods to support it (and still is)
 New fisheries legislation New environmental legislation Australia’s Oceans Policy Policy development ran ahead of the scientific tools and methods to support it (and still is)")
5
Response to policy drivers monitoring (ecological indicators) assessment (ERA) management strategy evaluation (EBFM) performance measures (acceptable limits to change) spatial analysis in support of spatial management etc
 assessment (ERA) management strategy evaluation (EBFM) performance measures (acceptable limits to change) spatial analysis in support of spatial management etc")
6
Adaptive management cycle Monitoring Assessment Decision rule Ecosystem Regulation Impact Fishery Management strategy MSE Management strategy evaluation = MSE

7
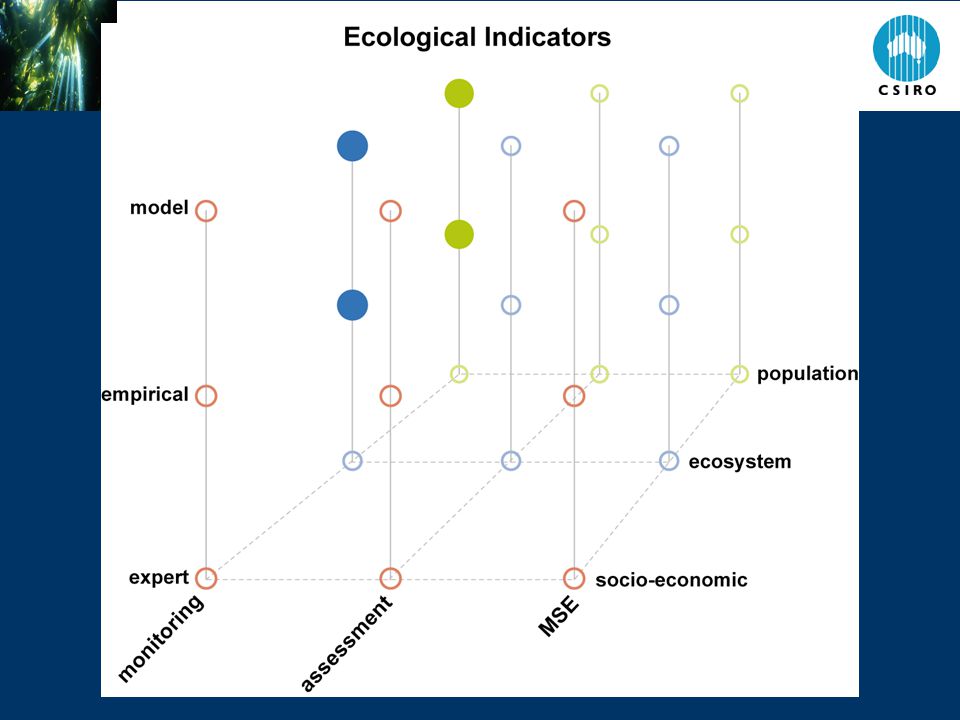
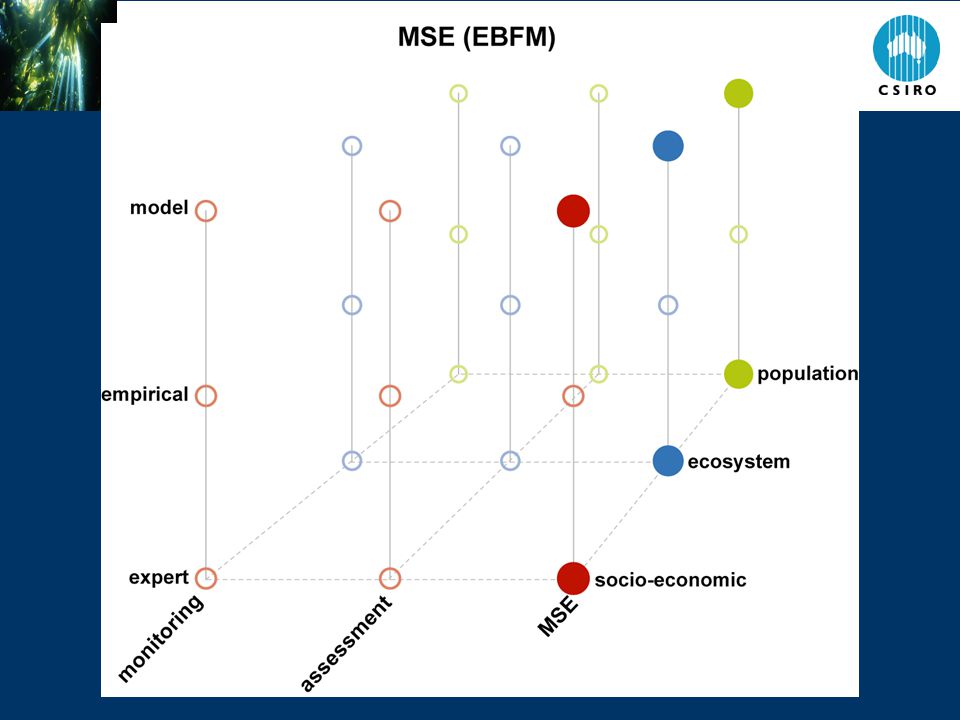
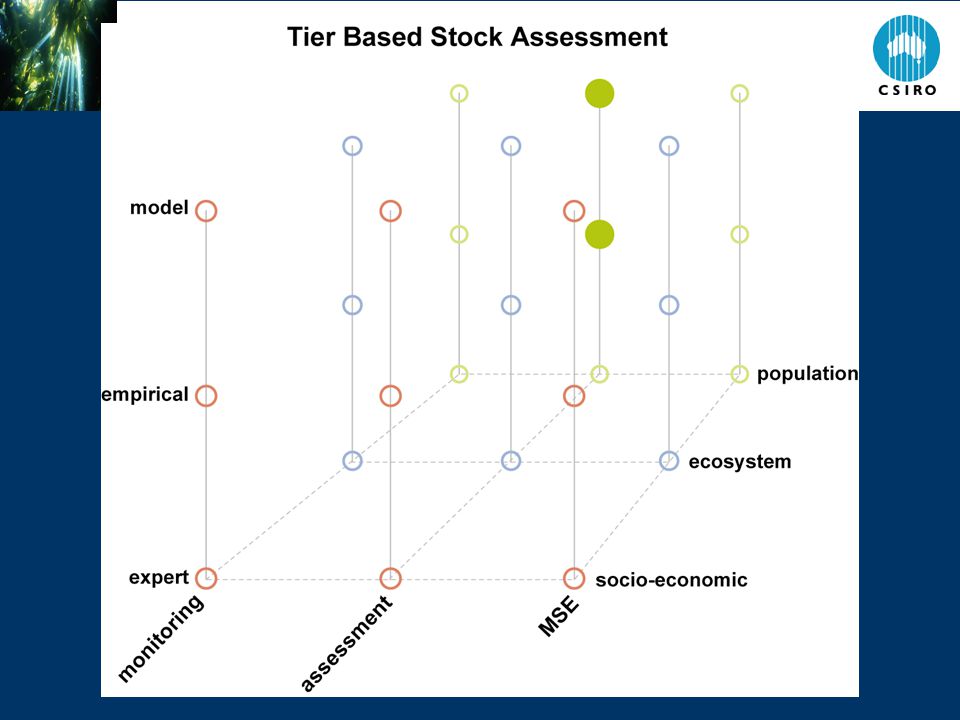
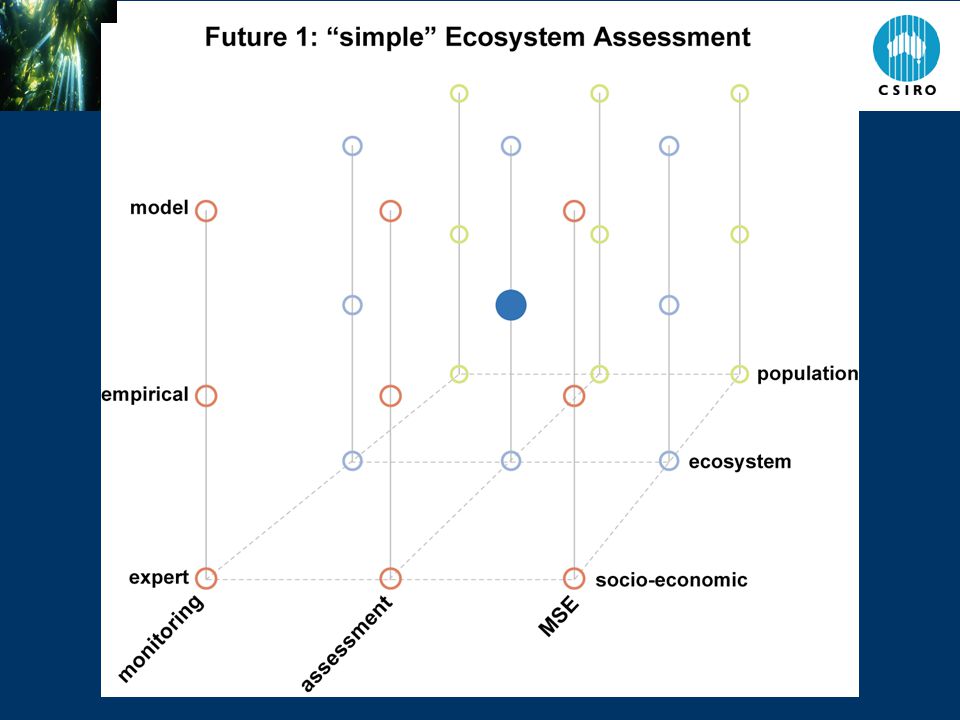
A framework for tool development

8
Example – stock assessment

10
Ecological Risk Assessment ERA is a key tool in support of EBFM Analogue of stock assessment Requirement to assess impacts of fishing on all components of ecological systems, including species, habitats and communities CSIRO and AFMA joint project to develop and apply ERA methods for fisheries Developed ERAEF (ERA for effects of fishing)
")
11
Criteria for ERA design Comprehensive Scientifically defensible Make use of existing data and information Precautionary given uncertainty Cost effective Flexible (apply to all types of fisheries) Transparent Understandable to stakeholders Help inform management response No such method exists!
 Transparent Understandable to stakeholders Help inform management response No such method exists!")
12
ERAEF hierarchical structure Scoping Level 1 Level 2 Level 3 Risk Management Response LH LH LH Comprehensive Focused Time & $$ Uncertain More certain Qualitative Quantitative

13
ERAEF 5 ecological components assessed target species byproduct and bycatch species threatened, endangered and protected species habitats communities 25 activities assessed, including 5 external to the fishery

14
ERAEF – Scoping and Level 1 Scoping fishery description, management objectives, lists of species, habitats and communities Level 1 consider each of 25 activities X 5 components plausible worst case approach if medium or high risk, proceed to Level 2 (or risk mitigation)
")
15
ERAEF – Level 2 Level 3 would solve this equation…e.g. stock assessment Cannot do this for all species…time and $ PSA estimates the “r” and the “q” Use available attributes related to these terms (B = units in species, habitat or community component)
.")
16
ERAEF – Level 2 - PSA HIGH LOW

17
Species attributes Productivity attributes Maximum age Age at maturity Size at maturity Annual fecundity Maximum size Reproductive strategy Trophic level Susceptibility attributes Availability Overlap with fishery Global distribution Encounterability Water column position Depth range overlap Adult Habitat Selectivity Size at Maturity Total records (+/-) (TEP, DI, TA/BP) Post-capture mortality Fate on discarding
 (TEP, DI, TA/BP) Post-capture mortality Fate on discarding")
18
Place species on PSA plot HIGH LOW

19
Example bycatch PSA Have conducted PSA analyses for over 1800 species to date

20
Boulders supporting crinoids; coarse sediments supporting octocorals (5 types) Sediments, variously current/ wave rippled/ bioturbated supporting large epifauna (sponges, octocorals, crinoids) (19 types) Sediments, various morphology/ supporting small/ encrusting/ mobile epifauna (58 types) Inner shelf sediments supporting small/ encrusting epifauna (5 types) Habitats SGF classification based on photographic images (sediment, geomorphology, fauna)
 Sediments, variously current/ wave rippled/ bioturbated supporting large epifauna (sponges, octocorals, crinoids) (19 types) Sediments, various morphology/ supporting small/ encrusting/ mobile epifauna (58 types) Inner shelf sediments supporting small/ encrusting epifauna (5 types) Habitats SGF classification based on photographic images (sediment, geomorphology, fauna)")
21
Communities – bioregions x depth

22
Longline Trawl Purse-seine Example: Species Risk Distributions Across Fisheries

23
Fishing Activities P S LH L H P S LH L H P S LH L H Target CommunitiesHabitatsTEPBycatch e.g. stock assessment e.g. Ecosim e.g. PVA Level 1 Level 2 Level 3 Scoping ERAEF overview X X

25
Whole of fishery assessment using MSE Context Southern and Eastern Scalefish and Shark Fishery Multi-everything species gear (trawl, seine, gillnet, longline etc) depth (20-1300m) latitude (sub-tropical to sub-Antarctic) Recently brought under single management plan
 depth ( m) latitude (sub-tropical to sub-Antarctic) Recently brought under single management plan")
26
MSE for a whole fishery Management arrangements QMS with 34 stocks/species (ITQs) licence limits by sector some gear restrictions Issues declining economic performance in most sectors increasing number of overfished species increasing effort in several sectors, new grounds
 licence limits by sector some gear restrictions Issues declining economic performance in most sectors increasing number of overfished species increasing effort in several sectors, new grounds")
27
AMS project Rethink management arrangements for SESSF Strategic approach – bring stakeholders along Management strategy evaluation approach (MSE) Showcase for EBFM (worst best) Two phases qualitative (expert judgement) quantitative (Atlantis model)
 Showcase for EBFM (worst best) Two phases qualitative (expert judgement) quantitative (Atlantis model)")
28
AMS – phase 1 Steps in MSE specify objectives (ecological, economic, social) develop performance measures (quantitative) specify management options (4 scenarios) predict consequences (expert judgement) identify tradeoffs (decision table)
 develop performance measures (quantitative) specify management options (4 scenarios) predict consequences (expert judgement) identify tradeoffs (decision table)")
29
AMS – phase 1 Management scenarios 1.Status quo – pessimistic 2.Status quo - optimistic 3.Enhance quota management system 4.Mix of quota, effort, gear and spatial management Evaluate against 26 performance indicators Economic, ecological, social

30
MSE output – decision table Economic objective Ecological objective Social objective Strategy 1 Strategy 2 Strategy 3

31
AMS – phase 1 Conclusions from phase 1 Most economic and ecological indicators continue to deteriorate under scenarios 1 to 3 Management scenario 4 does best in the medium to longer term, but with severe short term economic pain Results were used to argue for a “restructure” package to reduce effort and to smooth the transition to a sustainable fishery

32
AMS – phase 2 - Atlantis

33
Biophysical (operating) model = “virtual world” Physical — can include environmental forcing at variety of temporal and spatial scales Biophysical Structure and function — physical properties per cell — sediment nutrient cycling — growth limitation (nutrient, light, oxygen, space, substrate) — anthropogenic drivers
 model = virtual world Physical — can include environmental forcing at variety of temporal and spatial scales Biophysical Structure and function — physical properties per cell — sediment nutrient cycling — growth limitation (nutrient, light, oxygen, space, substrate) — anthropogenic drivers")
34
Ecological — population dynamics, habitat-dependent, multispecies, whole-of-ecosystem Structure and function —main processes (feeding, reproduction, movement, mortality, waste, age) — functional groups (by size and diet) — invertebrate biomass pools, vertebrate age structured (+ condition) Biophysical
 — functional groups (by size and diet) — invertebrate biomass pools, vertebrate age structured (+ condition) Biophysical")
35
Unexploited zooplankton jellies phytoplankton detritus infauna macrophytes small pelagics demersal fish pelagic fish squid demersal sharks pelagic sharks baleen whales birds seals toothed whales filter feeders zoobenthos

36
Heavily exploited filter feeders zoobenthos infauna macrophytes demersal fish demersal sharks pelagic fish toothed whales pelagic sharks seals birds small pelagics baleen whales squid jellies zooplankton phytoplankton detritus

37
Socioeconomic

38
Sectors Exploitation (e.g. fisheries) — simple through to sophisticated Harvest example — multiple fleets — ports (with dependent communities) — gears (catchability, availability, selectivity, escapement, creep, interactions) — effort allocation (access, exploration, displacement, costs, trading, targeting, behavioural types, vessel sizes) — impacts (including discarding, habitat modification etc) — compliance (differential levels & take-up, effects on harvesting, reporting veracity)
 — simple through to sophisticated Harvest example — multiple fleets — ports (with dependent communities) — gears (catchability, availability, selectivity, escapement, creep, interactions) — effort allocation (access, exploration, displacement, costs, trading, targeting, behavioural types, vessel sizes) — impacts (including discarding, habitat modification etc) — compliance (differential levels & take-up, effects on harvesting, reporting veracity).")
39
Monitoring and assessment

40
Monitoring & Assessment Data collection — simple signal with noise through to detailed models Fisheries dependent data (with error) Fisheries independent data (with error) — observers — surveys (trawl and acoustic) — multiple spatial/temporal resolutions Additional processing (aging, aggregate data, assessment models)
 Fisheries independent data (with error) — observers — surveys (trawl and acoustic) — multiple spatial/temporal resolutions Additional processing (aging, aggregate data, assessment models)")
41
Decision making

42
Management Management levers of interest – trigger points (allowances for mixed-species fisheries) – quotas (TAC, regional, companion, basket, ITQ) – seasonal access – zoning (different fleet access, MPA, seasonal) – gear (bycatch mitigation, limitation, modification, transferability) – size limits, days at sea – trip limits
 – quotas (TAC, regional, companion, basket, ITQ) – seasonal access – zoning (different fleet access, MPA, seasonal) – gear (bycatch mitigation, limitation, modification, transferability) – size limits, days at sea – trip limits")
43
Status quo (S1) vs Radical change (S4) AMS Phase 2 - results
 vs Radical change (S4) AMS Phase 2 - results")
44
CPUE comparison

45
Effort comparison

46
Relative Return comparison

47
Ecological status comparison

48
Gear conflict comparison Scenario 1 Scenario 4 Intense conflict No conflict

50
Harvest strategy framework for the SESSF 34 stocks/species under quota management by 2005 A third of these with quantitative assessments 7 stocks classified as overfished Despite considerable work on MSE, reference points, etc, no agreement on decision rules for setting TACs Requirement that harvest strategies including formal decision rules be implemented by 2005

51
HSF for the SESSF Adopted a 4 Tier system Tier 1: robust quantitative assessment Tier 2: preliminary quantitative assessment Tier 3: estimates of F from catch curves (age/length data) Tier 4: trends in CPUE Tier rules produce RBC (recommended biological catch) TAC
 Tier 4: trends in CPUE Tier rules produce RBC (recommended biological catch) TAC")
52
HSF for the SESSF Precautionary elements of the basic HSF Maximum and target exploitation rate Minimum biomass level Exploitation rates reduce below the target biomass Exploitation rates go to zero at the biomass limit Designed so that RBCs reduce as Tier level increases (*)
")
53
Biomass Exploitation rate F LIM F TARG B LIM Tier 1&2 harvest control rule

54
RBC calculations Tier 1: F TARG = F 40, B TARG = B 40, RBC = Catch[F TARG B CUR ] Tier 2: F TARG = M, B TARG = B 40, RBC = Catch[F TARG B CUR ] Tier 3: RBC = * C CUR where depends on ratio of F/M [0 to 1.2] Tier 4: RBC = (1 + *slope) * C CUR For Tiers 3 and 4, C CUR is average catch over the past four years, and includes landings plus discards
![RBC calculations Tier 1: F TARG = F 40, B TARG = B 40, RBC = Catch[F TARG B CUR ] Tier 2: F TARG = M, B TARG = B 40, RBC = Catch[F TARG B CUR ] Tier 3: RBC = * C CUR where depends on ratio of F/M [0 to 1.2] Tier 4: RBC = (1 + *slope) * C CUR For Tiers 3 and 4, C CUR is average catch over the past four years, and includes landings plus discards](http://images.slideplayer.com/15/4743192/slides/slide_54.jpg "RBC calculations Tier 1: F TARG = F 40, B TARG = B 40, RBC = Catch[F TARG B CUR ] Tier 2: F TARG = M, B TARG = B 40, RBC = Catch[F TARG B CUR ] Tier 3: RBC = * C CUR where depends on ratio of F/M [0 to 1.2] Tier 4: RBC = (1 + *slope) * C CUR For Tiers 3 and 4, C CUR is average catch over the past four years, and includes landings plus discards")
56
Back to the tools Have shown examples of several tools in support of EBFM (ERA, MSE, Tier based harvest strategies) Many other tools being developed in Australia and elsewhere (ERA currently very active) Information requirements daunting Still gaps in the toolbox
 Many other tools being developed in Australia and elsewhere (ERA currently very active) Information requirements daunting Still gaps in the toolbox")
59
Lessons learned There are viable alternatives to full quantitative approaches A range of tools are required in the toolbox Stakeholder involvement, understanding, and acceptance is critical A surprising level of agreement can be achieved across government, industry, conservation, and the sciences with due process and application of relatively simple analytical tools

60
Acknowledgements ERA: Alistair Hobday, Helen Webb, Ross Daley, Cathy Bulman, Jo Dowdney, Mike Fuller, Alan Williams, Sally Wayte, Miriana Sporcic, Dy Furlani, Shane Griffiths, Rob Kenyon, Tim Smith AMS: David Smith, Jeremy Prince, Ian Knuckey, Pascale Baelde, Terry Walker, Margot Sachse, Paula Shoulder, Beth Fulton, Gerry Geen, Sonia Talman HSF: David Smith, Paula Shoulder, Ian Knuckey, Jeremy Prince, Rudy Kloser, Geoff Tuck, Sally Wayte, Neil Klaer, Andre Punt

Similar presentations


 Fish 458; Lecture 21.>")


 under the MSFD was defined as “Populations of all commercially exploited fish and shellfish.>")
