Download presentation
Presentation is loading. Please wait.

1
In The Heltonian Era Control, Optimization, and Functional Analysis

2
The Heltonian Era 1970 From Dark Ages to Birth of Enlightenment 1980 Robust control, operator theory 1990 Matrix inequalities, convex optimization 2000 Nonlinear control, algebraic geometry 2010 ?? – Networks, sparsity, structure – Mixed boolean & real algebra/geometry – Expansion of applications in basic science and infrastructure

3
Robust control, operator theory Matrix inequalities, convex optimization Doyle(t) and Helton(t) Nonlinear control, algebraic geometry
 and Helton(t) Nonlinear control, algebraic geometry")
4
Multiscale physics Biology Medicine Ecology Geophysics Internet Smartgrid Economics

5
Biology Medicine

6
Control, Optimization, and Functional Analysis Na Li, John Doyle, and a cast of thousands (including Ben Recht and Marie Csete) Caltech Cardiovascular
 Caltech Cardiovascular")
7
RobustFragile Human complexity Metabolism Regeneration & repair Healing wound /infect Obesity, diabetes Cancer AutoImmune/Inflame

8
RobustFragile Mechanism? Metabolism Regeneration & repair Healing wound /infect Fat accumulation Insulin resistance Proliferation Inflammation Obesity, diabetes Cancer AutoImmune/Inflame Fat accumulation Insulin resistance Proliferation Inflammation

9
RobustFragile What’s the difference? Metabolism Regeneration & repair Healing wound /infect Obesity, diabetes Cancer AutoImmune/Inflame Accident or necessity? Fat accumulation Insulin resistance Proliferation Inflammation Fluctuating energy Static energy

10
RobustFragile What’s the difference? Metabolism Regeneration & repair Healing wound /infect Obesity, diabetes Cancer AutoImmune/Inflame Fat accumulation Insulin resistance Proliferation Inflammation Controlled Dynamic Uncontrolled Chronic Low mean High variability High mean Low variability

11
RobustFragile Restoring robustness Controlled Dynamic Uncontrolled Chronic Low mean High variability High mean Low variability

12
RobustYet Fragile Human complexity Metabolism Regeneration & repair Microbe symbionts Immune/inflammation Neuro-endocrine Complex societies Advanced technologies Risk “management” Obesity, diabetes Cancer Parasites, infection AutoImmune/Inflame Addiction, psychosis… Epidemics, war… Catastrophes Obfuscate, amplify,… Accident or necessity?

13
RobustFragile Metabolism Regeneration & repair Healing wound /infect Obesity, diabetes Cancer AutoImmune/Inflame Fat accumulation Insulin resistance Proliferation Inflammation Fragility Hijacking, side effects, unintended… Of mechanisms evolved for robustness Complexity control, robust/fragile tradeoffs Math: New robust/fragile conservation laws Accident or necessity? Both

14
Robust Metabolism Regeneration & repair Healing wound /infect Fragility Hijacking, side effects, unintended… Of mechanisms evolved for robustness Complexity control, robust/fragile tradeoffs Math: New robust/fragile conservation laws

15
Robust Metabolism Regeneration & repair Healing wound /infect Fat accumulation Insulin resistance Proliferation Inflammation Fluctuating energy Controlled Dynamic Low mean High variability Mechanism?

16
Brain Heart Muscle Liver GI Glu Triglyc Fat Glyc FFA Glycerol Oxy Lac/ph Food Out fast slow high low priority dynamics Control? Energy Inflammation Coagulation Evolved for large energy variation and moderate trauma

17
Brain Heart Muscle Glyc Oxy Out fast high low priority dynamics Control? Essential starting point?

18
Local metabolic control RsRs right heart R r, S r left heart, R l, S l arterial venous Feedback Controller systemic peripheral, Tissues, F s Workload,w(t) arterial venous Pulmonary peripheral Lungs, F p, R p QrQr QlQl H Related States VEVE “grey box” Plumbing and chemistry
 arterial venous Pulmonary peripheral Lungs, F p, R p QrQr QlQl H Related States VEVE grey box Plumbing and chemistry")
19
Robust/ Health Fragile/ Illness Persistent mystery Low mean High variability High mean Low variability

20
050100150200250300350050100150200250300350 40 60 80 100 120 140 HR HR data time(sec) High mean, low variability Low mean, high variability The persistent mystery Two experiments with same subject Heart rate data
 High mean, low variability Low mean, high variability The persistent mystery Two experiments with same subject Heart rate data")
21
Local metabolic control RsRs right heart R r, S r left heart, R l, S l arterial venous Feedback Controller systemic peripheral, Tissues, F s Workload,w(t) arterial venous Pulmonary peripheral Lungs, F p, R p QrQr QlQl H Related States VEVE Our approach Physiology! an ancient art

22
050100150200250300350400050100150200250300350400 40 60 80 100 120 140 160 180 Other views 1. Molecular genetics 2. Creation science 3. New sciences of - complexity - networks What gene?

23
050100150200250300350 0 50 100 150 050100150200250300350 40 60 80 100 120 140 HR HR data W watts time(sec) Data: Watts and HR Two experiments with same subject
 Data: Watts and HR Two experiments with same subject")
24
Data: Watts W 0 50 100 150 +100w Two experiments On recumbent Lifecycle

25
Data: Watts and HR 050100150200250300350 0 50 100 150 050100150200250300350 40 60 80 100 120 140 W time(sec) watts HR data
 watts HR data")
26
050100150200250300350 0 50 100 150 050100150200250300350 40 60 80 100 120 140 HR data W model time(sec) watts 1 st order linear model
 watts 1 st order linear model")
27
050100150200250300350 0 50 100 150 050100150200250300350 40 60 80 100 120 140 HR data W model time(sec) watts same 1 st order linear model
 watts same 1 st order linear model")
28
050100150200250300350 0 50 100 150 050100150200250300350 40 60 80 100 120 140 HR HR data W time(sec) Model and HR same 1 st order linear model
 Model and HR same 1 st order linear model")
29
050100150200250300350 0 50 100 150 050100150200250300350 40 60 80 100 120 140 HR HR data W time(sec) Model and HR 1 st order linear models (different parameters)
 Model and HR 1 st order linear models (different parameters)")
30
050100150200250300350 0 50 100 150 050100150200250300350 40 60 80 100 120 140 HR W time(sec) Explain differences between models ? ? ?

31
050100150200250300350 0 50 100 150 050100150200250300350 40 60 80 100 120 140 HR HR data W time(sec) Explain differences between models and data
 Explain differences between models and data")
32
050100150200250300 0 50 100 breath and HR at 0 watts inhale HR 2 nd order linear model

33
050100150200250300 0 50 100
34
050100150200250300 0 50 100 190200210220230240250260270280 40 50 60 70 80 90

35
190200210220230240250260270280 40 50 60 70 80 90 “resting” HR ~40 bpm fluctuations at ~10s period 100% fluctuations! Frequency sweep in breathing Fit well with 2 nd order model

36
190200210220230240250260270280 40 50 60 70 80 90 050100150200250300 0 50 100

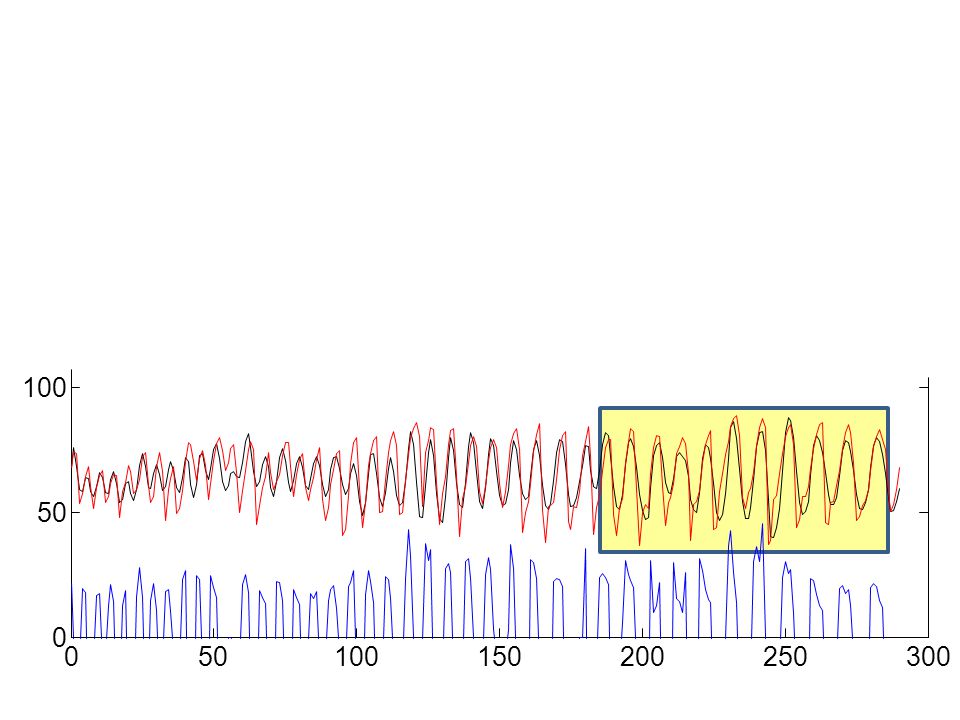
37
050100150200250300 0 50 100 0 50 100 @100 w @0 w data model

38
050100150200250300350400 0 50 100 150 200 250 300 050100150200250300350400 40 60 80 100 120 140 160 180 Watts HR data Explain differences between models model and data Different subject, 3 data sets

39
050100150200250300350400050100150200250300350400 40 60 80 100 120 140 160 180 HR High mean, low variability Low mean, high variability The persistent mystery Young, fit, healthy more extreme

40
Local metabolic control RsRs right heart R r, S r left heart, R l, S l arterial venous Feedback Controller systemic peripheral, Tissues, F s Workload,w(t) arterial venous Pulmonary peripheral Lungs, F p, R p QrQr QlQl H Related States VEVE Optimal control What can we say with this model?
 arterial venous Pulmonary peripheral Lungs, F p, R p QrQr QlQl H Related States VEVE Optimal control What can we say with this model")
41
Local metabolic control RsRs right heart R r, S r left heart, R l, S l arterial venous systemic peripheral, Tissues, F s Workload,w(t) arterial venous Pulmonary peripheral Lungs, F p, R p QrQr QlQl H VEVE Plumbing and chemistry (aerobic)
 arterial venous Pulmonary peripheral Lungs, F p, R p QrQr QlQl H VEVE Plumbing and chemistry (aerobic)")
42
Organized complexity, circa 1972 Plumbing and chemistry

43
Conservation laws: Energy and material (small moieties) Local metabolic control RsRs right heart R r, S r left heart, R l, S l arterialvenous systemic peripheral, Tissues, F s Workload,w(t) arterialvenous Pulmonary peripheral Lungs, F p, R p QrQr QlQl H VEVE
 Local metabolic control RsRs right heart R r, S r left heart, R l, S l arterialvenous systemic peripheral, Tissues, F s Workload,w(t) arterialvenous Pulmonary peripheral Lungs, F p, R p QrQr QlQl H VEVE")
44
Local metabolic control RsRs right heart R r, S r left heart, R l, S l arterial venous systemic peripheral, Tissues, F s Workload,w(t) arterial venous Pulmonary peripheral Lungs, F p, R p QrQr QlQl H Related States VEVE Conservation laws: Energy and material
 arterial venous Pulmonary peripheral Lungs, F p, R p QrQr QlQl H Related States VEVE Conservation laws: Energy and material")
45
Local metabolic control RsRs right heart R r, S r left heart, R l, S l arterial venous Feedback Controller systemic peripheral, Tissues, F s Workload,w(t) arterial venous Pulmonary peripheral Lungs, F p, R p QrQr QlQl H Related States VEVE “grey box”
 arterial venous Pulmonary peripheral Lungs, F p, R p QrQr QlQl H Related States VEVE grey box")
46
Local metabolic control RsRs right heart R r, S r left heart, R l, S l arterial venous Feedback Controller systemic peripheral, Tissues, F s Workload,w(t) arterial venous Pulmonary peripheral Lungs, F p, R p QrQr QlQl H Related States VEVE Optimal control Consequences?
 arterial venous Pulmonary peripheral Lungs, F p, R p QrQr QlQl H Related States VEVE Optimal control Consequences")
47
Local metabolic control RsRs right heart R r, S r left heart, R l, S l arterial venous Feedback Controller systemic peripheral, Tissues, F s Workload,w(t) arterial venous Pulmonary peripheral Lungs, F p, R p QrQr QlQl H Related States VEVE Conservation laws
 arterial venous Pulmonary peripheral Lungs, F p, R p QrQr QlQl H Related States VEVE Conservation laws")
48
sensor controls external disturbances heart rate ventilation vasodilation coagulation inflammation digestion storage … errors O2 BP pH Glucose Energy store Blood volume … infection trauma energy Homeostasis internal noise heart beat breath

49
errors Brain O2 BP pH Glucose Energy store Blood volume …

50
controls Brain heart rate ventilation vasodilation coagulation inflammation digestion storage …

51
external disturbances infection trauma energy

52
sensor noise controls internal noise heart beat breath errors Implementation heart rate ventilation vasodilation coagulation inflammation digestion storage … O2 BP pH Glucose Energy store Blood volume …

53
sensor controls external disturbances heart rate ventilation vasodilation coagulation inflammation digestion storage … errors O2 BP pH Glucose Energy store Blood volume … infection trauma energy Homeostasis internal noise heart beat breath

54
BP watts tissue arterial errors O2t Narrow focus Control Plant errors

55
Control Plant BP HR watts tissue arterial errors Control peripheral resistance O2t controls

56
Control Plant watts tissue arterial errors Control peripheral resistance O2t Close these loops

57
Control Plant BP HR watts tissue arterial errors Control peripheral resistance O2t controls Focus

58
Control Plant BP HR watts tissue arterial O2t Initial focus

59
Static model Brain Body BP HR watts O2t

60
050100150200 50 100 150 200 Watts HR Brain Body BP HR watts O2t Static model

61
050100150200 50 100 150 200 Watts HR Brain Body BP HR watts O2t

62
050100150200 50 100 150 200 Watts HR Brain Body BP HR watts O2t 0.040.080.120.16 80 120 160 200 BP O2t

63
050100150200 50 100 150 200 Watts 0.040.080.120.16 80 120 160 200 BP O2t Penalize BP and HR more Metabolism only

64
050100150200250300350 0 50 100 150 050100150200250300350 40 60 80 100 120 140 HR W time(sec) Explain differences between models ? ? 0.040.080.120.16 80 120 160 200 BP O2t Static model

65
0.040.080.120.16 80 120 160 200 BP O2t Brain Body BP HR watts O2t Use same weights but put back in dynamics

66
Local metabolic control RsRs right heart R r, S r left heart, R l, S l arterial venous Feedback Controller systemic peripheral, Tissues, F s Workload,w(t) arterial venous Pulmonary peripheral Lungs, F p, R p QrQr QlQl H Related States VEVE Optimal control What can we say with this model?
 arterial venous Pulmonary peripheral Lungs, F p, R p QrQr QlQl H Related States VEVE Optimal control What can we say with this model")
67
050100150200250300350400 0 20 40 60 80 100 120 140 160 HR-sim BP-sim [O 2 ] v -sim*1000 HR-measure watt 050100150200250300350400 60 80 100 120 140 160 180 Data and model
![HR-sim BP-sim [O 2 ] v -sim*1000 HR-measure watt Data and model](http://images.slideplayer.com/15/4736255/slides/slide_67.jpg "HR-sim BP-sim [O 2 ] v -sim*1000 HR-measure watt Data and model")
68
050100150200250300350400 0 20 40 60 80 100 120 140 160 HR-sim BP-sim [O 2 ] v -sim*1000 HR-measure 050100150200250300350400 60 80 100 120 140 160 180 BP O2t HR watts Mechanistic explanation for differences between models
![HR-sim BP-sim [O 2 ] v -sim*1000 HR-measure BP O2t HR watts Mechanistic explanation for differences between models](http://images.slideplayer.com/15/4736255/slides/slide_68.jpg "HR-sim BP-sim [O 2 ] v -sim*1000 HR-measure BP O2t HR watts Mechanistic explanation for differences between models")
69
050100150200250300350400 0 20 40 60 80 100 120 140 160 050100150200250300350400 60 80 100 120 140 160 180 BP O2t HR watts 0.040.080.120.16 80 120 160 200 BP O2t Penalize BP and HR more

70
050100150200250300350400 0 20 40 60 80 100 120 140 160 050100150200250300350400 60 80 100 120 140 160 180 BP HR 0.040.080.120.16 80 120 160 200 BP O2t High mean, low variability Low mean, high variability Mechanistic explanation for differences between models

71
050100150200250300350400 0 20 40 60 80 100 120 140 160 050100150200250300350400 60 80 100 120 140 160 180 HR Penalize BP and HR more Explain differences between models and data?

72
Control Plant HR breath Later internal noise

73
050100150200250300 0 50 100 HR breath HR

74
190200210220230240250260270280 40 50 60 70 80 90 050100150200250300 0 50 100 2 nd order linear model

75
190200210220230240250260270280 40 50 60 70 80 90 “resting” HR Frequency sweep in breathing Fit well with 2 nd order model Not a mechanistic model

76
190200210220230240250260270280 40 50 60 70 80 90 050100150200250300 0 50 100

77
050100150200250300 0 50 100 0 50 100 @100 w @0 w data 2 nd order linear model Penalize BP and HR more?

78
Control Plant HR breath internal noise Mechanism? Need mechanical coupling

79
050100150200250300350400 0 50 100 150 200 250 300 050100150200250300350400 40 60 80 100 120 140 160 180 Watts HR Different subject, 3 data sets

80
050100150200250300350400 0 50 100 150 200 250 300 050100150200250300350400 40 60 80 100 120 140 160 180 Watts HR1 st order linear model

81
050100150200250300350400 0 50 100 150 200 250 300 050100150200250300350400 40 60 80 100 120 140 160 180 HR1 st order linear model

82
050100150200250300350400 0 50 100 150 200 250 300 050100150200250300350400 40 60 80 100 120 140 160 180 1 st order linear models (different parameters)
")
83
050100150200250300350400 0 50 100 150 200 250 300 050100150200250300350400 40 60 80 100 120 140 160 180 1 st order linear models (different parameters) Explain differences between models model and data
 Explain differences between models model and data")
84
050100150200250300350400 0 50 100 150 200 250 300 050100150200250300350400 40 60 80 100 120 140 160 180 Explain differences between models model and data Anaerobic Breathing

85
Aside on gas variables Gas exchange variables are also predictable with simple models VO2 is simplest and most predictable VCO2-VO2 is most complex and we don’t have first principles model Also HR model is bad at high watt levels

86
0102030 0 2 4 0102030 80 120 160 100 200 300 400 HR data WattsHR model Time(min) JP data
 JP data")
87
0102030 0 1 Aerobic models can be way off at high watts (predict this signal should be constant) Can still fit with simple “black box” models, but… Need nonlinear dynamics Mechanistic models? Need anaerobic mechanisms Control of arterial pH is critical (and hard to model) aerobic model 2 nd order nonlinear fit
 aerobic model 2 nd order nonlinear fit.")
88
sensor controls external disturbances heart rate ventilation vasodilation coagulation inflammation digestion storage … errors O2 BP pH Glucose Energy store Blood volume … infection trauma energy Homeostasis internal noise heart beat breath

89
Local metabolic control RsRs right heart R r, S r left heart, R l, S l arterial venous Feedback Controller systemic peripheral, Tissues, F s Workload,w(t) arterial venous Pulmonary peripheral Lungs, F p, R p QrQr QlQl H Related States VEVE Conservation laws
 arterial venous Pulmonary peripheral Lungs, F p, R p QrQr QlQl H Related States VEVE Conservation laws")
90
Persistent mysteries Physiological variability and homeostasis Cryptic variability from cells to organisms to ecosystems to economies Statistical mechanics and thermodynamics Turbulence (coherent structures in shear flows) Network (cell, brain, Internet,…) architecture Unified communications, controls, computing Poor treatment of dynamics, robustness, complexity
 Network (cell, brain, Internet,…) architecture Unified communications, controls, computing Poor treatment of dynamics, robustness, complexity")
Similar presentations


