Download presentation
Presentation is loading. Please wait.

1
Strategic Directions in Port State Control Benefits of Assessing Ship Risk Chris Barnes Maritime Operations www.amsa.gov.au

2
Annual Shipping Activity in Australia

3
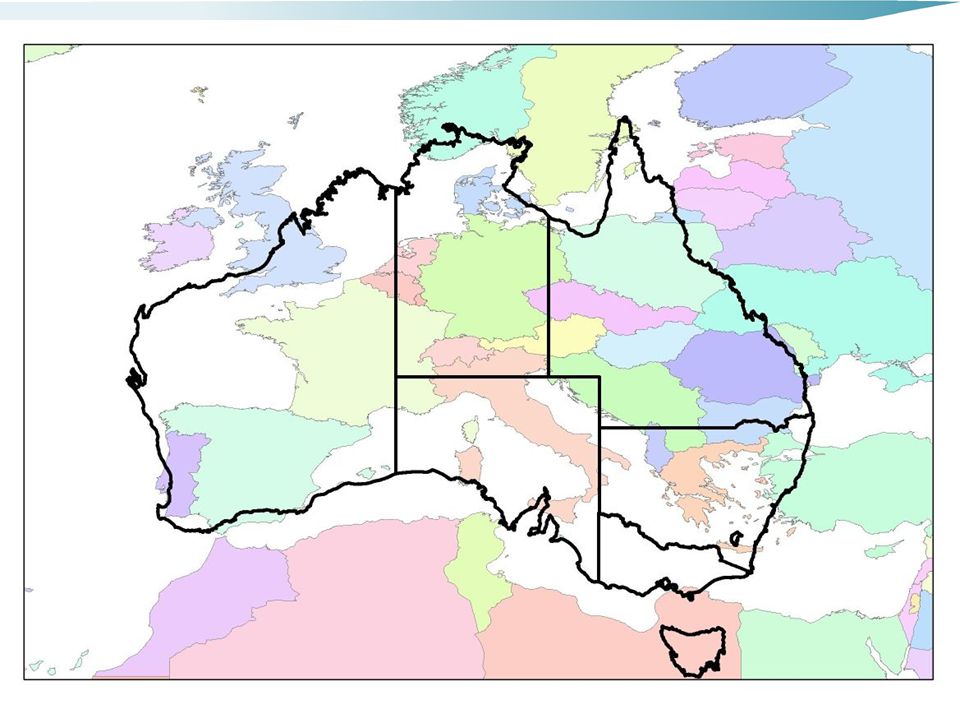
Very Large Geographical Coverage

5
The Challenge: 21,000 arrivals by 3,700 foreign-flag ships each year at 70 ports (some locations difficult to access, others experiencing rapid growth) Finite resources –40 Marine Surveyors at 14 Major Ports Wide range of responsibilities –PSC/FSC, cargo inspections, marine qualifications, ISM audits Need to apply resources effectively Maritime Industry is second most incident-prone industry on earth
 Finite resources –40 Marine Surveyors at 14 Major Ports Wide range of responsibilities –PSC/FSC, cargo inspections, marine qualifications, ISM audits Need to apply resources effectively Maritime Industry is second most incident-prone industry on earth")
6
Risk Management Concerns AMSA had comprehensive records of more than 20,000 PSC inspections –Knew a lot about ships inspected, but –Did not have data to provide a national overview of industry operating patterns and of ships not inspected –Profile and nature of Risk represented by shipping industry was largely unknown Did not have a clear view as to whether the inspection effort was correctly focussed on higher risk ships

7
Strategies Redevelop Information Systems to record port arrivals Allocate objective risk indicators to arriving ships Use ship risk as a guide in selection for inspection Adopt performance measures that reflect risk Seek to focus safety surveillance effort on higher risk ships and, if appropriate, undertake inspections at most convenient port

8
Review of Best Practice Considered strategies in use by Paris MoU and USCG –Degree of statistical analysis applied by Paris MOU was not clear Factors other than Flag appeared likely to be highly relevant as indicators or lack of seaworthiness European experience with certain Flags was not repeated in Australia –USCG Qualships 21 program appeared to have some limitations AMSA had detained several “Qualships”

9
Ship Risk Assessments Undertook preliminary statistical analysis in-house –Results and subsequent trial were very promising Commissioned full statistical analysis of data to identify and rank ship characteristics with predictive value in relation to likelihood of being unseaworthy

10
Statistical Analysis Must be objective and thorough Aim to test many ship characteristics to determine which ones are valid indicators of seaworthiness Having found those factors that prove to be useful indicators of probability of detention –rank them in order of importance and –estimate their relative importance

11
Methodology Consultants used Logistic Regression techniques, to see which of many possible ship characteristics were statistically significant indicators of the probability of a ship being found to be unseaworthy at a PSC inspection. –ranked these factors by importance and indicated relative importance Logit(p) = Log e p 1-p
 = Log e p 1-p.")
12
Ship Risk Models As bulk carriers represented 62% of ships and 40% of port visits, these ships were analysed separately from other ship types These 2 models were used in AMSA’s database to allocate a “Risk Factor” to all ship arrivals Testing with “rolling timeframes” showed variations and trends from year to year –model based on most recent 5 years data proved best

13
Specific Findings in 2002 Analysis on Indicators of Seaworthiness Bulk Carriers Ship Age Previous Insp No. Defs Flag Gross Tonnage Inspection time gap Whether 1 st Insp Other Ship Types Ship Age Ship type Whether 1 st Inspection Previous Insp No. Defs Time since Special Surv Gross Tonnage Flag, Recognised Org Importance: 1 2 3 4 Could be ignored Some of the least important factors could be ignored in the final model, as they made little contribution.

14
How Risk Indicators were Used Arriving ships were allocated a “Risk Factor” to assist in selection for PSC The “Risk Profiles” of ship arrivals were identified, nationally and for each port –These risk profiles were used to consider level of Surveyor resources needed at each AMSA Office Adopted Key Performance Indicators based on Ship Risk –Focus of inspections on higher risk ships –Priority for inspection based on risk

15
Port Arrivals Screen

16
Risk Profile Trends over Time

17
How Useful? Higher Risk Factor >>> deficiencies are more likely

18
How Useful? Higher Risk Factor >>> more deficiencies found

19
How Accurate? AMSA - Actual vs Predicted PSC Detention Rate for the 3 years to September 2006 0% 2% 4% 6% 8% 10% 12% 14% 16% 18% 0123456789101112131415>15 Risk Factor on Arrival Actual Detention Rate Predicted Detention Rate Actual Outcome A Risk Factor of 10 means that there is a 10% probability that the ship will be detained at PSC inspection

20
How Successful?

21
Risk Profile by AMSA Office

22
Benefits Recording all port arrivals and identifying ship risk greatly improved AMSA’s ability to regulate the Maritime Industry in an effective manner –Provided an overall view of the foreign-flag fleet (ships inspected and those not inspected) –Ship risk profiles and trends, overall and by port –Growth rates and risk profiles by port (to assist planning) –Much better understanding of industry One third of foreign flag ships visiting in a year did not visit in the previous year Over one quarter of ships make only a single visit in a year (little opportunity to inspect) More than half of world fleet of Capesize bulk carriers visit Australia each year.
 –Ship risk profiles and trends, overall and by port –Growth rates and risk profiles by port (to assist planning) –Much better understanding of industry One third of foreign flag ships visiting in a year did not visit in the previous year Over one quarter of ships make only a single visit in a year (little opportunity to inspect) More than half of world fleet of Capesize bulk carriers visit Australia each year.")
23
Performance Measures: Inspection Rates by risk group - 2006 Risk Group Visits Eligible InspsPort Visit Eligible ShipsShip Insp VisitsInsp Rate Ships Inspected Rate A high 6526 1329108081.3% 852 817 96% B medium high 3767 1220 72259.2% 737 605 82% C medium 5318 1899 75039.5% 891 637 71% D low 5182 2381 52522.0% 944 479 51% Totals20793 6829307745%34242538 74% Port visit basisUnique ship basis

24
Inspection Priority Based on Risk Eligible Visit No.A highB medium highC medium lowD low All risk risk risk risk ships 0 1.9% 0.6% 1.1% 0.8% 1.2% 186.1% 70.9% 56.2%49.5% 69.0% 2 9.8% 21.5% 24.3%21.0% 18.0% 3 1.6% 6.0% 11.5%14.7% 7.2% 4 0.6% 1.0% 3.7% 5.7% 2.3% 5 0.0% 0.0% 2.1% 4.4% 1.3% 6 0.0% 0.0% 0.8% 1.0% 0.4% 7 0.0% 0.1% 0.0% 1.7% 0.3% 8 0.0% 0.0% 0.1% 0.4% 0.1% 9 0.0% 0.0% 0.0% 0.8% 0.1% 10 0.0% 0.0% 0.0% 0.2% 0.0% Totals100% 100% 100%100% 100%

25
Recent Developments Clear and significant benefits of Statistical Risk Management in several ways prompted AMSA to adopt further strategies –Update and extend PSC statistical analysis –Adopt inspection rate targets based entirely on risk assessments –Revise related performance measures

26
Aims of Further Analysis Analyse more recent data –See if risk indicators are still valid or whether one or more new indicators should be adopted and/or some dropped –See if there are objective links between ship operator and seaworthiness –Undertake detailed analysis of deficiencies to see what relationships or trends can be identified Identify links between deficiency types and ship types over time –Possibility of PSC inspection checklists tailored to ship type and risk profiles Consider deficiencies by nature (eg: Operational, Structural/Equipment, ISM or Human Factor

27
Findings of Updated Analysis Some change with indicators of risk –evolutionary rather than major changes A few ship operators are clearly high or low risk –Limitation is that there are many operators, but relatively few have had sufficient inspections to allow a statistically-valid risk assessment Less than 5% of operators can be graded as being high or low risk – most are average risk

28
Ship Operator Risk Analysis allowed AMSA to determine the risk profile of a given Operator’s fleet of ships This produced an expected detention rate for that operator’s fleet which could then be compared to the actual detention rate for that operator Where actual detention rates were clearly much more or much less than the expected rate the operator could be categorised as high or low risk respectively.

29
New Inspection Rate Targets Success of objective statistically-based risk assessments justified change to a full risk basis for setting inspection rate targets 5 Priority Groups have been specified –SH: for single hull tankers - 100% inspection rate –P1: where Risk Factor is >5 80% rate –P2: where Risk Factor = 4 or 5 60% rate –P3: where Risk Factor = 2 or 3 40% rate; and –P1: where Risk Factor = 0 or 1 20% rate Ships below 5 years of age eligible every 12 months if they have no deficiencies

30
Distribution of Foreign-Flag Ships by Inspection Priority Priority 4 47% Priority 3 26% Priority 2 11% Priority 1 16%

31
2007 Risk Indicators Bulk Carriers Ship Age Previous Insp No. Defs Inspection time gap Recognised Org. Flag Whether 1 st Insp Gross Tonnage Other Ship Types Ship Age Ship Type Gross Tonnage Flag Previous Insp No. Defs Inspection time gap Whether 1 st Insp Recognised Org Time since Special Survey Importance: 1 2 3 4 No longer useful:

32
Analysis of PSC Deficiencies Hundreds of deficiency descriptions across 25 categories –Many deficiency types are little used –Some are recent additions with little history –Some are specific to certain ship types AMSA grouped the many deficiencies into four main types to assist with analysis –Operational –Structural/Equipment –Human Error –ISM

33
25>25 Ship Age at Inspection Average Deficiencies per Inspection OperationalHuman FactorStructuralISM Incidence of Main Deficiency Categories

34
Deficiency Analysis Aim is to be able to identify probability of particular deficiency types occurring –according to the age & type of a given ship –other characteristics could also be relevant Need to be careful that Surveyors do not become too narrowly focussed and still look for other deficiency types, however.

35
Summary Recording Port Arrivals and Assessing Ship Risk of detention has resulted in major positive outcomes: –Much better understanding of Maritime industry operating patterns –Improved focus on higher risk ships –Demonstrated rapid PSC response for higher risk ships –Better geographical positioning of resources –Able to produce wide variety of useful reports –In short: many strategic benefits

36
Questions?

Similar presentations
 in.>")


 Palestine Poverty Maps 2009 March - 2013.>")


 - implications/issues SSY Monte Carlo Tanker Event, 2000.>")
 New York, February,>")


 Collaborative PIP: Medication Review Tuesday, October 29, 2013 Presenter: Christi Melendez, RN, CPHQ Associate Director, PIP.>")