Download presentation
Presentation is loading. Please wait.

1
© Harry Campbell & Richard Brown School of Economics The University of Queensland BENEFIT-COST ANALYSIS Financial and Economic Appraisal using Spreadsheets Ch. 4: Project and Private Benefit-Cost Analysis

2
Private Benefit-Cost Analysis Deriving ‘Project’ and ‘Private’ cash flows: Project cash flow refers to cash flow for the overall project At market prices Irrespective of who gains or loses.

3
Private Cash Flow at market prices Private cash flow refers to cash flow to the individual investor engaged in project. after allowing for loan service costs after payment of profits taxes

4
Deriving Private Cash Flow To derive private cash flow, we begin by calculating overall project cash flow. Debt/financing inflows and outflows to creditors Taxes paid to government We then subtract from the project cash flow:

5
Cash Flow on Equity The private cash flow is the cash flow on the investor’s own funds or ‘equity’. Project cash flow minus debt cash flow = cash flow on equity (before tax). Cash flow on equity is the residual: what is left over after servicing debt.
. Cash flow on equity is the residual: what is left over after servicing debt..")
6
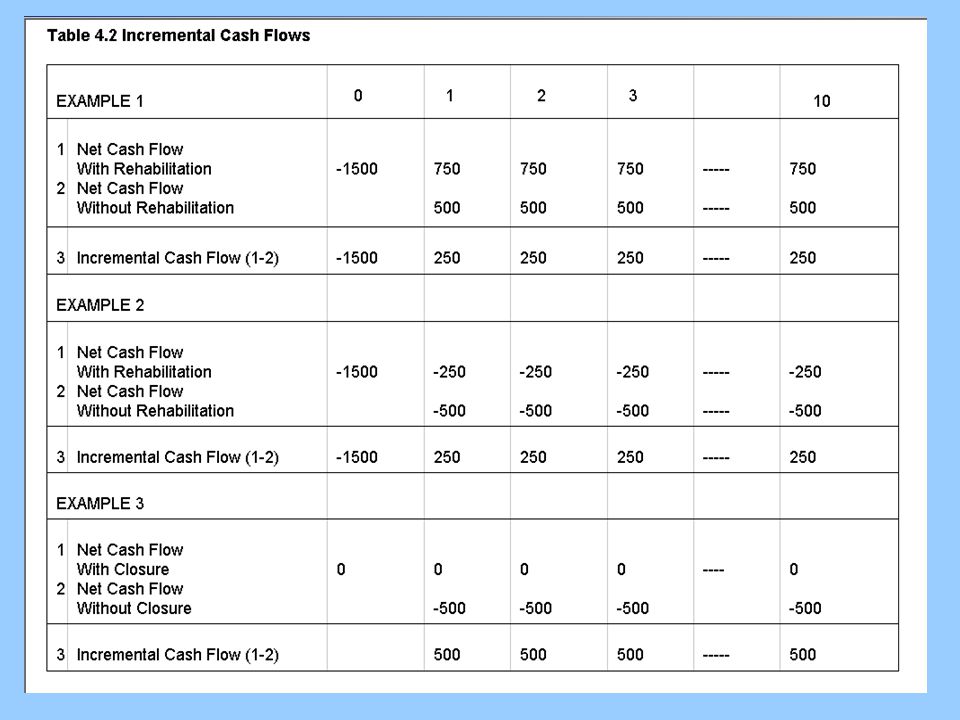
Deriving Project Cash Flow To derive project cash flow we need to be mindful of some important concepts and conventions: Inflation: usual to use constant prices with a real discount rate (otherwise, nominal prices with nominal interest rate). See table 4.1. Incremental rather than total cash flow: ‘with project’ less ‘without project’ cash flow. See table 4.2.

9
Deriving Project Cash Flow Interest on debt excluded from cost to avoid double counting. Depreciation excluded from cost to avoid double counting. (See table 4.3) Changes in working capital appear under investment costs at the beginning and end of the project. (See table 4.4)
 Changes in working capital appear under investment costs at the beginning and end of the project. (See table 4.4).")
11
Debt Financing Cash Flow To derive debt financing flow, for each period, from the borrower’s perspective, begin with project cash flow, then: Add all loan receipts in each period Subtract all interest payments in each period Subtract all principal repayments in each period

12
Private Cash Flow (Equity) To derive private cash flow, for each period, before tax: Add debt financing flow to project cash flow. (See table 4.5)
.")
14
Project = Debt + Equity Cash flow from the perspective of lenders and investors adds up to Project Cash Flow. (See table 4.6)
.")
15
Deriving IRR on Equity We can calculate IRR on each ‘component’ of cash flow: project, debt and equity. First, calculate IRR on Project Cash Flow: when NPV = 0 -5000 (1.0) + 1000(AF 10 ) = 0 AF 10 = 5000/1000 = 5 IRR= 15%
 (AF 10 ) = 0 AF 10 = 5000/1000 = 5 IRR= 15%.")
16
Deriving IRR on Equity Second, calculate IRR on Debt Financing Cash Flow: when NPV = 0 3512(1.0) - 500(AF 10 ) = 0 AF 10 = 3512/500 = 7.024 IRR= 7%
 - 500(AF 10 ) = 0 AF 10 = 3512/500 = IRR= 7%")
17
Deriving IRR on Equity Third, calculate IRR on Equity Cash Flow: when NPV = 0 -1488(1.0) + 500(AF 10 ) = 0 AF 10 = 1488/500 = 2.976 IRR= 31%
 + 500(AF 10 ) = 0 AF 10 = 1488/500 = IRR= 31%")
18
Gearing and Debt: Equity Ratio IRR on Equity + IRR on Debt = Project IRR Project IRR minus IRR on Debt = IRR on Equity –By changing the ratio of debt to equity, you can change the IRR on equity, given the Project IRR and IRR on debt.

19
An Example of Gearing Assume debt:equity is $60:$40 Assume Project IRR = 10%, and, cost of debt = 5% –What is the IRR on equity? HINT: IRR on Debt + IRR on Equity = Project IRR

20
An Example of Gearing IRR on project = 0.6(IRR on debt) + 0.4(IRR on equity) 10% = 0.6(5%) + 0.4(x%) 0.4(x%) = 10% - 3% IRR on equity = x% = 7/0.4 = 17.5%
 + 0.4(IRR on equity) 10% = 0.6(5%) + 0.4(x%) 0.4(x%) = 10% - 3% IRR on equity = x% = 7/0.4 = 17.5%")
21
More Gearing IRR on project = 0.8(IRR on debt) + 0.2(IRR on equity) 10% = 0.8(5%) + 0.2(x%) 0.2(x%) = 10% - 4% IRR on equity = x% = 6/0.2 = 30%
 + 0.2(IRR on equity) 10% = 0.8(5%) + 0.2(x%) 0.2(x%) = 10% - 4% IRR on equity = x% = 6/0.2 = 30%")
22
Implications of Gearing If an investor can borrow on concessional terms, a ‘bad’ project can appear ‘good’. If an investor borrows on unfavourable terms, a ‘good’ project might appear ‘bad’.

23
Calculating After Tax Cash Flow Some items of project cost that do not enter into a project's cash flow directly affect the net cash flow indirectly through their effect on the project's taxable profits. The analyst needs to prepare a separate statement to calculate the project's taxable profits. The two items that are not part of the project’s cash flow that enter into the calculation taxable profits are: – depreciation – interest on debt

24
Calculating After Tax Cash Flow These should be added to the operating costs in the project cash flow for the purpose of calculating taxable profits. Taxes due are then calculated as some % of taxable profits and are deducted from the private cash flow to derive the after tax private cash flow.

25
Calculating Taxes It should be noted that tax laws vary from one country or state to another. In most cases, losses can be written off profits earned elsewhere or of future profits. This implies that there could be negative taxes in some project years.

26
To Summarise equals private cash flow (on equity after tax) Project cash flow minus debt finance minus taxes
 Project cash flow minus debt finance minus taxes")
27
Using Private BCA Why would the project analyst who is concerned with the wider public or social interest be concerned with the return on private equity? –When the private investor is one of the stakeholder’s whose gains are part of the ‘Referent Group’ net benefits. –Because the policy maker needs to know what is ‘in it’ for the investor: need incentives or tax concessions? etc

28
Distribution of Net Benefits The project net benefits (at market prices) can be disaggregated among three stakeholder groups: –equity holders (private or public sector) –lenders –recipients of taxes (government)
 can be disaggregated among three stakeholder groups: –equity holders (private or public sector) –lenders –recipients of taxes (government)")
29
Shares of Project’s Capital

30
Shares of Project’s Net Benefits (hypothetical)
")
31
Distribution of Net Benefits At a later stage we will be looking at the distribution of all project net benefits among stakeholders, including those not included in the project’s net benefits at market prices. At this stage it is still useful to distinguish between Referent Group and Non-Referent Group Net Benefits.

32
Distribution of Project Benefits

33
NFG Case Study: Project & Private

Similar presentations


 Chapter 16.>")


