Download presentation
Presentation is loading. Please wait.

1
McGraw-Hill/Irwin Copyright © 2005 by The McGraw-Hill Companies, Inc. All rights reserved. Chapter 12 Incentive Pay

2
Outline of chapter 12 Piece rate and time rate Tournaments Policy application: The compensation of executive Work incentive and delayed compensation Efficiency wages

3
Spot labor market In each period, firms decide how many workers to hire at given wages; worker decide how many hours to work; and the interaction of workers and firms determine the equilibrium wage and employment. Once the market shouts out the equilibrium wage, workers and firms make the relevant labor supply and labor demand decisions. In these spot labor market, the wage equals the worker’s value of marginal product.

4
Incentive pay A compensation package designed to elicit particular levels of effort from the worker, as yet another tool it can use to increase its profit. Labor market contract matters because employers often do not know the workers’ true productivity and workers would like to get paid a high salary while putting in as little effort as possible.

5
Piece rates and time rates Piece rate system compensates the worker according to some measure of worker’s output: garment worker, salespersons Time rate system depends only on the number of hours the worker allocates to the job and nothing to do with the number of units the worker produces, at least in the short-run.

6
12-6 Pay Systems: Piece rates Piece rates are used by firms when it is cheap to monitor the output of the workers. Piece-rate compensation systems attract the most able workers and elicit high levels of effort from these workers. Workers in these firms, however, may stress quantity over quality, and may dislike the possibility that incomes fluctuate significantly over time.

7
12-7 The Allocation of Effort by Piece-rate Workers Dollars q*q* r Output q ABLE MR MC MC ABLE The piece rate is r dollars, so the marginal revenue of an additional unit of output equals r. The worker gets disutility from producing output, as indicated by the upward-sloping marginal cost of effort curve. The level of effort chosen by a piece-rate worker equates marginal revenue to marginal cost, or q * units. If it is easier for more-able workers to allocate effort to their jobs, they face lower marginal cost curves and produce more output.

8
12-8 Pay Systems: Time Rates Time rates are used by firms when it is costly or impossible to monitor the output of workers

9
12-9 Effort and Ability of Workers in Piece-Rate and Time-Rate Jobs Utility r Ability Piece-Rate Workers Time-Rate Workers Worker B Worker A x*x* All workers, regardless of their abilities, allocate the same minimal level of effort to time- rate jobs. Because more-able workers find it easier to allocate effort, they will allocate more effort to piece-rate jobs and will have higher earnings and utility. Workers with more than x * units of ability sort themselves into piece-rate jobs, and less-able workers choose time-rate jobs.

10
Piece rate and time rate Piece rate workers earn more than time rate workers both because of differences in ability and because piece-rate workers simply work harder Because w worker’s innate ability is unobserved, it is often difficult to determine if the wage gap is due to ability difference or to the incentive effects of a piece-rate system.

11
Disadvantages of using s piece- rate system Team work Overemphasize the quantity of output Fluctuations in income Ratchet effect: a piece-rate worker produce more than expected would be interpreted as doing an easy job and they are paid too much.

12
Bonuses, profit sharing and team incentives Bonuses are payments awarded to workers above and beyond the base salary and are typically linked to the worker’s performance. Profit sharing redistributes part of the firm’s profits back to the workers.

13
12-13 Tournaments Some firms award promotions on the basis of the relative ranking of the workers. A tournament might be used when it is cheaper to observe the relative ranking of a worker than the absolute level of the worker’s productivity. Workers allocate more effort to the firm when the prize spread between winners and losers in the tournament is very large. A large prize spread, however, also creates incentives for workers to sabotage the efforts of other players.

14
Tournaments Example: amateur and professional sports, ice skating, chief executive officer (CEO) The compensation package are determined by relative performance, rather than by absolute performance
 The compensation package are determined by relative performance, rather than by absolute performance")
15
tournament Tournaments exist because they elicit the “right” amount of effort from workers when it is difficult to measure a worker’s actual productivity but it is easier to contrast the productivity of one worker with that of another.

16
12-16 The Allocation of Effort in a Tournament Dollars Effort MC A MR HIGH Y X MR LOW F high F low The marginal cost curve gives the “pain” of allocating an additional unit of effort to a tournament. If the prize spread between first and second place is large, the marginal revenue to an additional unit of effort is very high (MR HIGH ) and the worker allocates a lot of effort to the tournament.
 and the worker allocates a lot of effort to the tournament..")
17
Disadvantages of using tournament Collude Too much competition have the incentive to reduce the chances that other players win the prize

18
Policy Application: Compensation of CEOs The principal-agent problem (agent: CEO, principal: owners) The inevitable conflict between the interests of the principals and the interests of the agent
 The inevitable conflict between the interests of the principals and the interests of the agent")
19
12-19 Policy Application: Compensation of CEOs The wage gap between the first and the second place is larger as the number of potential competitors increase. There is a positive correlation between the compensation of CEOs and the performance of the firm, but the correlation is weak. It is unlikely, therefore, that CEOs have the “right” incentives to take only those actions that benefit the owners of the firm.

20
12-20 Work Incentives and delayed Compensation Upward-sloping age-earnings profiles might arise because delaying the compensation of workers until later in the life cycle encourages them to allocate more effort to the firm. A delayed-compensation contract also implies that at some point in the future the contract must be terminated, thus explaining the existence of mandatory retirement in the labor market.

21
12-21 The Worker Is Indifferent Between a Constant Wage and an Upward-Sloping Age-Earnings Profile Earnings C D B A 0 N t*t* Years on the Job VMP If the firm could monitor a worker easily, she would get paid her constant value of marginal product (VMP) over the life cycle. If it is difficult to monitor output, workers will shirk. An upward-sloping age- earnings profile (such as AC) discourages workers from shirking. Workers get paid less than their value of marginal product during the first few years on the job, and this “loan” is repaid in later years.
 discourages workers from shirking. Workers get paid less than their value of marginal product during the first few years on the job, and this loan is repaid in later years..")
22
Do delayed-compensation contracts elicit more effort? Firms renege. (reputation problem) Firms go out of business Delayed-compensation contracts tend to be observed in large and established firms Delayed-compensation contract provides the explanations for an upward-sloping age-earning profile within a job (human capital model also provide explanation) and the explanation for the long-term “marriage” exists between firms and workers.
 Firms go out of business Delayed-compensation contracts tend to be observed in large and established firms Delayed-compensation contract provides the explanations for an upward-sloping age-earning profile within a job (human capital model also provide explanation) and the explanation for the long-term marriage exists between firms and workers..")
23
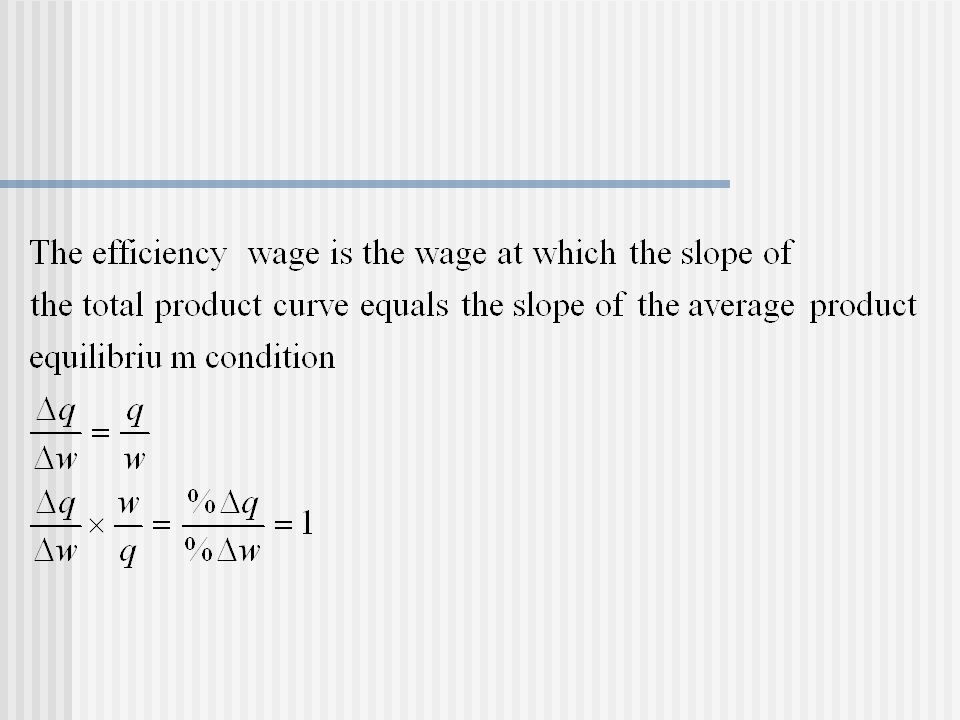
12-23 Efficiency Wages Some firms might want to pay wages above the competitive wage in order to motivate the work force to be more productive. The efficiency wage is set such that the elasticity of output with respect to the wage is equal to 1. Efficiency wages create a pool of workers who are involuntarily unemployed.

24
Setting Efficiency wage Efficiency wage: where the MC of increasing the wage exactly equals the marginal gain in the productivity of the firm’s workers.

25
12-25 The Determination of the Efficiency Wage Output qeqe q Z X Y Wage wewe 0 w Total Product Curve The total product curve indicates how the firm’s output depends on the wage the firm pays its workers. The efficiency wage is given by point X, where the marginal product of the wage (the slope of the total product curve) equals the average product of the wage (the slope of the line from the origin). The efficiency wage maximizes the firm’s profits.
 equals the average product of the wage (the slope of the line from the origin). The efficiency wage maximizes the firm’s profits..")
27
End of Chapter 12 McGraw-Hill/Irwin Copyright © 2005 by The McGraw-Hill Companies, Inc. All rights reserved.

Similar presentations


 Effort, Productivity, and Pay.>")


. The Labor Market Labor markets determine –Terms of employment Earnings versus total compensation Working conditions –Levels.>")


