Download presentation
Presentation is loading. Please wait.

1
Pending: Major Grade Project Due Friday Due Friday: 11/02/2012 – 3:45 1.Create your own layered anatomical presentation (2D or 3D [3D + 10 overall]) 2.All systems/layers/anatomical parts must be labeled. 3.All 2D presentations must be drawn well and in color, not printed, and at least 8 x 11. 4.Kingdom through species must be included.
![Pending: Major Grade Project Due Friday Due Friday: 11/02/2012 – 3:45 1.Create your own layered anatomical presentation (2D or 3D [3D + 10 overall]) 2.All systems/layers/anatomical parts must be labeled.](http://images.slideplayer.com/15/4634433/slides/slide_1.jpg "3.All 2D presentations must be drawn well and in color, not printed, and at least 8 x Kingdom through species must be included..")
2
Pending: Major Grade Project Due Friday Due Friday: 11/02/2012 5. Your choices are: sea star, brittle/serpent sea star, sea urchin, sea cucumber, anemone, jellyfish, coral, turbellaria (platyhelminthes), bivalve mollusk, gastropod, or proifera 6. Additional information that is required: –Where do you find this organism? –What is its niche? –What are its defense mechanisms?
, bivalve mollusk, gastropod, or proifera 6. Additional information that is required: –Where do you find this organism. –What is its niche. –What are its defense mechanisms .")
3
Pending: Major Grade Project Rubric Due Friday: 11/02/2012 All systems are present & labeled – 60 points The drawing/presentation is neat & in color – 10 points Kingdom through species is labeled & correct – 10 points #6 Answered correctly & in complete sentences – 20 points

4
Don’t start changing your water yet! Please take a seat

5
If you failed this exam: Keep in mind that the exams get harder from here. 90% of the questions on this exam were taken directly from a quiz. To study: Fill out the review Used the completed review to go over the quizzes If you still have questions over the quizzes, e-mail your questions to me (not the night before an exam). In class: Download the notes to your phone, print them out from consolaquatic.com (@consolaquatic) It is your job to ask for help. I will not chase you down to give you help. You must be an advocate for your own education.
. In class: Download the notes to your phone, print them out from consolaquatic.com It is your job to ask for help. I will not chase you down to give you help. You must be an advocate for your own education..")
6
Exam Data: 2013-2014 6 th : A – 3 B – 4 C – 4 D – 0 F – 4 4 th : A – 9 B – 7 C – 5 D – 1 F – 3 3 rd : A – 6 B – 5 C – 6 D – 1 F – 6 5 th : A – 4 B – 8 C – 6 D – 1 F – 2

7
Exam Data: 2013-2014 3 rd : 76.92 Exam Average, 71.10 Class Average 4 th : 79.96 Exam Average, 76.13 Class Average 5 th : 78.55 Exam Average, 78.72 Class Average 6 th : 75.40 Exam Average, 71.52 Class Average

8
Most-Missed Questions One parasitic worm has had a significant role in shaping human history. It is known as the “Biblical Worm” based on its Old Testament connection with the restrictions on eating swine. This worm is connected with painful & aching muscles in consumed by humans and is called: a)Ascaris b)Platyhelminthes c)Vibrio cholera d)Trichinella
Ascaris b)Platyhelminthes c)Vibrio cholera d)Trichinella.")
9
Most-Missed Questions Which of the following makes up the smallest percent of global freshwater: a)Surface & atmospheric water b)Groundwater c)Permafrost d)Glaciers
Surface & atmospheric water b)Groundwater c)Permafrost d)Glaciers")
10
Most-Missed Questions Which of the following is NOT released by hydrothermal vents: a)Thermal energy b)Tube worms c)Calcium ions d)Cadmium & iron (ferrous) ions
Thermal energy b)Tube worms c)Calcium ions d)Cadmium & iron (ferrous) ions")
11
Most-Missed Questions Which of the following is FALSE about thermal pollution: a)Thermal pollution is often a result of using water sources to cool water/equipment associated with power plants b)An increase in temperature causes an increase in bacterial growth c)An increase in temperature yields an increase in secondary consumers d)An increase of temperature causes a decrease in DO
Thermal pollution is often a result of using water sources to cool water/equipment associated with power plants b)An increase in temperature causes an increase in bacterial growth c)An increase in temperature yields an increase in secondary consumers d)An increase of temperature causes a decrease in DO")
12
Most-Missed Questions Prochlorococcus are probably the most important phytoplankton found in our oceans. Recent samples have shown that the concentration of these organisms is decreasing with the increase in global temperature & decrease in ocean pH. All of the following are likely results of this population decline EXCEPT: a)The concentration of dissolved oxygen will increase b)The primary production within the oceans will decrease c)The concentration of atmospheric carbon dioxide will increase d)The populations of organisms higher in the food chain will decrease
The concentration of dissolved oxygen will increase b)The primary production within the oceans will decrease c)The concentration of atmospheric carbon dioxide will increase d)The populations of organisms higher in the food chain will decrease.")
13
Bellwork: 10/19/2011 Change 10% of your tank water if your water is clear, change 25% of your water if your water is cloudy Clear off your filters if they are obstructed & check your filters incase they need to be replaced (turn off the filter before checking). Make sure to scrub off the debris in the corners of your tank Clean off the tank lids

14
Aquatic Ecology

15
How do we study environments? Quadrant Studies: Tracking changes in a small section of the environment

16
How do we study environments? Sampling: Only measuring a small, random part of an environment

17
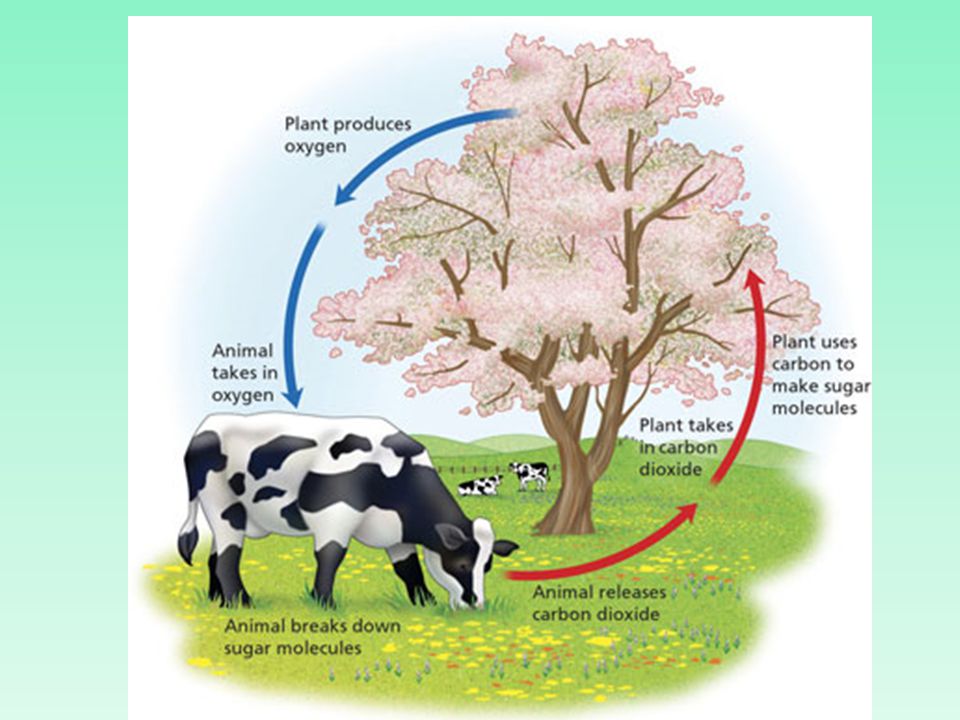
The Carbon Cycle

18
Carbon Cycle Carbon is found throughout the environment –Carbon is found in the atmosphere and in water as carbon dioxide (CO 2 ) –Carbon is found in organisms as organic molecules, like glucose (sugars) and fats –Carbon is found buried in the ground as fossil fuels
 –Carbon is found in organisms as organic molecules, like glucose (sugars) and fats –Carbon is found buried in the ground as fossil fuels")
19
Carbon Cycle Carbon is cycled, or moves 1)Atmosphere: Carbon is in the form of CO 2
Atmosphere: Carbon is in the form of CO 2")
20
CO 2

21
Carbon Cycle 2) Producers: Use photosynthesis to make sugars from CO 2 in the atmosphere (carbon is moved!)
 Producers: Use photosynthesis to make sugars from CO 2 in the atmosphere (carbon is moved!)")
22
C 6 H 12 O 6

23
Carbon Cycle 3) Consumers: Eat organic molecules and release CO 2 into the atmosphere during respiration, or die and go into the soil
 Consumers: Eat organic molecules and release CO 2 into the atmosphere during respiration, or die and go into the soil")
24
CO 2

26
Carbon Cycle 4) Soil: decomposers break down organisms, releasing carbon into the atmosphere OR trapping it in the ground (fossils)
 Soil: decomposers break down organisms, releasing carbon into the atmosphere OR trapping it in the ground (fossils)")
28
Carbon Cycle 5) Fossil Fuels: carbon from some dead organisms are trapped as fossil fuel until we burn it
 Fossil Fuels: carbon from some dead organisms are trapped as fossil fuel until we burn it")
29
Population Growth and Overpopulation

32
Populations Population: the number of organism from one species that live in a specific area –Examples: the human population in different cities, the squirrel population in a forest, the grass population in a meadow

33
Populations Populations are affected by many resources. These include: –The amount of food available in an area –The amount of sunlight (if it is a plant population) –The amount of water –The competition for food/shelter –The predators in an area
 –The amount of water –The competition for food/shelter –The predators in an area.")
34
Population Growth Graphs A: Slow growth as a population begins to grow Birth Rate > Death Rate

35
Population Growth Graphs B: Exponential growth as population grows rapidly Birth Rate > Death Rate

36
Population Growth Graphs C: Slow-down of growth as population maxes out its resources, like food, water, or light Birth Rate > Death Rate

37
Population Growth Graphs D: Population reaches the maximum number supported by environment, the carrying capacity Birth Rate = Death Rate

38
Carrying Capacity Carrying Capacity: the maximum number of organisms in a population that are supported by the environment

39
Population Growth Graphs Carrying Capacity Reaching Limit of Resources Exponential Growth, no limiting resources

40
Carrying Capacity Populations are typically limited by resources – They reach carrying capacity when there aren't enough resources to keep growing. – Birth Rate = Death Rate. – Logistic Growth!

41
Unlimited Growth If there are no limiting resources, populations grow exponentially. Birth Rate > Death Rate

42
Decline If population birth rate < death rate, the population will go down!

43
Which of the following graphs shows a population that is free of limiting factors?

44
Which of the following graphs shows a population that has reached carrying capacity?

45
How would a scientists determine the growth rate of a population? A.Birth Rate + Death Rate B.Birth Rate – Death Rate C.Birth Rate x Death Rate D.Birth Rate / Death Rate

46
What statement best describes the population shown in the graph below? A.Birth rate = Death rate B.Birth rate < Death rate C.Birth rate > Death rate D.Birth rate = 0

47
What statement best describes the population shown in the graph below at time “t”? A.Birth rate = Death rate B.Birth rate < Death rate C.Birth rate > Death rate D.Birth rate = 0

49
Predator vs Prey Predator and Prey populations can affect one another 1.As prey increases, predator will increase in response 2.As predators increase, prey will decrease 3.As prey decrease, predators will decrease

50
Bellwork: 10/18/2011 Draw/describe the different steps/phases of the carbon cycle.

51
Human Population and Impact

52
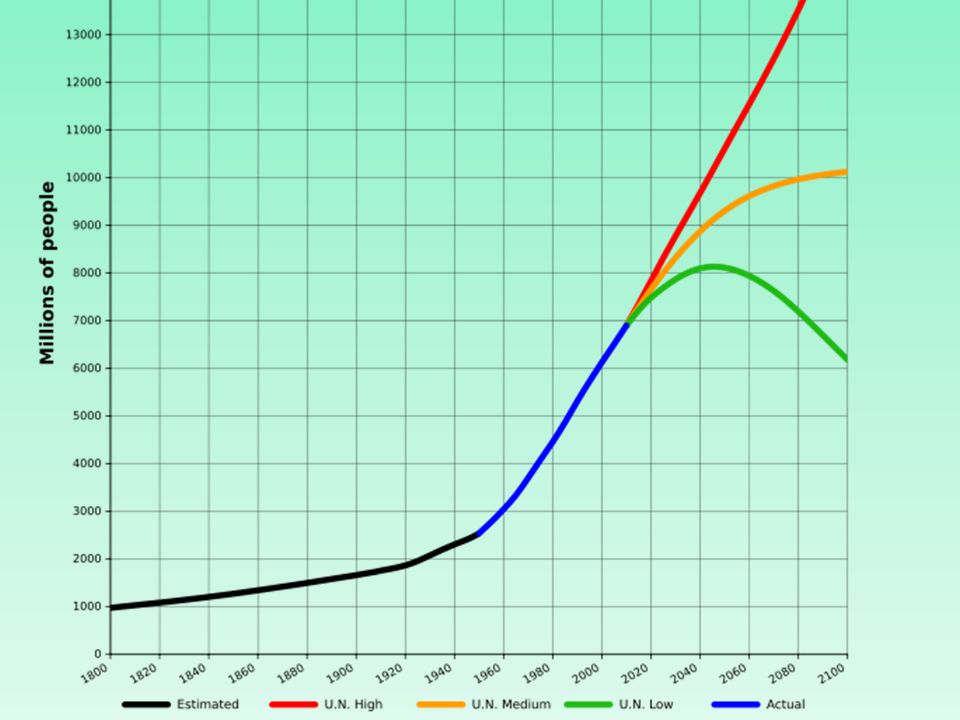
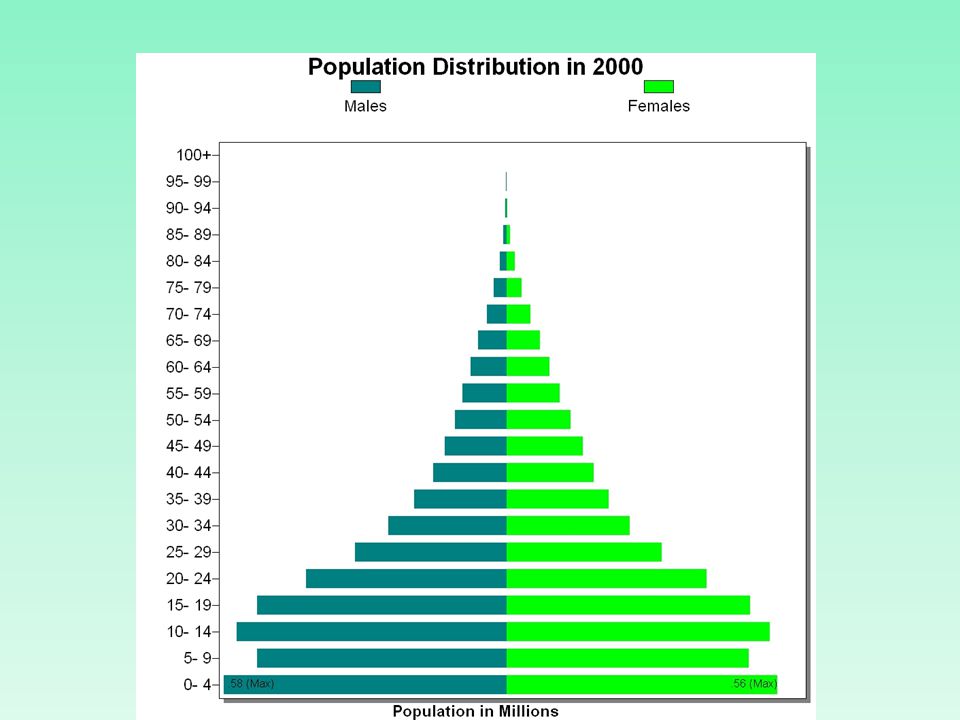
Human Population Human population is currently about 7.0 billion –Human population growth has been exponential

54
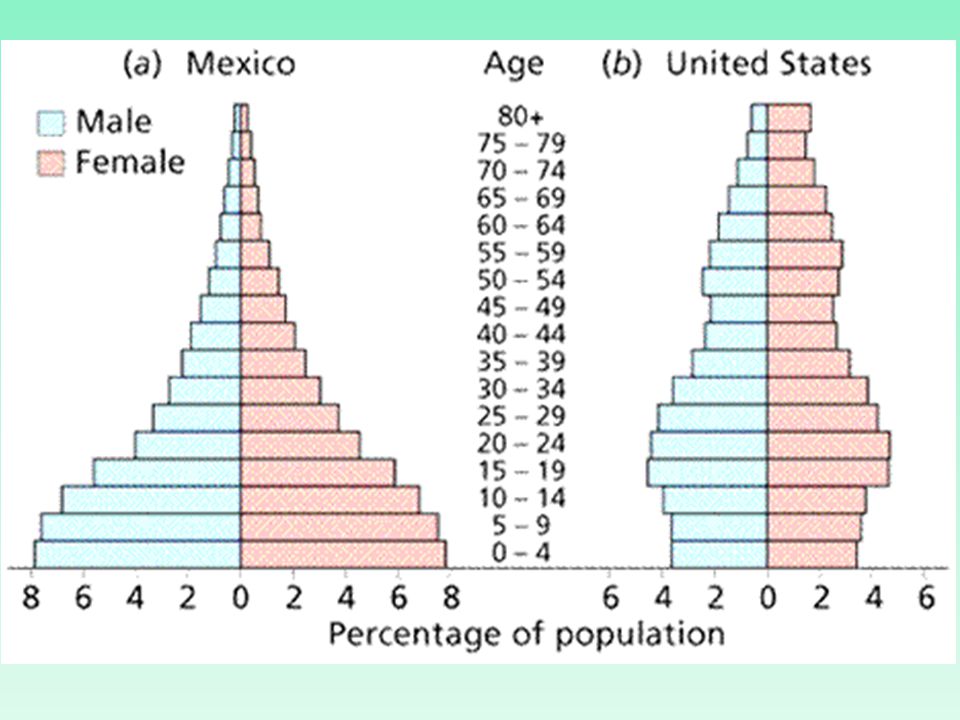
Population Pyramid Graphs Developing countries tend to have high growth rates, whereas developed countries tend to have stable growth. –Population age distribution Larger at the bottom = more future growth Equal at each age = stable growth or even decline

55
Population age distribution Larger at the bottom = more future growth Equal at each age = stable growth or even decline

58
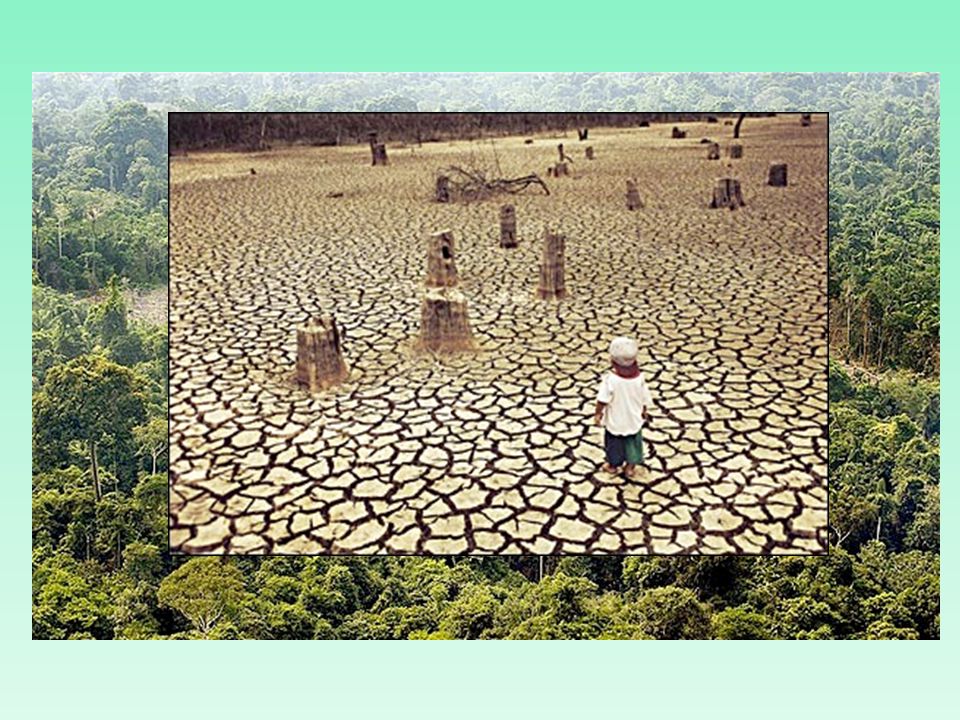
Overpopulation: The Bad The problems with overpopulation include abuse of resources: –Deforestation –Fossil Fuel Overuse –Freshwater Overuse –Pollution –Lack of adequate food –Non-native species

59
Deforestation Cutting down forests leads to a loss of biodiversity: not as many different species in an area –Can affect local food webs, other species, and even medicine!

61
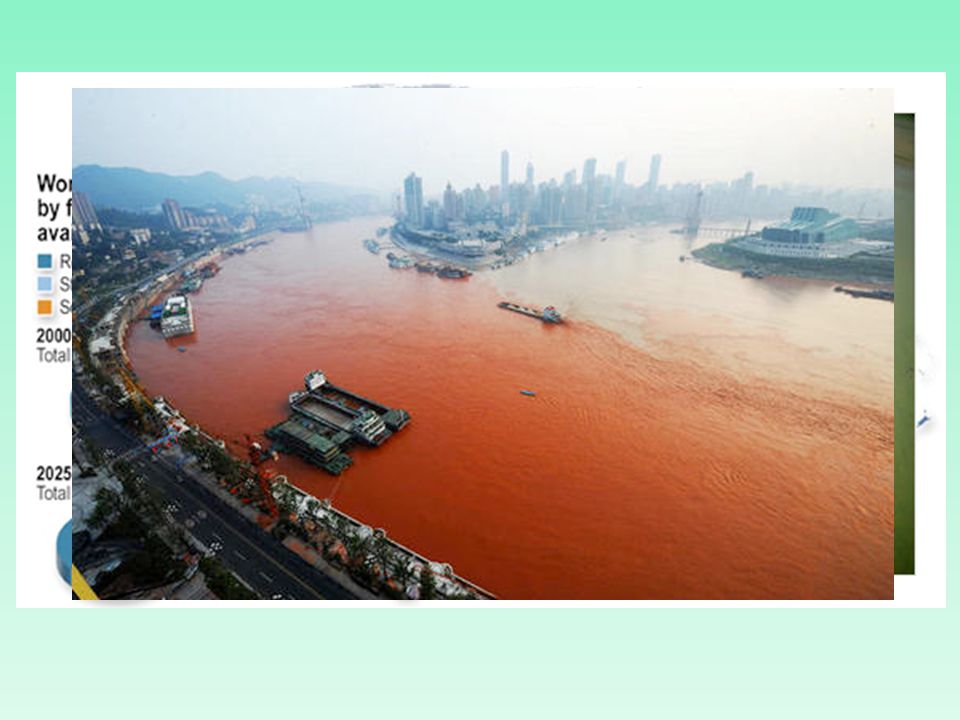
Freshwater Overuse Poor water quality, not enough freshwater in areas of need Polluted runoff from factories, farms, and intentional dumping

63
Pollution Acid rain: –Sulfur and nitrogen gases released from factories into the air –Sulfur dioxide: SO 2 –Falls in rain drops, slowly impacts pH of water, soil, etc.

65
Pollution Ozone Layer Destruction –CFCs: chlorofluorocarbons – released into the air through old refrigerator and spray cans, destroy ozone layer (Stratosphere). –Low ozone leads to high UV radiation –UV radiation: can cause skin cancer through mutation

67
Introducing Non-native species Putting species into new ecosystems that aren’t supposed to be there –The introduced species generally outcompete, or do better, than the native species. –Example: pythons in the everglades.

68
Characteristics of an invasive species Rapid growth & reproduction High dispersal ability Tolerance of a wide range of environmental conditions A generalist when concerning food Often associated with humans

74
Bellwork: 10/30/2012 1.List four features of an invasive species. Why are invasive species a problem for native ecosystems? 2.Define carrying capacity: 3.Why do scientists use quadrant studies?

75
Need to Take/Retake Unit #3’s Exam 1 st :3 rd :4 th :7 th : 100039550100023368100022852 (46)100033796 (52) 100023457 (54)100023439 (56)100023080100023549 (30) 100023003 (61)1000225505 th : 100038593 (42) 100037490 (57)100022560100023724 (63)100034582 100023053100028886100022932 (55)100023847 (62) 100023579 (47)100033248100023306100023530 100028564 (48)100023260 (42)100023606 (53)100023021 (56) 100023842 (48)100036042 (58)100038732 (68)100035662 100023643 (44)4 th : 100037899 (38)100023553 2 nd : 100023778 (56)100023446 (62) 100039794 (60)100022636 (58)100031594 100039185100023419 (67)100023474 (52) 100023258 (40)100028473 (68)100022646 (63) 100022959 (56)100038241100023136 100032208 (67)100011228 (60)100029541 (39)
 (52) (54) (56) (30) (61) th : (42) (57) (63) (55) (62) (47) (48) (42) (53) (56) (48) (58) (68) (44)4 th : (38) nd : (56) (62) (60) (58) (67) (52) (40) (68) (63) (56) (67) (60) (39)")
76
Two Aquatic Life Zones Salt Water or Marine Freshwater

77
Marine Estuaries –marshes –bogs –swamps Coastline –coral reefs –continental shelf Open ocean

78
Freshwater Surface water –lentic - swamps, bogs, marshes, lakes, ponds - standing water –lotic - streams, rivers and creeks - flowing water Wetlands Groundwater –aquifers –underground lakes

79
Aquatic Environments Light –Euphotic zone – zone of photosynthetic limitation –Heat – surface, middle and bottom layers Dissolved gasses –Oxygen – atmospheric and plant inputs – unlike atmosphere varies widely in aquatic ecosystems –CO2 – atmospheric and animal inputs – buffering of atmosphere and changes in aquatic ecosystems Nutrients –Availability with depth and water conditions

80
Saltwater Oceans cover 71% of earths surface Regulation of climate Stores of Carbon Dioxide and production of Oxygen 250,000 species of organisms

81
Life zones of the Ocean zones defined by amount of solar radiation penetrating the water zones (in order of declining solar radiation): –Coastal Zone –Open Sea euphotic zone bathyl zone abyssal zone
: –Coastal Zone –Open Sea euphotic zone bathyl zone abyssal zone")
82
Coastal Zone extends from high–tide mark to edge of continental shelf entirely within the euphotic zone & includes estuaries, wetlands, barrier islands, & coral reefs nutrient–rich & the site of most commercial fisheries high primary productivity: sunlight + nutrients from land & ocean currents

84
Rocky and sandy shores Intertidal zone – area of life between low and high tide Niches for life in harsh changing environment – sand on beaches and rocks on rocky shores Sand dunes – protection against storms

85
Open Ocean Euphotic zone most productive 90% of water surface but 10% of fish Specialized organisms near vents

86
Human impacts Development along coast 4.0 billion people live along or near the coast Earth has lost 50 % of coastal wetlands, US has lost 55% 37% of coastal fisheries closed due to pollution 10% of coral reefs lost, 30% in critical condition and about 30% stable Over 50% mangrove forests lost

87
Freshwater Dissolved salt concentrations less than 1% Covers 1% of earths surface 41% of fish species

88
Thermal Stratification of Lakes epilimnion: warm, upper layer of water thermocline: zone of lake where temperature changes rapidly with depth hypolimnion: colder, denser lower layer of water can be depleted of oxygen in eutrophic lakes

89
Overturn in Lakes upper layer of water sinks & winds mix layers redistributes oxygen & temperature evenly redistributes nutrients from the lower layers

90
Oligotrophic Lakes Oligotrophic – low nutrient supply – low primary productivity – clear water, few plants & fish

91
Eutrophic Lake Eutrophic – excess supply of nutrients – high primary productivity – murky water, large phytoplankton population

92
Stream Order Streams with no tributaries are 1 st order Two first order streams joining form a 2 nd order stream, etc. Entrance of smaller order tributaries does not change the order of a stream

93
Streams Headwaters – cold, well oxygenated waters with trout, algae and mosses and macroinvertebrates Transition – warmer water with gentler slopes and fewer obstacles – increase of phytoplankton with mixed warm and cool water fish Flood plain – deep rivers along flat broad valleys. Similar makeup to lakes

94
Wetlands Where streams meet lakes Provides food and habitats for fish, waterfowl and wildlife Filter toxics from water Reduce flooding by releasing water slowly Replenish groundwater supplies Important for recreation and hunting

95
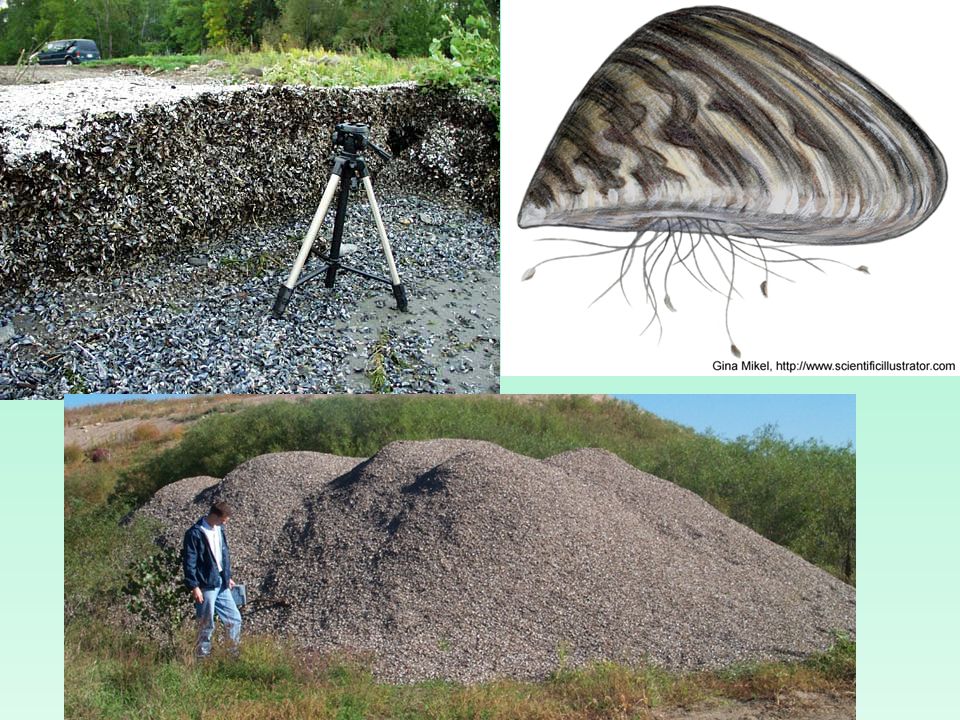
Dredging and filling of wetlands – mitigation banking of wetlands – not net loss Damming rivers Sedimentation Fish stocking and introductions – zebra mussels Human Impacts

96
Bellwork: 10/31/2012 1. When/how does lake overturn occur? What are the benefits of lake overturn?

97
In groups of 2: Draw & label a food web that includes the following: ProducersEpilimnion Primary ConsumersHypolimnion Secondary ConsumersNektonic Tertiary ConsumersPlanktonic Detrivores Benthic 1 st, 2 nd, 3 rd, and 4 th order stream Estuary Open ocean Euphotic Zone Abyssalpelagic/bathylpelagic

98
Bellwork: 10/31/2011 Change 10% of your tank water if your water is clear, change 25% of your water if your water is cloudy Make sure to scrub off the debris in the corners of your tank If you did not complete yesterday’s assignment, that must be completed by the end of class If you are not helping your group, you need to be working on your major grade project due Friday.

99
Bellwork: 10/21/2011 Collect the following data: Chlorine (Fresh water only) Salt Water Tanks Only: DO- Phosphate Turbidity- Salinity Nitrate- Calcium Nitrite- Water Hardness Ammonia pH temperature Make sure to clean out any excess food from your filter and gravel/sand. Scrub off the inside of the glass & clean the outside with Windex once you are finished.

Similar presentations


 Depth.>")


